
Measuring the Business ROI of Guest WiFi and Location Analytics
This technical reference shows IT and venue teams how to measure the ROI of guest WiFi with a defensible chain from network health and consented data to validated operational or commercial outcomes. It separates measurable evidence from assumptions, maps Purple Connect, Capture and Engage to the right measurement layer, and gives planning scenarios for hotels, retail estates and event venues.
Video overview
Listen to this guide
View podcast transcript
Part of our core series: WiFi Analytics Guide →
Executive Summary
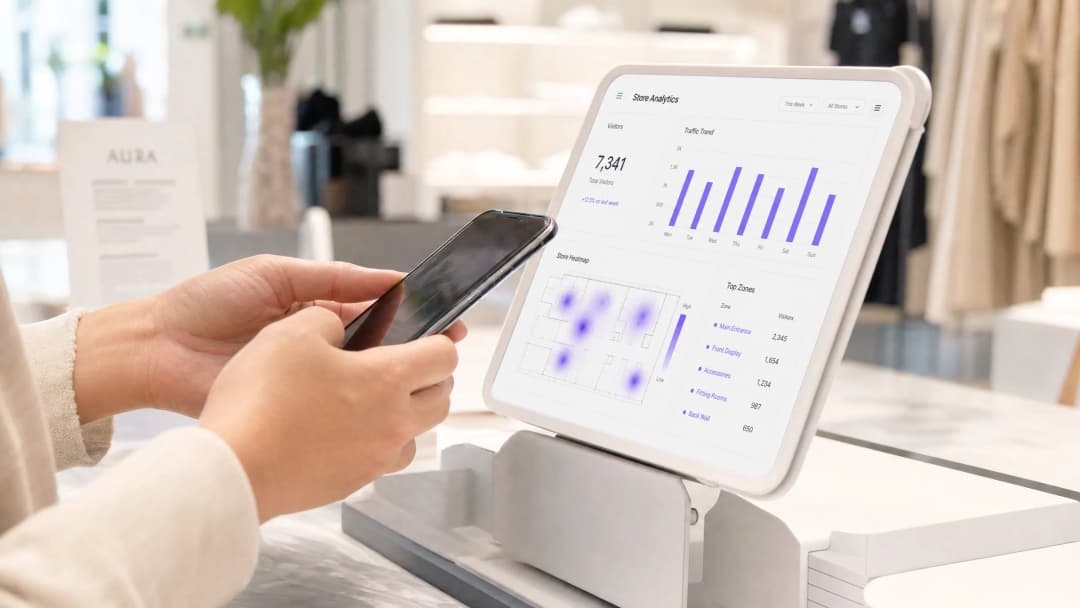
Most businesses view guest WiFi as a pure operating expense - an expected amenity, an IT budget line item, and a source of support tickets. However, this approach overlooks a fundamental shift in network capabilities. Modern WiFi infrastructures are high-resolution sensor networks that capture vast amounts of first-party data and spatial analytics.
Purple is deployed across more than 80,000 live venues, processing approximately 440 million logins and capturing 29 billion data points in 2024. The platform operates as a cloud overlay on existing hardware from Cisco Meraki, HPE Aruba, Ruckus, Juniper Mist, Ubiquiti UniFi, Cambium, Extreme Networks, and Fortinet. This guide demonstrates how to measure the ROI of this investment. Going beyond theoretical models, it provides a concrete framework for calculating value through increased dwell times, CRM database growth, operational efficiencies, and direct revenue from tiered access. Whether you manage a hotel group, a retail estate, or public venues, the measurement principles remain the same.
Technical Deep Dive: The Measurement Mechanisms
To measure ROI, you must first understand how data is generated. This process relies on two distinct methods of data collection: Presence Analytics and Engagement Analytics. Conflating these two terms risks building a flawed measurement model.
Presence Analytics
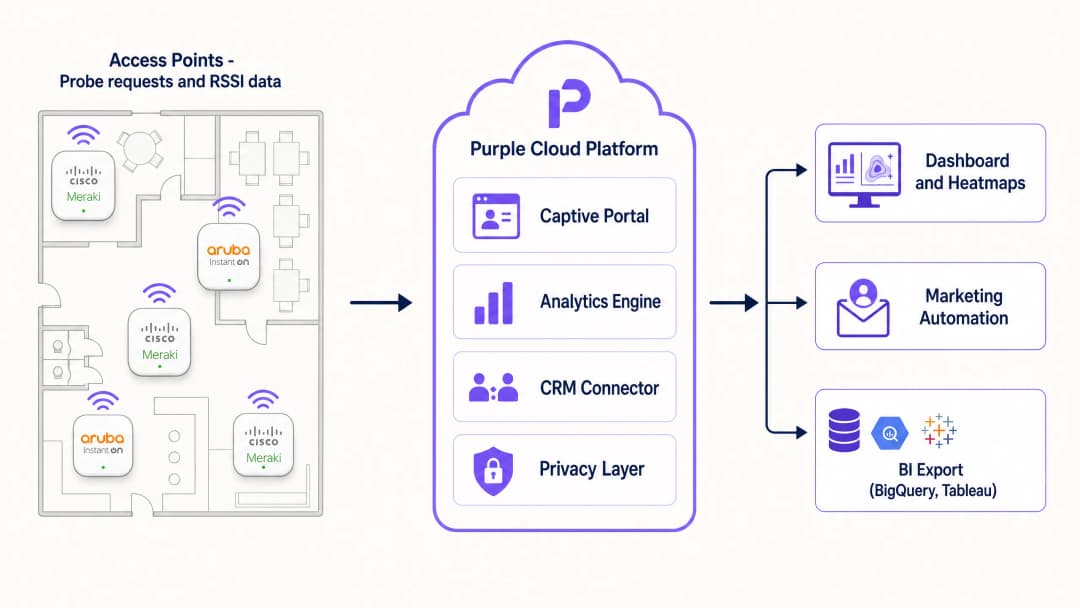
Presence Analytics captures activity before a user even connects. When a mobile device with an active WiFi module enters a venue, it transmits probe requests. The device is querying the network to see if known networks are nearby. Every Access Point in range intercepts these probe requests. They contain the device's MAC address (a unique hardware identifier) and the signal strength, expressed as RSSI (Received Signal Strength Indicator).
By triangulating RSSI values across multiple Access Points, the analytics platform estimates the physical location of the device. This forms the foundation for footfall tracking and dwell time calculation. This process is anonymous, requires no user interaction, and occurs across your venues - whether you actively capture this data or not.
Since 2020, every professional analytics deployment has faced a challenge: since iOS 14 and Android 10, mobile devices use randomised MAC addresses for probe requests. Instead of transmitting a static identifier, the device cycles through temporary addresses. If your analytics platform does not correct for this, your visitor counts will be inaccurate. Purple uses statistical correction models calibrated against real-world camera data to ensure an accuracy of ±3-7% (Purple platform data). If you are evaluating a platform that cannot explain its methodology for correcting MAC randomisation, that is a red flag.
Engagement Analytics
Engagement Analytics begins when a user connects to the guest WiFi network via a captive portal. The captive portal serves as the authentication gateway and the primary system for capturing first-party data. Once a user authenticates - whether via Microsoft Entra ID, Google Workspace, social logins, or an email form - the anonymous device is transformed into an identified visitor profile.
This identified profile is the primary driver of marketing ROI. It links physical presence to a digital identity. You can track the visit frequency of specific cohorts, measure the conversion rate of marketing campaigns, and integrate this data directly into your CRM. Using this exact data, Harrods achieved a 57-fold (57x) ROI through targeted marketing to customers acquired via guest WiFi.
Six Key Metrics for Decision-Making
WiFi analytics platforms can display dozens of metrics. However, these six metrics are the most critical for ROI calculation and decision-making:
| Metric | What It Measures | Primary Use |
|---|---|---|
| Footfall | Unique visitors in a defined zone over a specific period | Baseline location data, comparisons |
| Dwell time | Average and distribution of time spent per zone and visit | Layout optimisation, staff scheduling, conversion correlation |
| Return Visit Rate | Proportion of visitors returning within N days | Loyalty signals, marketing attribution |
| Zone Transitions | Visitor flows from starting to destination zones | Journey analytics, layout testing |
| New vs. Repeat Visitors | Ratio of acquisition to retention | Marketing channel attribution |
| Capture Rate | Proportion of detected devices that authenticate | Portal effectiveness, data quality indicator |
The capture rate deserves special attention. It bridges the gap between anonymous presence data and identified engagement data. Industry benchmarks show that the capture rate typically ranges between 15% and 40%, depending on portal design and the incentives offered. A rate below 15% indicates that the portal flow requires optimisation.
Implementation Guide: Aligning for ROI
To build a system that delivers a measurable ROI, specific architectural decisions are required. A network designed solely for coverage will not deliver precise spatial analytics.
Access Point Density and Placement
Location analytics relies on triangulation. To determine a location precisely, a device must be detected by at least three Access Points simultaneously. In typical retail or hospitality environments, this requires one Access Point per 150 to 200 square metres. Crucially, Access Points must be placed at zone boundaries, not just in the centre of a room. If you only place Access Points centrally, the system cannot accurately determine when guests cross a boundary. This is the most common reason for analytics deployment failures.
For a 3,000 square metre retail space, plan for 15 to 20 Access Points to ensure overlapping coverage at department boundaries. Compare this to a coverage-only installation, which might use only eight Access Points for signal strength without regard for triangulation accuracy.
Captive Portal Configuration
The captive portal is your conversion engine. Keep the login process to a maximum of three steps. Ask only for essential data during the first visit. If your primary goal is CRM growth, make the email address a mandatory field and use Purple Verify to validate it at the point of capture. This prevents invalid data from entering your database. For hospitality, we recommend offering premium bandwidth as an exclusive benefit for loyalty programme members. This drives sign-ups and creates a direct revenue stream from your WiFi investment.
For venues looking to frictionlessly welcome returning visitors, we recommend implementing Passpoint (Hotspot 2.0). Passpoint allows certified devices to connect automatically on subsequent visits without presenting the portal again, whilst still capturing the session data required for analytics. This is highly effective in airports and hotels with high repeat-visitor rates.
Data Integration
Data sitting idle in a portal generates no ROI. Integrate the WiFi analytics platform with your existing operational systems using standard REST APIs or webhooks. This integration step is often the biggest hurdle, as it requires alignment between IT, marketing, and operations teams who rarely share the same data infrastructure. Prioritise this task early in the project.
For retail, integration with Point of Sale (POS) systems offers the highest value. By correlating dwell times in specific zones with transaction data, you can identify high-footfall, low-conversion areas - zones where visitors linger but do not purchase. In hospitality, integration with the Property Management System (PMS) allows you to link WiFi session data directly to room bookings and food and beverage spend.
Got questions about your specific setup?
Our team works with venue operators, IT managers, and network engineers across 80,000 venues. Book a 20-minute call and we will show you how others like you solved it.
Best Practices
Implement Tiered Bandwidth
Tiered bandwidth is the most direct way to monetise guest WiFi. Offer a free, speed-limited tier for basic browsing, and a paid (or loyalty-incentivised) premium high-speed tier. This approach offsets network costs and drives loyalty programme sign-ups. AGS Airports implemented this tiered model, achieving an 842% ROI (Purple customer data). The model works because it transforms a cost centre into a revenue generator without degrading the user experience for those who choose not to pay.
Segment the Network
Do not mix guest traffic with internal corporate networks. Use VLANs to segregate guest devices from your internal systems. In retail environments processing card payments, this is a fundamental security requirement under PCI-DSS. Purple provides a RADIUS infrastructure to centrally manage these policies across your entire estate, supporting IEEE 802.1X for port-based network access control and WPA3-Enterprise for the strongest encryption standards available.
For further details on enterprise WiFi security architecture, refer to the guide Enterprise WiFi Security: A Comprehensive Guide for 2026.
Prioritise Privacy and Compliance
Privacy is not optional. If you operate in the UK or the EU, you must comply with the UK GDPR and EU GDPR. In California, CCPA applies. Your captive portal must clearly communicate what data is collected, how long it is stored, and how visitors can exercise their rights. Obtain explicit consent (opt-in) for marketing communications. Presence Analytics - which is anonymous - relies on legitimate interest, supported by a completed Data Protection Impact Assessment (DPIA) and highly visible physical signage.
Purple is ISO 27001 certified, GDPR compliant, CCPA compliant, and Cyber Essentials certified. The platform is supplied with DPIA templates and signage templates, so you do not have to build compliance infrastructure from scratch. For detailed information on compliance architecture, refer to the guide WiFi GDPR Compliance: How to Securely Collect Guest Data via Captive Portals.
Troubleshooting and Risk Mitigation
Inaccurate Location Data
If your heatmaps show visitors in impossible locations, or if zone-level counts do not align with physical observations, the issue is usually Access Point placement or transmit power configuration. Ensure that Access Point positions on your floor plans match physical locations exactly. Verify that transmit power is not set too high - overly powerful Access Points create large, overlapping coverage cells, which degrades triangulation accuracy. Reduce transmit power and increase Access Point density to improve spatial resolution.
Low Captive Portal Conversion
If a high number of devices are detected but fewer than 15% authenticate, you should review the portal flow. Common causes include: too many mandatory fields, a portal failing to load in the device's default browser, a lack of clear incentives to connect, or a portal that is not mobile-optimised. Test the portal on iOS and Android devices before rollout. Remove any non-essential fields. If you are offering a clear value proposition - such as free WiFi, discounts, or loyalty points - highlight this prominently on the splash page.
Integration Failures
If data is not flowing into your CRM or POS system, first verify API credentials and webhook configurations. Ensure that the data fields mapped in the WiFi platform align with the corresponding fields in the target system. Check API logs for rate-limiting or authentication errors. Most integration failures stem from configuration issues rather than platform errors. Ensure your IT team documents the field mapping prior to go-live.
Overcounting Due to MAC Randomisation
If your WiFi visitor counts are significantly higher than data from your footfall counters or camera systems, your platform is not correcting for MAC randomisation. This is a known issue with platforms that have not updated their analytics methodologies since 2020. Ask your vendor for their correction methodology and validation data. Purple's correction keeps variance within ±3-7% compared to physical camera data (Purple platform data).
ROI and Business Value
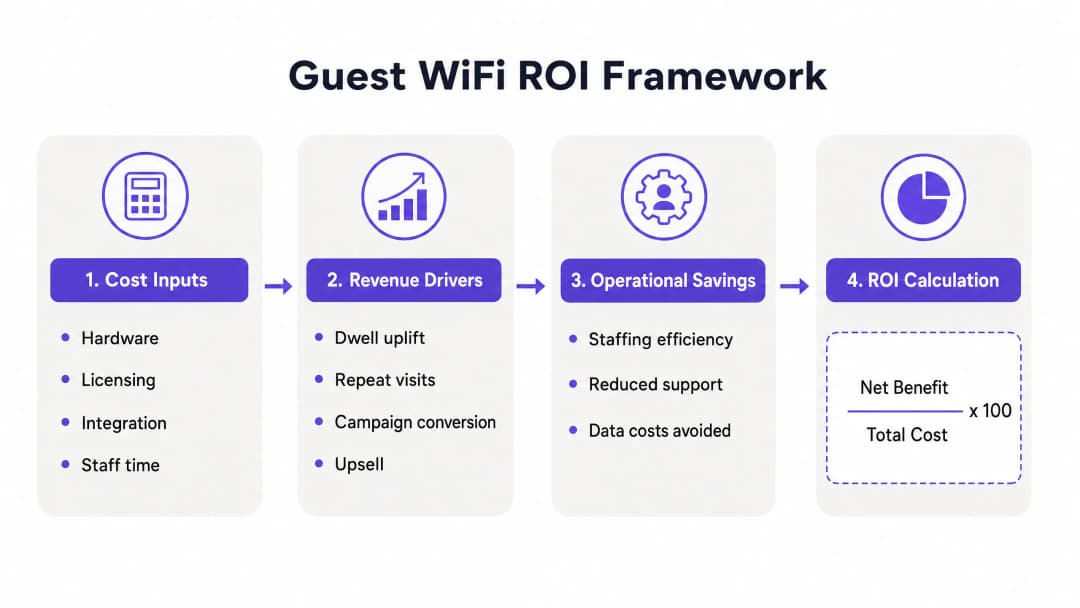
Measuring the ROI of guest WiFi requires a structured approach. You must quantify the costs and compare them against the measurable benefits across four categories.
Cost Factors
Total Cost of Ownership (TCO) includes: hardware (Access Points, switches, cabling); software licensing (the Purple cloud overlay, available in Connect, Capture, and Engage tiers); deployment services; and ongoing staff overheads for administration and reporting. For a 200-room hotel deploying across five sites, the true three-year TCO will encompass hardware upgrades, licensing, and integration effort.
Revenue Drivers
Industry data shows that 62% of businesses report increased customer dwell time when free WiFi is provided (BT Business WiFi Survey, 2025). In retail, longer dwell time correlates directly with larger basket size. A 10% increase in dwell time within a specific department, paired with a 2% uplift in sales for that category, provides a clear, causal ROI signal. CRM database growth is the second major revenue driver. Calculate the value of a new email subscriber based on your average campaign conversion rate and average order value. If your email campaigns convert at 3% with an average order value of £80, each new subscriber has an expected campaign value of £2.40. A venue acquiring 500 new subscribers monthly generates £1,200 in expected monthly campaign revenue from this channel alone.
For venues utilising tiered bandwidth, direct revenue from premium subscriptions provides an immediately measurable return. AGS Airports achieved an 842% ROI using their tiered model (Purple customer data).
Operational Savings
Footfall data mapped against staff rotas prevents overstaffing during quiet periods. A venue experiencing a consistent 30% drop in footfall on Tuesday mornings can reduce staffing levels for that window, yielding direct cost savings. In healthcare and transport, visitor flow data also aids queue management and capacity planning, minimising bottlenecks without increasing headcount.
ROI Calculation
The standard ROI formula applies: ROI (%) = ((Net Benefit - Total Cost) / Total Cost) x 100. Net benefit is the sum of incremental dwell-time revenue, CRM campaign revenue, tiered access revenue, and operational savings. Total cost includes hardware, licensing, deployment, and ongoing administration.
For most hospitality and retail deployments, Purple customers see a measurable ROI within six months. The first 90 days are dedicated to establishing baseline data. Over the subsequent 90 days, operational and marketing value begins to fully materialise.
Further Reading
- Guest WiFi - Purple's core platform for guest connectivity
- WiFi Analytics - Analytics and marketing platform
- Design of a Survey: A Practical Guide for Venues - How to use the captive portal for structured feedback
- What Is Wireless Display: Protocols and Best Practices 2026 - Reference for complementary wireless technologies
Key Definitions
ROI of guest WiFi
Net attributable benefit plus verified cost avoidance, less programme cost, expressed against programme cost.
Use it when finance asks whether to extend, change or stop the programme.
Guest WiFi
A visitor access service that can provide a branded connection and record defined usage and performance metrics.
Set the service baseline before adding data capture or campaigns.
Captive portal
The branded access page used to present a Guest WiFi connection flow.
Use it to define consent, data fields and the visitor experience.
First-party data
Contact or demographic data collected directly from a visitor through an approved flow.
It matters when enriching a CRM and building a permissioned audience.
Verified email record
A contact record checked to reduce invalid email addresses before CRM use.
It is the correct denominator for a reachable email audience.
IEEE 802.1X
A port-based network access control standard using EAP and EAPOL for mutual authentication.
It is relevant when you discuss access control for staff or managed-device networks.
WPA3
A WiFi security programme that uses current security protocols and requires Protected Management Frames.
Review it when your network team evaluates access security and client compatibility.
Protected Management Frames
Security protections for WiFi management action frames, required in WPA3 networks.
They matter when reviewing the policy effects of a WPA3 deployment.
PCI DSS
A set of technical and operational requirements intended to protect payment account data.
Review it when Guest WiFi architecture could affect the cardholder data environment.
Location analytics
Analysis of visitor behaviour, return rate or zone activity from the approved data set.
Use it to test operational changes in layout, staffing, signage or timing.
Worked Examples
A 200-room hotel needs to reduce connectivity complaints and validate post-stay booking signals.
Export eight comparable weeks of join success, coverage incidents, service-desk contacts, consented capture, verified email records and booking-system outcomes. Run a defined-period change to the access flow or post-stay communication. Measure the rate of connectivity complaints, CRM match rate and booking-system-confirmed responses. Add only approved avoided support effort and confirmed booking contribution to the ROI numerator.
A retail estate needs to test whether a consented offer delivers an incremental redemption result.
Select matched test and control stores with the same offer dates, staff briefing and product availability. Capture verified contacts only after a conscious choice. Match approved offer exposure to loyalty or point-of-sale records. Compare the change in redemption between test and control stores, keeping raw join volume outside the revenue calculation.
A stadium needs to test whether a concourse service-position change improves the attendee experience.
Choose comparable event bands, define the zones and use the same observation method. Combine Guest WiFi zone signals with queue observations, service-desk records and venue-held concession data. Record the operational change and test period. Report the agreed queue or service metric and any independently validated concession outcome, rather than treating the heatmap as financial proof.
Continue reading in this series
Privacy by Design: Anonymising WiFi Data for GDPR Compliance
This authoritative guide details the technical architecture and implementation strategies for anonymising WiFi data to ensure GDPR compliance. It provides IT leaders and network architects with actionable frameworks for balancing robust venue analytics with strict data privacy requirements.
Heatmapping vs Presence Analytics: Technical Differences
This authoritative technical guide details the critical architectural and operational differences between WiFi heatmapping and presence analytics for enterprise venue operators. It provides IT leaders, network architects, and operations directors with actionable deployment frameworks, real-world implementation scenarios, and vendor-neutral best practices for extracting maximum ROI from their existing wireless infrastructure.
How to Calculate Dwell Time Using WiFi Location Analytics
This guide provides a comprehensive technical reference for calculating wifi dwell time using WiFi location analytics, covering the full architecture from 802.11 probe request capture through RSSI-based trilateration to geofenced zone analysis. It is designed for IT managers, network architects, and venue operations directors who need to deploy accurate, scalable location intelligence across retail, hospitality, healthcare, and public-sector environments. Readers will gain actionable implementation guidance, real-world case studies, and a clear framework for translating raw spatial data into measurable business outcomes.
Got questions about your specific setup?
Our team works with venue operators, IT managers, and network engineers across 80,000 venues. Book a 20-minute call and we will show you how others like you solved it.