Tiempo medio hasta la inocencia: cómo demostrar que no es el WiFi
El tiempo medio hasta la inocencia (MTTI) es la métrica crítica que define cuánto tiempo pasan los equipos de TI demostrando que un problema de red no es culpa suya. Esta guía detalla una metodología de observabilidad de cinco pasos para eliminar el juego de las culpas en entornos multi-tenant, sustituyendo las acusaciones mutuas por pruebas compartidas para reducir el tiempo medio de resolución (MTTR).
Escuchar esta guía
Ver transcripción del podcast
📚 Part of our core series: WiFi multi-tenant: la guía completa →
Resumen ejecutivo
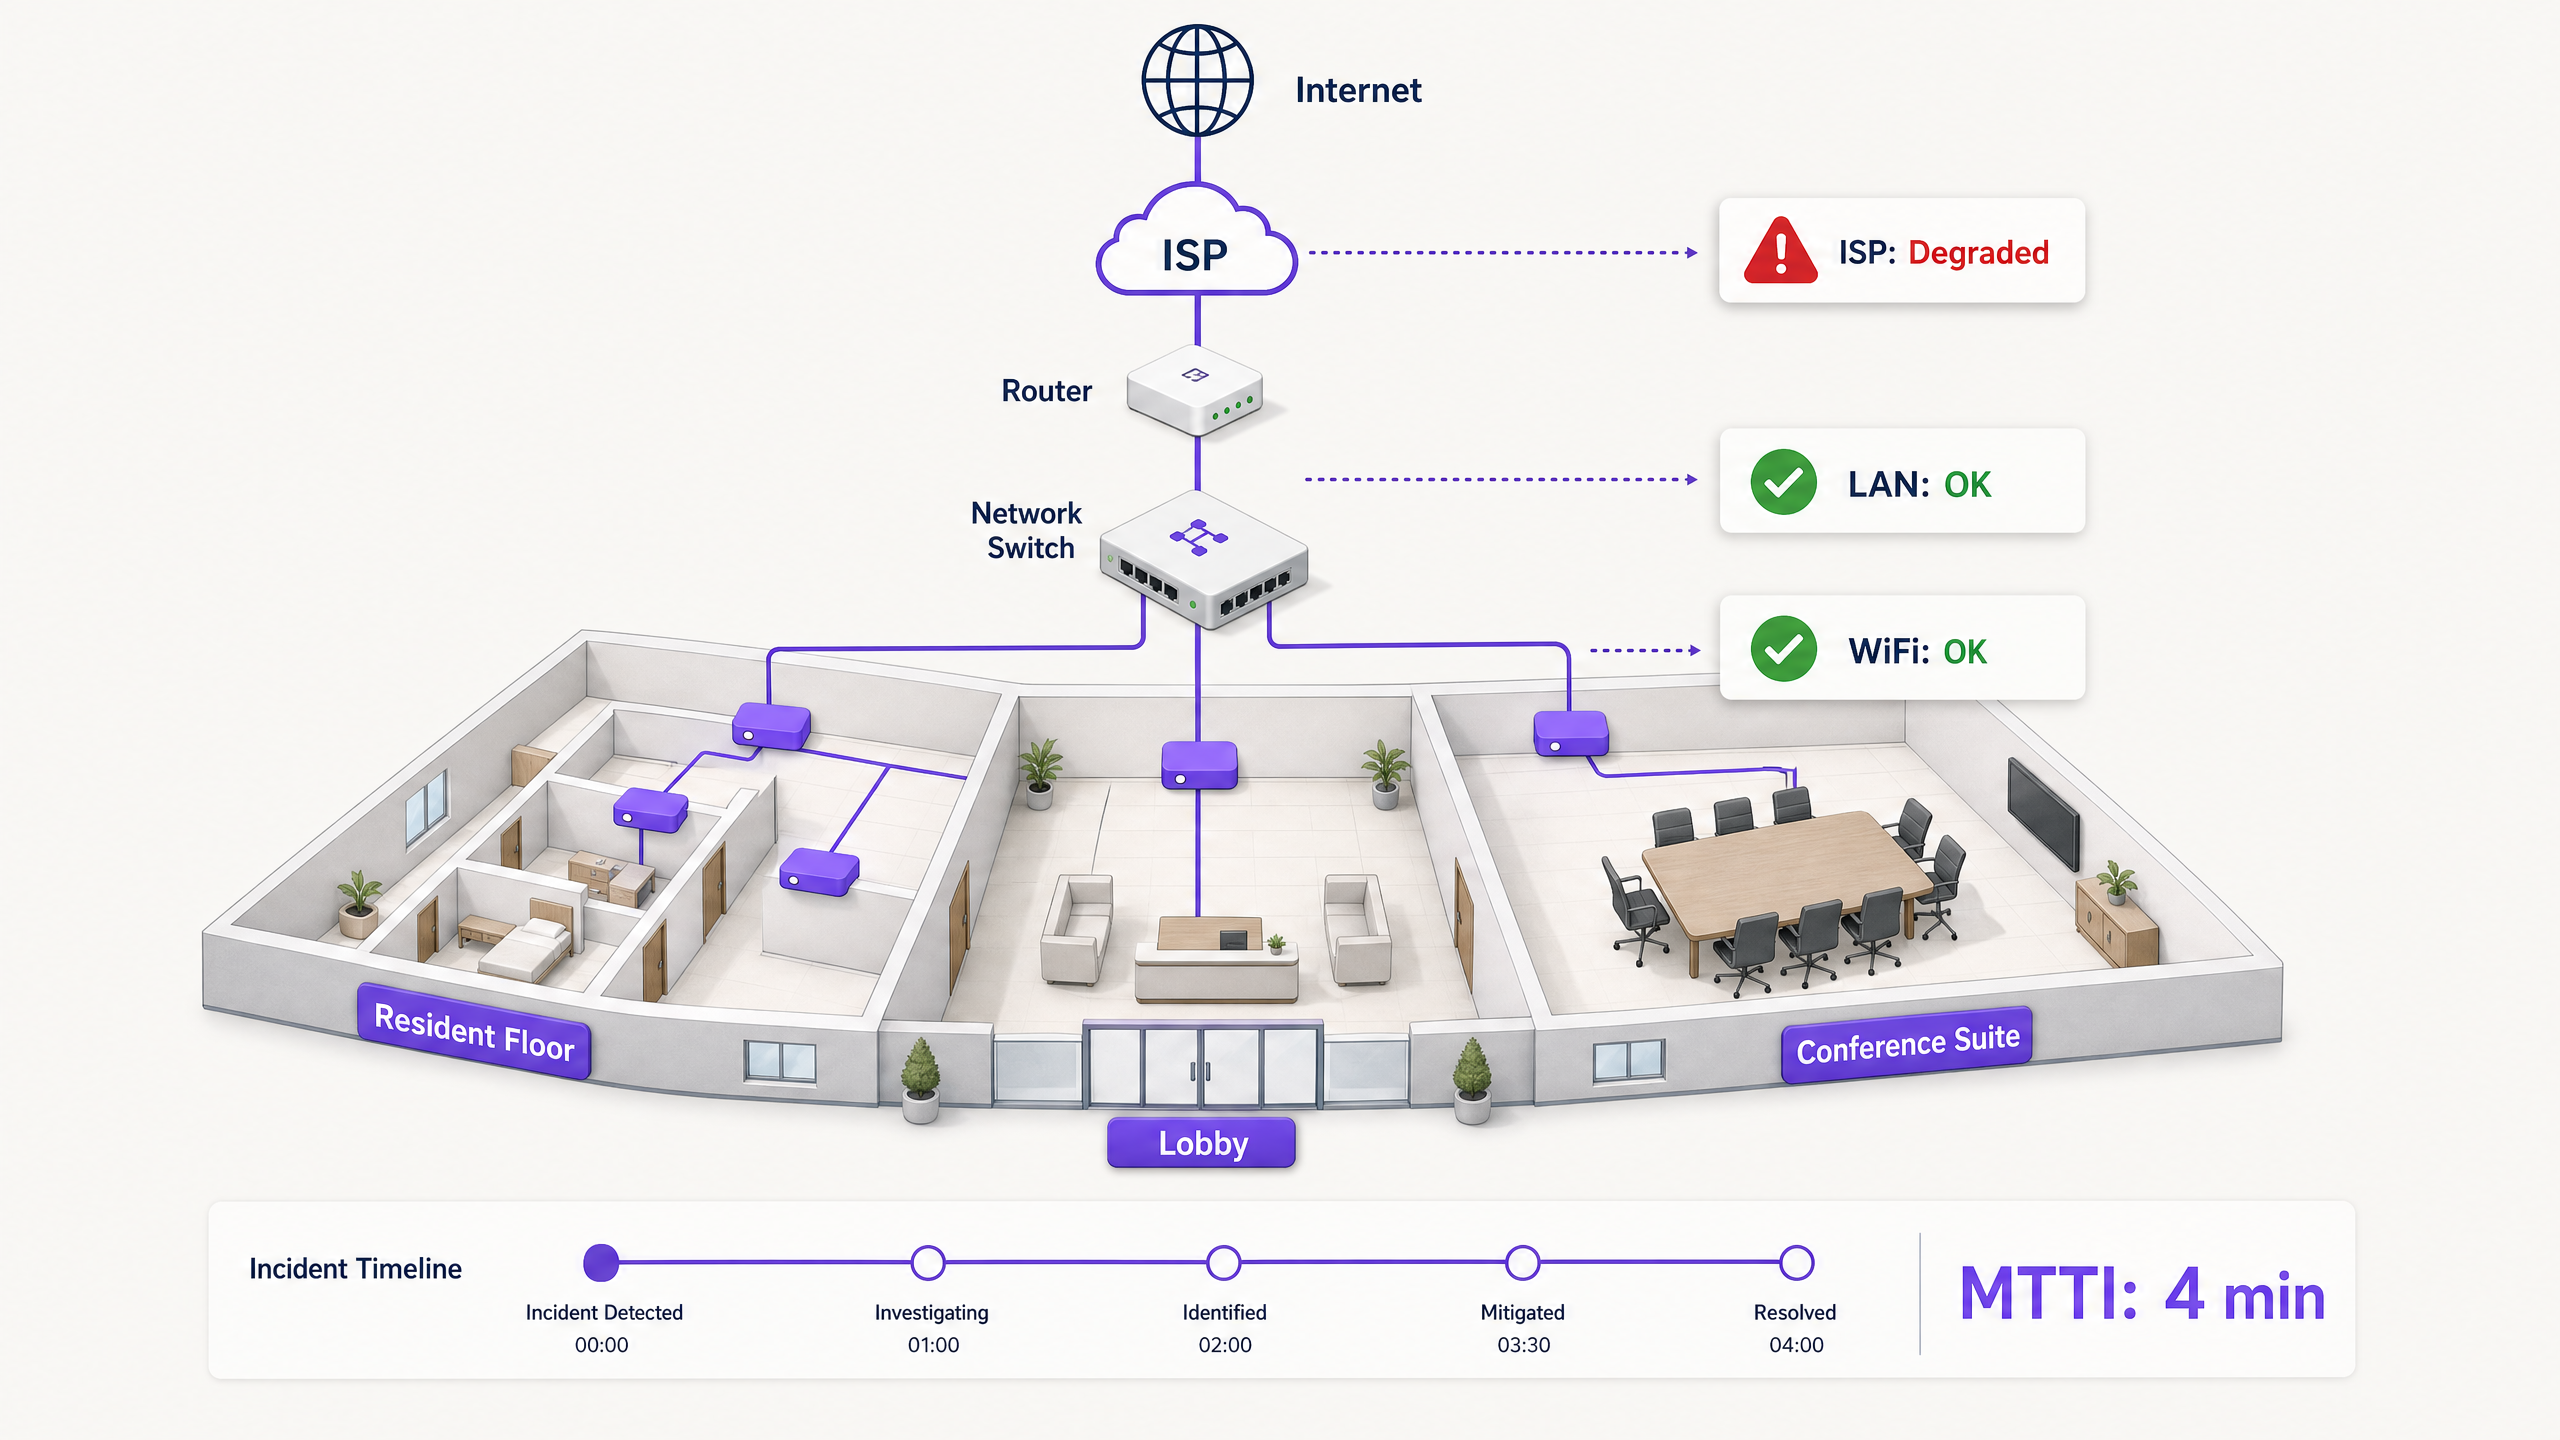
Cuando la conectividad cae en un entorno multi-tenant, el WiFi es el primer acusado. Es el extremo visible de la red, el último salto antes del dispositivo y el objetivo más fácil para los usuarios frustrados. Para los responsables de TI, arquitectos de red y directores de operaciones de recintos, esto genera un coste operativo persistente: el tiempo dedicado a demostrar la inocencia.
El tiempo medio hasta la inocencia (MTTI) mide el tiempo medio transcurrido entre la notificación de una incidencia y la capacidad de un equipo para demostrar que su dominio no es la causa raíz. En entornos complejos como bloques de viviendas de alquiler (BTR), hoteles o centros de conferencias, la red está fragmentada entre gestores de la propiedad, proveedores de WiFi gestionado y proveedores de servicios de internet (ISP). Sin una telemetría definitiva, el MTTI infla el tiempo medio de resolución (MTTR), ya que los equipos discuten sobre la responsabilidad en lugar de solucionar el fallo.
Esta guía detalla una metodología de observabilidad de cinco pasos para reducir sistemáticamente el MTTI. Al implementar comprobaciones sintéticas continuas, visibilidad de ruta salto a salto, análisis de datos de flujo, mapeo de topología y correlación de eventos, puede sustituir las acusaciones mutuas por pruebas compartidas. El objetivo no es ganar el juego de las culpas más rápido, sino acabar con él por completo.
Análisis técnico detallado: el funcionamiento del MTTI
La diferencia entre MTTI y tiempo medio de identificación
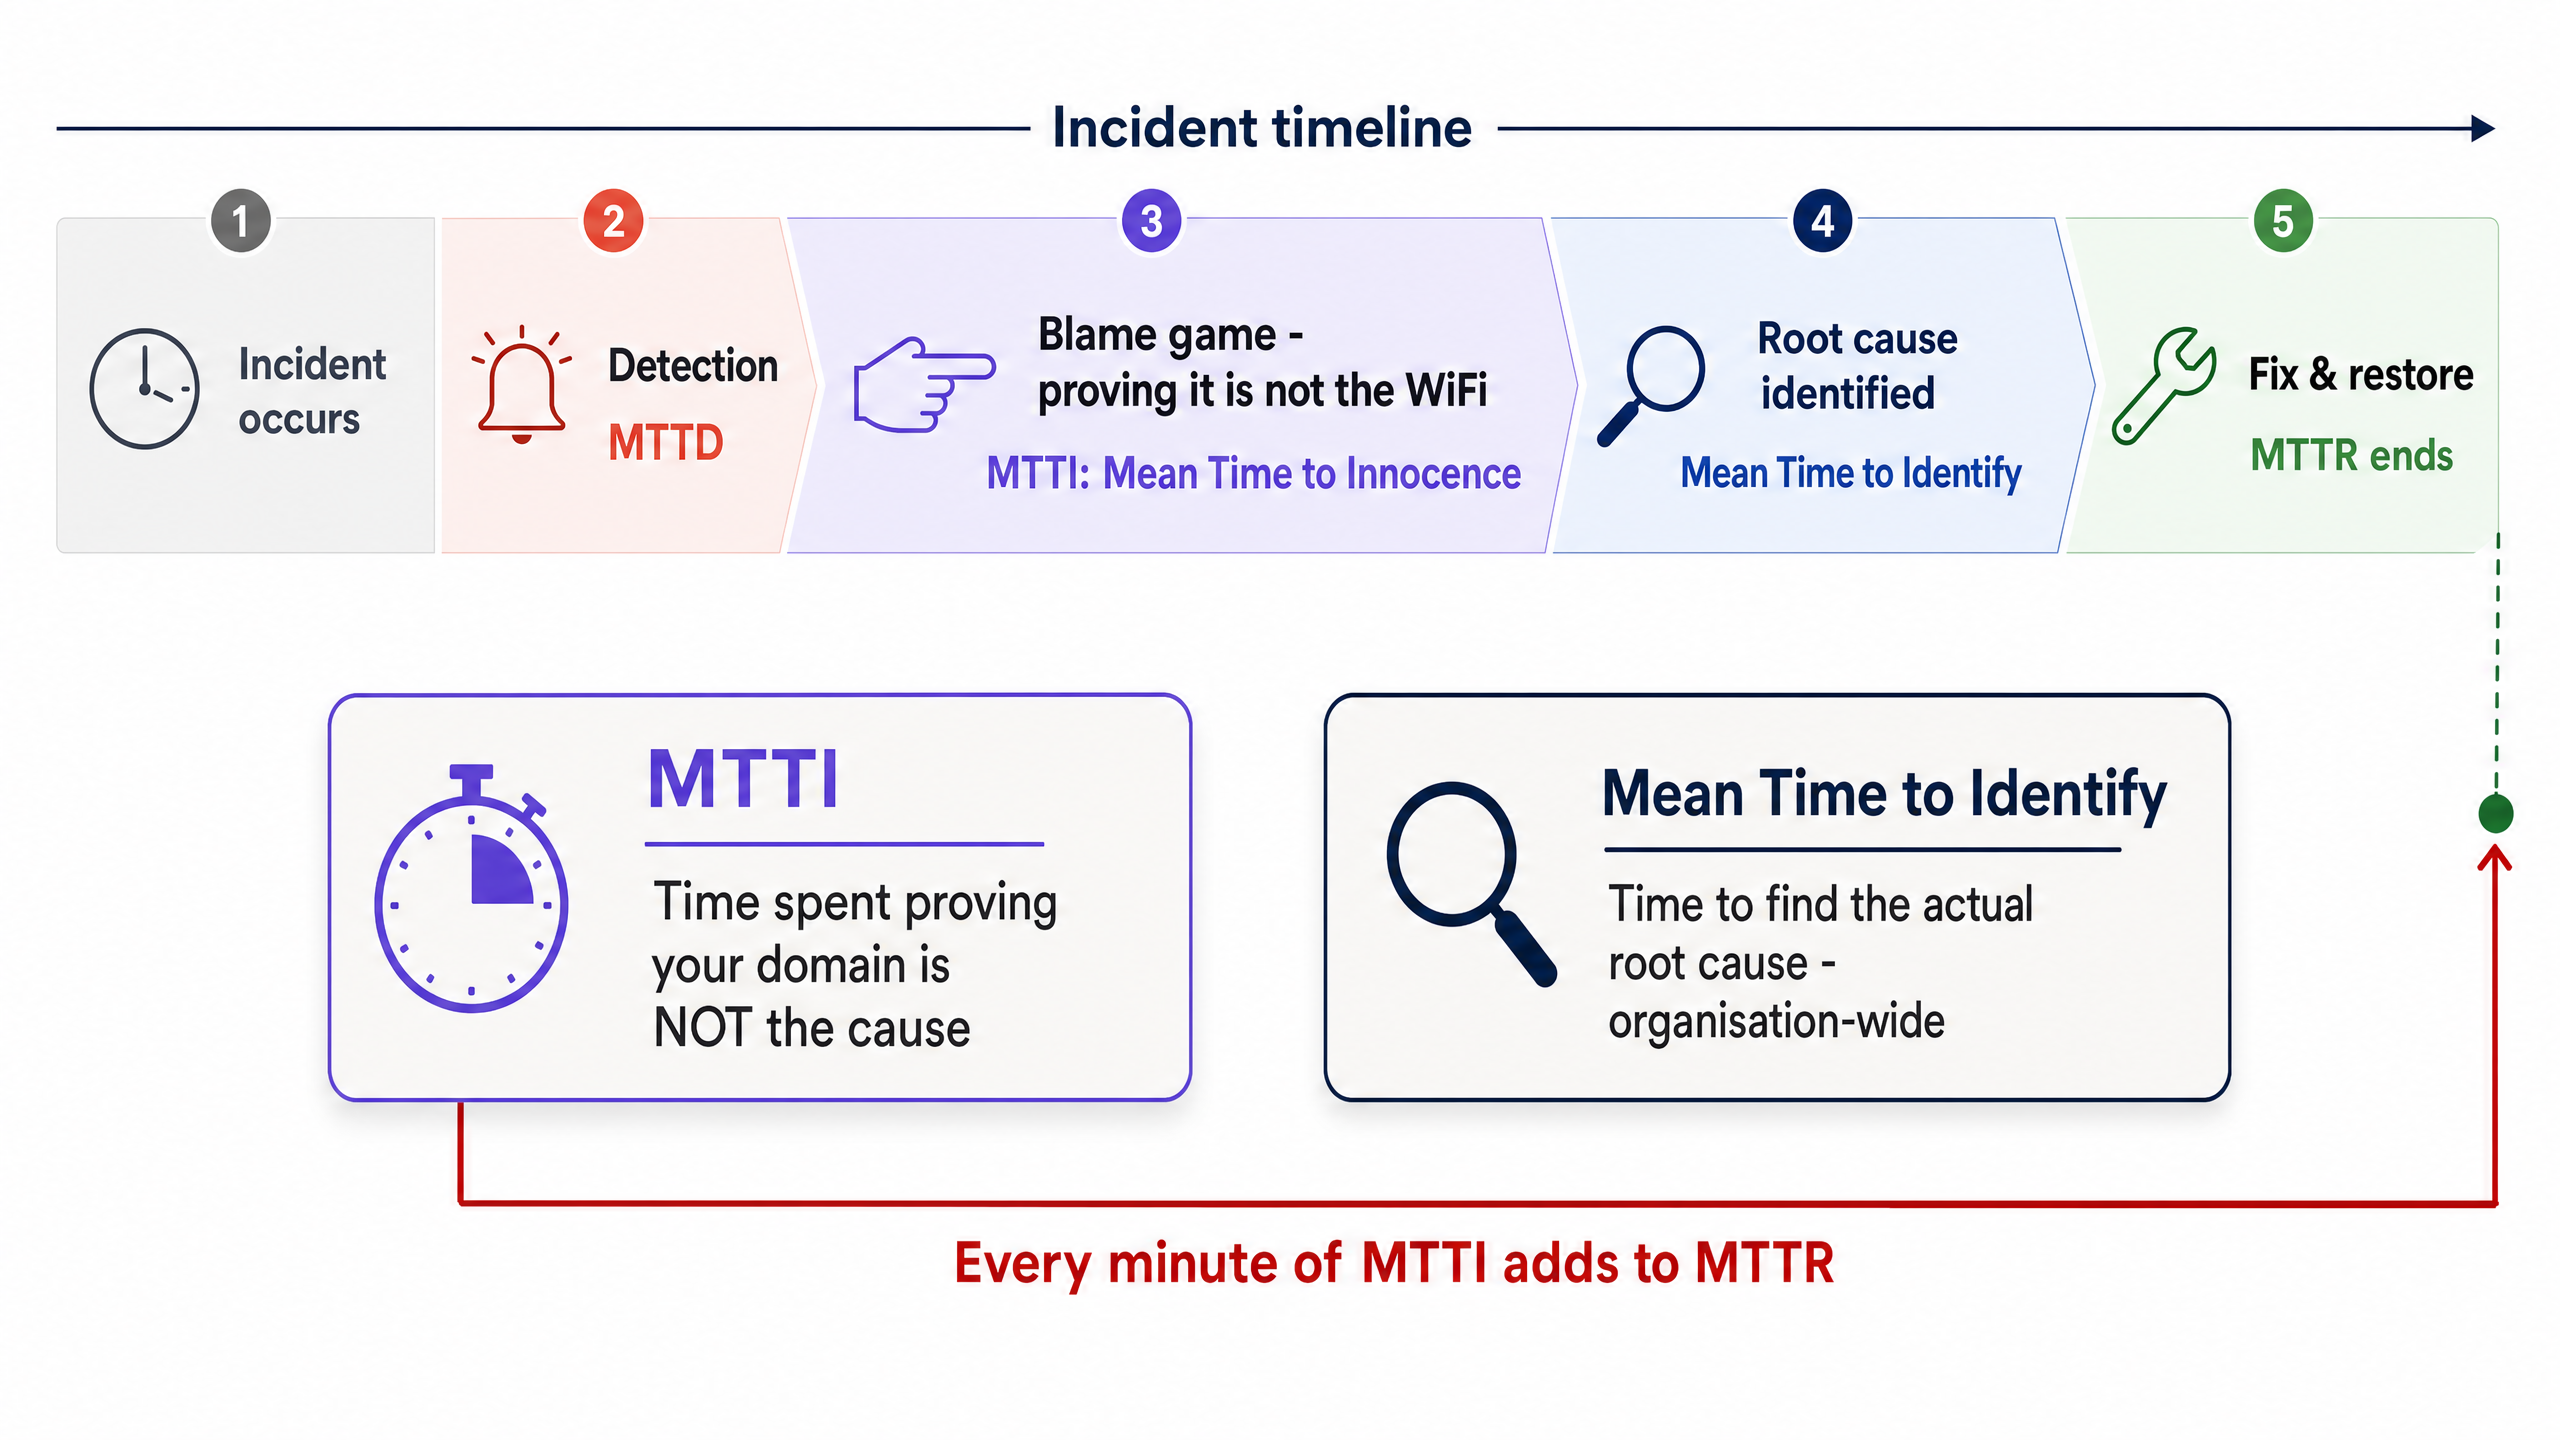
Es fundamental separar el MTTI del tiempo medio de identificación. El tiempo medio de identificación es una métrica global de la organización que registra cuánto se tarda en encontrar la causa raíz real de una interrupción. El MTTI es una métrica aislada y específica de un dominio que registra cuánto tarda un equipo en demostrar que no es el culpable.
Cada minuto de MTTI se suma directamente al MTTR. Si un proveedor de WiFi gestionado pasa 40 minutos comprobando manualmente los puntos de acceso (AP) y los registros de los switches antes de concluir que el problema es del ISP, el MTTR ya acumula una penalización de 40 minutos antes de que comience la resolución real.
Por qué el WiFi se lleva las culpas
En entornos que dan servicio a 350 millones de usuarios únicos en más de 80 000 recintos activos, Purple observa el mismo patrón de forma recurrente. Se culpa a la capa WiFi por defecto debido a tres realidades estructurales:
- Sesgo de visibilidad: el indicador de señal WiFi es la única herramienta de diagnóstico de red disponible para el usuario medio del recinto.
- Proximidad del extremo: al ser el último salto hasta el dispositivo cliente, el WiFi hereda los síntomas de cualquier fallo ascendente. Un tiempo de espera agotado de DNS en el ISP parece idéntico a un fallo del AP desde la perspectiva del usuario.
- Brechas de telemetría: históricamente, demostrar el buen estado de la red inalámbrica requería intervención manual. Si no puede demostrar que la capa inalámbrica funciona correctamente en menos de dos minutos, perderá el control de la situación.
La complicación multi-tenant
En una empresa single-tenant, los equipos de red controlan toda la infraestructura, desde el AP hasta el firewall. En entornos WiFi multi-tenant, la propiedad está fragmentada.
Un residente de un bloque BTR paga al gestor de la propiedad. El gestor de la propiedad contrata a un proveedor de WiFi gestionado. El proveedor de WiFi gestionado depende de un circuito ISP de terceros y, a menudo, de la red de distribución interna del edificio del propietario. Cuando un residente no puede reproducir vídeo en streaming, el proveedor debe exculpar rápidamente al hardware WiFi (Cisco Meraki, HPE Aruba, Ruckus o Juniper Mist) y aislar el fallo en el dispositivo cliente, el switch del edificio o el ISP. No hacerlo perjudica la relación comercial entre el proveedor y el gestor de la propiedad.
Guía de implementación: la metodología de 5 pasos
Para reducir sistemáticamente el MTTI, implemente esta arquitectura de observabilidad de cinco capas.
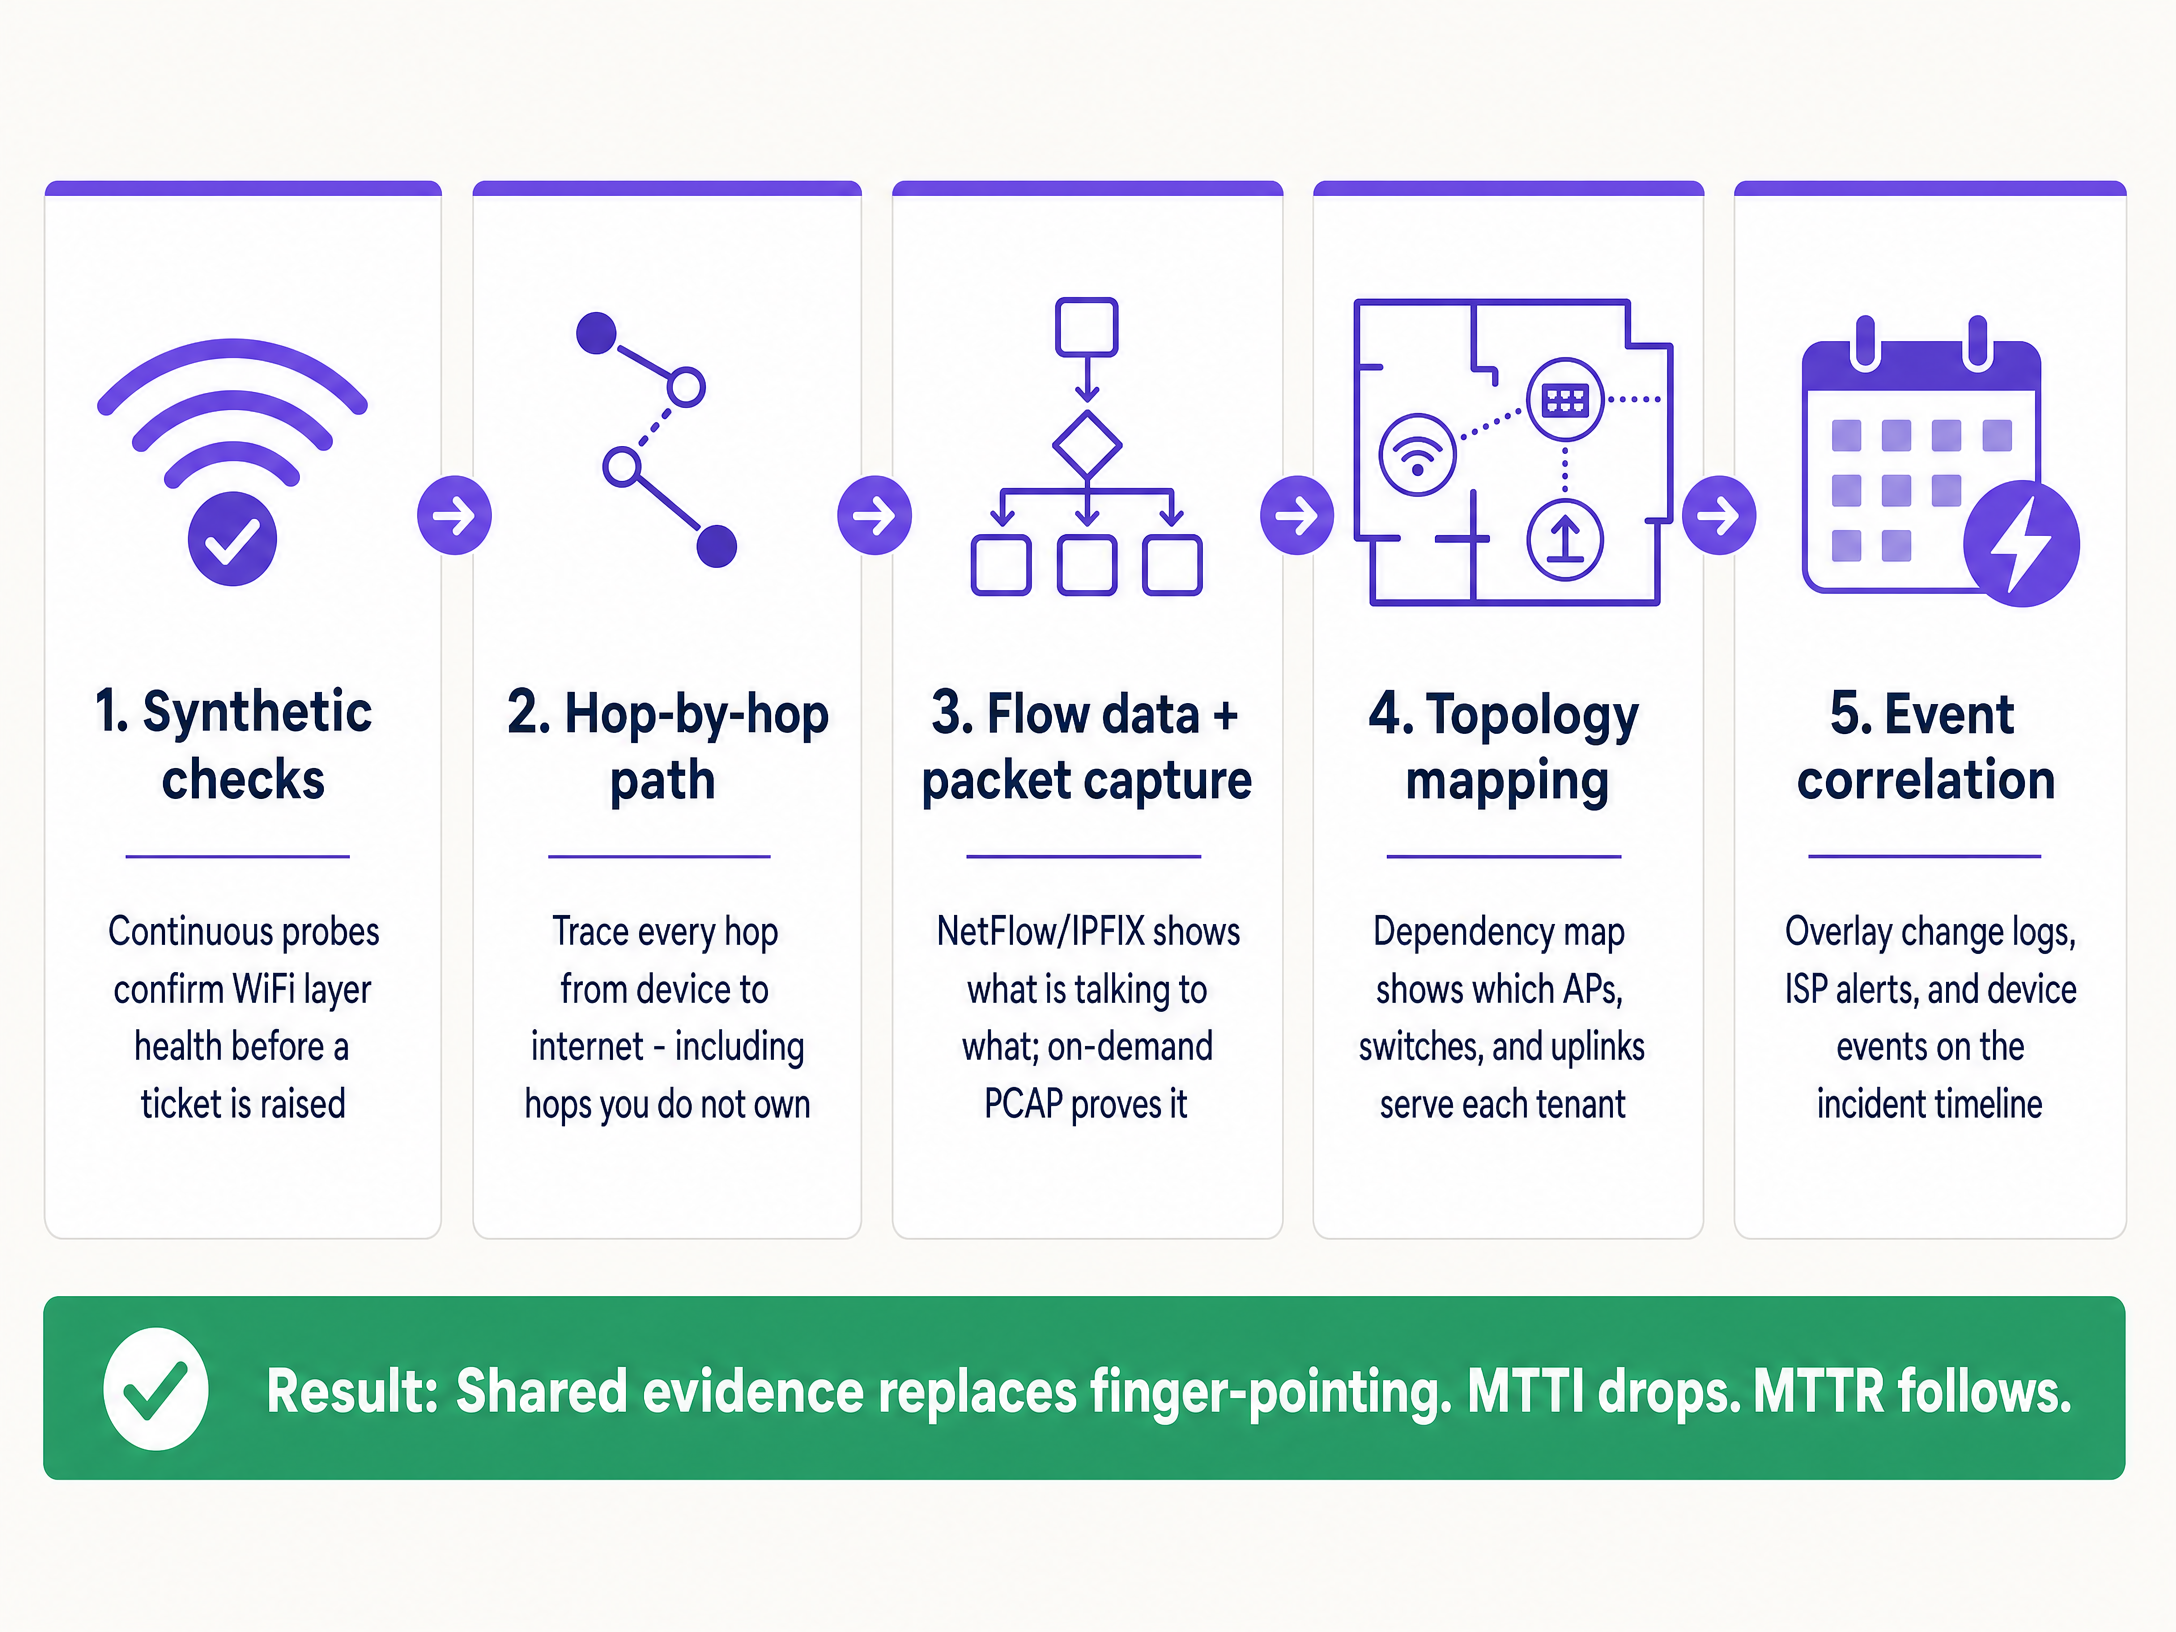
1. Comprobaciones sintéticas continuas
No espere a que un usuario se queje. Implemente sondas sintéticas automatizadas que emulen continuamente el comportamiento del usuario desde el extremo de la red.
- Implementación: configure los AP o sensores dedicados para ejecutar pruebas programadas de respuesta DHCP, resolución DNS, accesibilidad HTTP y flujos de autenticación (como inicios de sesión 802.1X o Captive Portal).
- Resultado: cuando se abre un ticket, lo primero que hace es consultar el panel sintético. Si las sondas muestran una accesibilidad HTTP limpia en el momento exacto de la queja, exculpa inmediatamente a la capa WiFi y al circuito WAN, y centra la atención en el dispositivo cliente específico o en la aplicación de destino.
2. Visibilidad de ruta salto a salto
Demostrar que su hardware funciona correctamente no es suficiente si no puede probar que la ruta a internet está despejada.
- Implementación: utilice herramientas de visualización de rutas para rastrear el tráfico desde la capa de acceso a través de la LAN, pasando por el punto de demarcación, hasta la red del ISP.
- Resultado: cuando se producen picos de latencia, un rastreo de ruta revela exactamente qué nodo ha introducido el retraso. Si los saltos del uno al cuatro (su dominio) muestran una latencia de 2 ms, y el salto cinco (el router de extremo del ISP) muestra una latencia de 150 ms y una pérdida de paquetes del 12 %, tendrá una prueba definitiva que presentar al ISP.
3. Datos de flujo y captura de paquetes bajo demanda
Cuando los usuarios informan de fallos específicos de una aplicación, necesita visibilidad a nivel de conversación.
- Implementación: exporte datos NetFlow o IPFIX desde sus switches principales o firewalls. Asegúrese de que el hardware de su capa de acceso admita la captura de paquetes (PCAP) remota y bajo demanda sin necesidad de que un ingeniero se desplace al lugar.
- Resultado: los datos de flujo demuestran si el tráfico hacia un servicio específico está saliendo de su red de forma limpia. Si dSi se requiere una prueba forense más profunda, un PCAP dirigido en la VLAN específica proporciona pruebas innegables de retransmisiones TCP o restablecimientos del lado del servidor.
4. Mapeo de topología y dependencias
En un entorno multi-tenant, aislar el radio de impacto es la forma más rápida de categorizar un fallo.
- Implementación: Mantenga un mapa de dependencias en vivo y actualizado dinámicamente que vincule cada AP con su switch, uplink y circuito WAN, mapeado con las VLAN de los inquilinos.
- Resultado: Si un fallo afecta a los AP de varias plantas pero solo en un único switch, el problema es el switch. Si afecta a todos los AP pero solo a la VLAN de un inquilino, se trata de un problema de configuración lógica. La delimitación rápida del alcance evita perder tiempo investigando infraestructuras que funcionan correctamente.
5. Correlación de eventos
Los datos sin contexto prolongan las investigaciones.
- Implementación: Integre los registros de cambios, las alertas de mantenimiento del ISP, las actualizaciones de firmware del hardware y los tickets de los usuarios en una única vista de línea de tiempo.
- Resultado: Superponer un pico de fallos de autenticación con un evento de expiración de certificado de Microsoft Entra ID que ocurrió 10 minutos antes identifica de inmediato la causa raíz, omitiendo por completo el hardware de red.
Buenas prácticas
- Estandarice la pila de hardware: Limite los despliegues a proveedores empresariales de referencia (Cisco Meraki, HPE Aruba, Ruckus, Juniper Mist, Ubiquiti UniFi, Cambium, Extreme, Fortinet) que expongan APIs para pruebas sintéticas y PCAP remoto.
- Automatice las pruebas: Configure su plataforma de monitorización para adjuntar automáticamente los resultados de las pruebas sintéticas y las trazas de ruta a los tickets de ITSM en el momento en que se crean.
- Comparta el panel de control: Proporcione a los gestores de la propiedad acceso de solo lectura a un panel de control de estado de alto nivel. La transparencia evita el juego de culpas.
- Realice un seguimiento formal del MTTI: Mida el tiempo transcurrido entre la creación del ticket y el momento en que su equipo aporta pruebas de inocencia. Trátelo como un KPI principal junto con el MTTR.
Resolución de problemas y mitigación de riesgos
- Riesgo: El bucle de 'ningún fallo detectado': Los usuarios informan de problemas, pero las comprobaciones sintéticas se muestran en verde.
- Mitigación: Es probable que el problema sea específico del dispositivo o esté relacionado con interferencias de RF (interferencia cocanal o de canal adyacente, u obstrucción física). Utilice análisis del lado del cliente para comprobar el RSSI y el historial de roaming del dispositivo específico.
- Riesgo: Negación del ISP: El ISP se niega a aceptar el fallo a pesar de sus pruebas.
- Mitigación: Proporcione trazas de ruta salto a salto que muestren la dirección IP exacta donde comienza la pérdida de paquetes. Comparta PCAP que demuestren una salida limpia desde su punto de demarcación. Los datos objetivos obligan a escalar el problema más allá del soporte de Nivel 1.
- Riesgo: Fallos en el Captive Portal: Los usuarios culpan al WiFi cuando el portal no se carga.
- Mitigación: Aísle al proveedor de identidad. Compruebe el estado de la integración (Microsoft Entra ID, Okta, Google Workspace). Si la red permite el tráfico de autenticación previa pero el IdP agota el tiempo de espera, la red es inocente.
ROI e impacto empresarial
Reducir el MTTI ofrece un valor empresarial medible que va más allá del simple ahorro de horas de ingeniería.
- Reducción del MTTR: Eliminar 40 minutos de acusaciones mutuas en un incidente reduce directamente el tiempo de inactividad, protegiendo los ingresos en entornos de retail y hospitality .
- Cumplimiento de SLA: Una exoneración más rápida evita que se apliquen penalizaciones injustas al proveedor de WiFi gestionado cuando el fallo reside en el ISP o en la infraestructura del edificio.
- Retención de clientes: En el sector del WiFi multi-tenant, los gestores de propiedades renuevan los contratos con los proveedores que ofrecen transparencia y respuestas rápidas. Las pruebas compartidas generan confianza; los argumentos defensivos la destruyen.
- Optimización de recursos: Los ingenieros de redes de Nivel 3, altamente cualificados y remunerados, dedican su tiempo a diseñar soluciones en lugar de demostrar manualmente que la red funciona correctamente.
Definiciones clave
Mean Time to Innocence (MTTI)
The average time required for a specific IT team to prove, using objective data, that their domain or infrastructure is not the root cause of a reported incident.
Critical for managed WiFi providers who must defend their service against property managers and ISPs.
Mean Time to Identify
The organisation-wide metric tracking the total time elapsed from incident detection to the discovery of the actual root cause.
MTTI is a subset of this metric. Reducing MTTI directly reduces the overall time to identify.
Synthetic Checks
Automated, continuous tests that emulate user traffic (e.g., DNS lookups, HTTP requests) to proactively monitor network health.
Used to prove the WiFi layer was functioning correctly at the exact moment a user complained.
Hop-by-Hop Path Visibility
Telemetry that traces network traffic node-by-node from the client to the destination, measuring latency and loss at each specific router or switch.
Essential for proving a fault lies in an ISP network or a landlord's distribution switch, rather than the managed WiFi hardware.
Flow Data (NetFlow/IPFIX)
Network protocol data that provides a summary of traffic conversations, showing source, destination, protocol, and volume.
Used to prove that specific application traffic is successfully leaving the local network.
On-Demand Packet Capture (PCAP)
The ability to remotely record raw network traffic from an access point or switch for forensic analysis.
The ultimate proof used to demonstrate server-side errors or client device misbehaviour.
Blast Radius
The scope of impact of a specific incident (e.g., one user, one AP, one switch, one tenant, or the entire building).
Determining the blast radius via topology mapping is the fastest way to exclude healthy infrastructure from an investigation.
Event Correlation
The practice of overlaying different data streams (logs, alerts, updates) on a single timeline to identify cause and effect.
Used to prove that a network outage was caused by a third-party change, such as an unannounced ISP maintenance window.
Ejemplos prácticos
A 350-room hotel reports that in-room WiFi is slow across the entire property. The front desk blames the managed WiFi provider. How do you exonerate the network and find the root cause?
- Check the synthetic probes: DNS and HTTP reachability tests show the APs have a clean connection to the internet. 2. Review the topology map: The issue affects all APs across all switches, ruling out edge hardware. 3. Execute a path trace: The trace shows 2ms latency within the hotel LAN, but 180ms latency at the third hop (the ISP's aggregation router). 4. Export the evidence: Send the path trace screenshot to the hotel manager and the ISP.
A national retailer reports point-of-sale (POS) terminals in one region are dropping connections to the payment processor. The network team is blamed for a firewall or routing misconfiguration.
- Isolate the blast radius: Confirm only POS terminals (specific VLAN) are affected; guest WiFi and back-office systems are healthy. 2. Analyse flow data: NetFlow confirms traffic destined for the payment processor's IP range is successfully leaving the store routers. 3. Capture packets: An on-demand PCAP on the POS VLAN reveals the payment processor's server is sending TCP resets (RST). 4. Share the PCAP with the payment processor's support team.
Preguntas de práctica
Q1. A tenant in a coworking space complains they cannot access their corporate VPN. Other tenants are browsing the internet without issue. What is the most efficient way to prove the WiFi network is not at fault?
Sugerencia: Consider the blast radius and the specific type of traffic failing.
Ver respuesta modelo
First, use the topology map to confirm the blast radius is limited to one user or one specific service, ruling out a general AP or switch failure. Second, analyse flow data (NetFlow/IPFIX) for that client's IP address. If the flow data shows the VPN traffic (e.g., UDP 500 or TCP 443) is leaving the network cleanly, the WiFi and LAN are innocent. The issue is either the client's VPN configuration or the corporate firewall blocking the connection.
Q2. Your monitoring dashboard shows an AP has gone offline, but the property manager insists the WiFi is broken because the ISP is down. How do you prove the issue is internal power, not the ISP?
Sugerencia: Look for correlation between infrastructure state and external events.
Ver respuesta modelo
Use event correlation and topology mapping. If the topology map shows only one AP is offline while others on the same switch are functioning, the ISP circuit is clearly active. Event correlation might show a PoE (Power over Ethernet) failure log from the switch port connected to that specific AP. This proves the issue is local hardware or cabling, not the WAN circuit.
Q3. A stadium operations director claims the WiFi failed during halftime because ticket scanners stopped working. You need to exonerate the network in under two minutes. What telemetry do you use?
Sugerencia: You need historical proof of health at the exact moment of the reported failure.
Ver respuesta modelo
Pull the historical data from the continuous synthetic checks. Show the operations director the dashboard confirming that during the exact 15-minute halftime window, the APs were successfully resolving DNS and reaching the ticketing server's IP address with low latency. This immediately proves the wireless network was healthy and shifts the investigation to the ticketing application servers, which likely buckled under the sudden load.
Continúe leyendo esta serie
La guía empresarial de SCEP: Implementación de Simple Certificate Enrollment Protocol para la seguridad automatizada de WiFi en campus
Esta guía de referencia técnica proporciona un diseño arquitectónico definitivo y una estrategia de implementación paso a paso para el despliegue de certificados WiFi empresariales mediante SCEP. Cubre las diferencias críticas entre SCEP y PKCS, la secuencia exacta de despliegue necesaria para el éxito y estrategias reales de mitigación de riesgos para líderes de TI.
¿Por qué no se conecta mi WiFi de invitados? Resolución de problemas de Captive Portal
Esta guía de referencia técnica autorizada explica los mecanismos subyacentes de la detección de Captive Portal y detalla los seis modos de fallo principales que impiden que el WiFi de invitados se conecte. Proporciona a los responsables de TI y arquitectos de red un marco práctico de resolución de problemas para resolver incidencias de redirección HTTP, conflictos de DNS y desafíos de aleatorización de direcciones MAC.
Cómo implementar SCEP para el registro automatizado de certificados WiFi
Esta guía explica cómo implementar SCEP (Simple Certificate Enrollment Protocol) para el registro automatizado de certificados WiFi en entornos empresariales. Cubre el diseño arquitectónico completo, desde el diseño de PKI y la integración de MDM hasta la secuencia de despliegue obligatoria de tres pasos, y muestra a los responsables de TI y arquitectos de red cómo eliminar las credenciales compartidas, automatizar la gestión del ciclo de vida de los certificados y cumplir con los requisitos de PCI DSS y GDPR a escala.