Software de Pesquisa WiFi: Como Mapear e Otimizar Sua Rede Sem Fio
Este guia fornece a gerentes de TI e arquitetos de rede estratégias acionáveis para usar software de pesquisa WiFi para mapear, otimizar e solucionar problemas de redes sem fio corporativas. Ele aborda tipos essenciais de pesquisa, métricas RF críticas, melhores práticas de implantação e a integração de dados de pesquisa com análises de negócios.
Ouça este guia
Ver transcrição do podcast
Resumo Executivo
Para locais modernos, a rede sem fio não é mais apenas uma utilidade de TI; é a infraestrutura crítica que sustenta a satisfação do hóspede, a eficiência operacional e os fluxos de receita digital. Seja você gerenciando um hotel de 200 quartos, uma propriedade de varejo com 50 filiais ou um estádio de grande porte, depender de redes implantadas sem validação rigorosa é um risco operacional significativo.
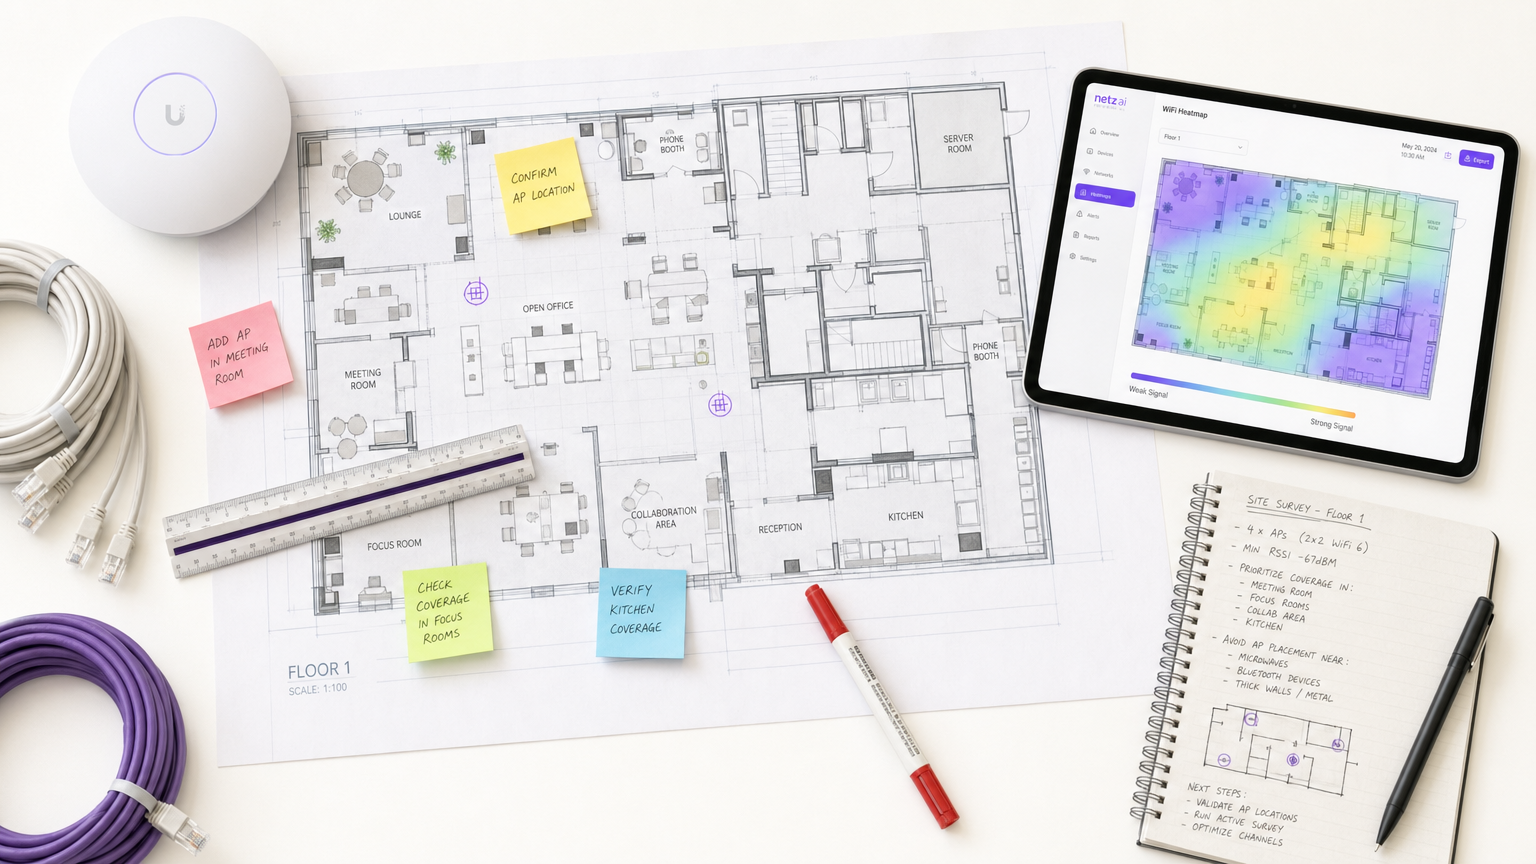
Software de pesquisa WiFi é a ferramenta essencial para mitigar esse risco. Ele permite que arquitetos de rede meçam, mapeiem e modelem o ambiente de radiofrequência (RF), traduzindo a propagação invisível do sinal em mapas de calor acionáveis. Este guia descreve os mecanismos centrais das pesquisas de site WiFi, detalha as métricas críticas necessárias para ambientes de alta densidade e fornece uma estrutura de implementação neutra em relação ao fornecedor para garantir que sua infraestrutura sem fio ofereça conectividade consistente e de alto desempenho.
Análise Técnica Detalhada
O software de pesquisa de site WiFi transforma dados RF brutos em mapas de calor visuais, permitindo engenharia de rede precisa. Compreender os distintos tipos de pesquisa e as métricas que eles capturam é fundamental para um design de rede eficaz.
Tipos de Pesquisas WiFi
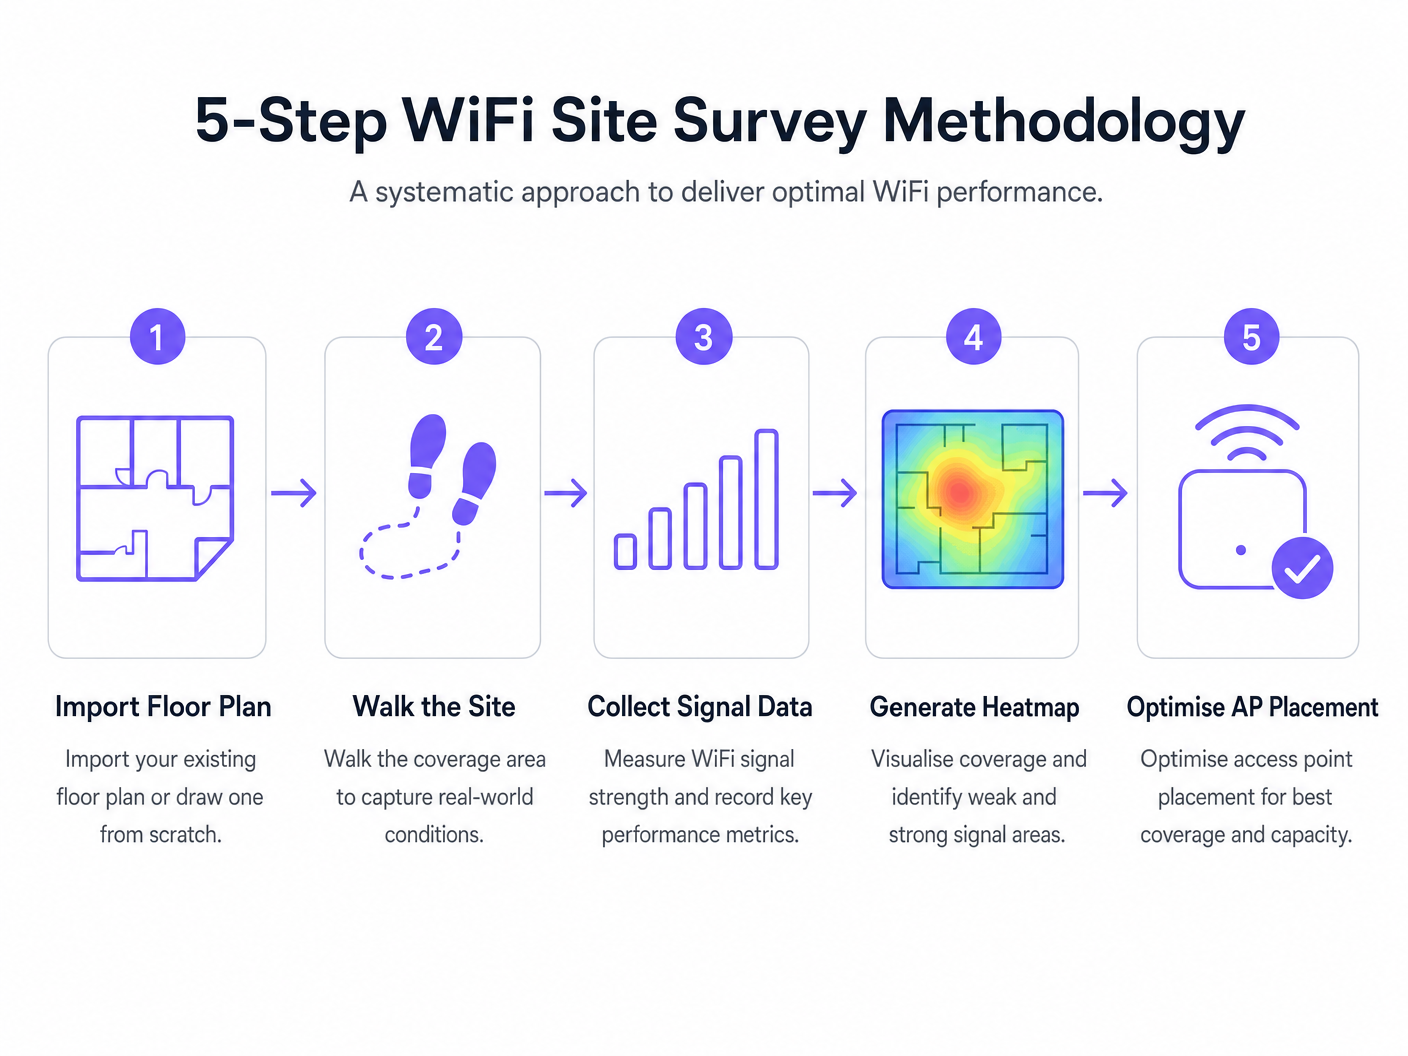
- Pesquisa Passiva: O dispositivo de pesquisa escuta o ambiente RF sem se associar a um ponto de acesso (AP). Ele captura quadros de beacon, mede o Indicador de Força do Sinal Recebido (RSSI) em todos os APs visíveis e registra dados em relação às coordenadas da planta baixa. Isso estabelece sua linha de base e identifica APs não autorizados ou interferência externa.
- Pesquisa Ativa: O dispositivo de pesquisa se conecta à rede para realizar testes de throughput do mundo real (UDP e TCP). Isso mede as taxas de dados reais, perda de pacotes e latência. Pesquisas ativas são inegociáveis para locais que suportam aplicações em tempo real, como videoconferência ou redes de sensores IoT.
- Pesquisa Preditiva (Virtual): Usando o software, os engenheiros importam uma planta baixa, definem materiais de construção (por exemplo, concreto, vidro) e atribuem valores de atenuação. O software modela a propagação RF antes que qualquer hardware seja instalado. Isso é crítico para implantações greenfield para evitar o super ou subdimensionamento.
Métricas RF Críticas
Para garantir uma implantação robusta, sua pesquisa deve avaliar as seguintes métricas:
- RSSI (Received Signal Strength Indicator): Medido em dBm. Um mínimo de -70 dBm é necessário para conectividade geral, enquanto -67 dBm ou melhor é necessário para aplicações de voz e vídeo.
- Relação Sinal-Ruído (SNR): A diferença entre o nível do sinal e o ruído de fundo. Um mínimo de 25 dB SNR é necessário para operação confiável, escalando para 30 dB+ para ambientes de alta densidade.
- Utilização do Canal: Mede o quão ocupado um canal de rádio está. Alta força de sinal com alta utilização do canal resulta em baixo throughput devido à contenção de tempo de antena.
- Comportamento de Roaming: Validação de handoffs limpos entre APs usando padrões corporativos (IEEE 802.11r/k/v). Roaming deficiente é uma causa primária de quedas de conexão em ambientes de hospitalidade e campus.
- Interferência Co-Canal (CCI): Células de cobertura sobrepostas no mesmo canal. O software de pesquisa identifica esses conflitos, permitindo ajustes de canal e potência de transmissão.
Guia de Implementação
A implantação de uma rede sem fio requer uma abordagem sistemática. A metodologia a seguir garante o posicionamento ideal do AP e o desempenho da rede.
- Pesquisa Preditiva Pré-Implantação: Sempre conduza uma pesquisa preditiva antes de adquirir hardware. Confiar em calculadoras genéricas de fornecedores muitas vezes falha em considerar sombras RF estruturais (por exemplo, pilares de concreto, poços de elevador).
- Validar com uma Pesquisa Ativa sob Carga: Um local vazio não reflete a realidade operacional. Conduza pesquisas ativas sob carga de cliente simulada ou real para medir o desempenho em cenários de alta densidade.
- Otimização Iterativa: Após a implantação inicial, use pesquisas ativas e passivas para ajustar o posicionamento do AP, as atribuições de canal e a potência de transmissão.
- Integração com Análise: Conecte seus dados de desempenho RF a plataformas de business intelligence. A sobreposição de Guest WiFi e WiFi Analytics sobre uma rede bem pesquisada permite correlacionar a qualidade do sinal com o tempo de permanência do visitante e o fluxo de pessoas.
Melhores Práticas
- Documente Tudo: Um relatório de pesquisa é um documento vivo. Qualquer modificação nas localizações dos APs, planos de canal ou potência de transmissão deve ser documentada e re-pesquisada para manter uma linha de base precisa.
- Considere a Banda de 6 GHz: À medida que as implantações se movem em direção ao WiFi 6E e WiFi 7, as metodologias de pesquisa devem considerar o espectro de 6 GHz, que oferece menor interferência, mas maior atenuação (menor alcance).
- Estabeleça uma Cadência de Pesquisa: Trate as pesquisas de site como uma prática operacional contínua. Os ambientes RF mudam devido a novos inquilinos, modificações estruturais ou mudanças sazonais de ocupação. Locais de alta densidade devem adotar uma cadência trimestral, enquanto escritórios padrão podem exigir pesquisas anuais.
Solução de Problemas e Mitigação de Riscos
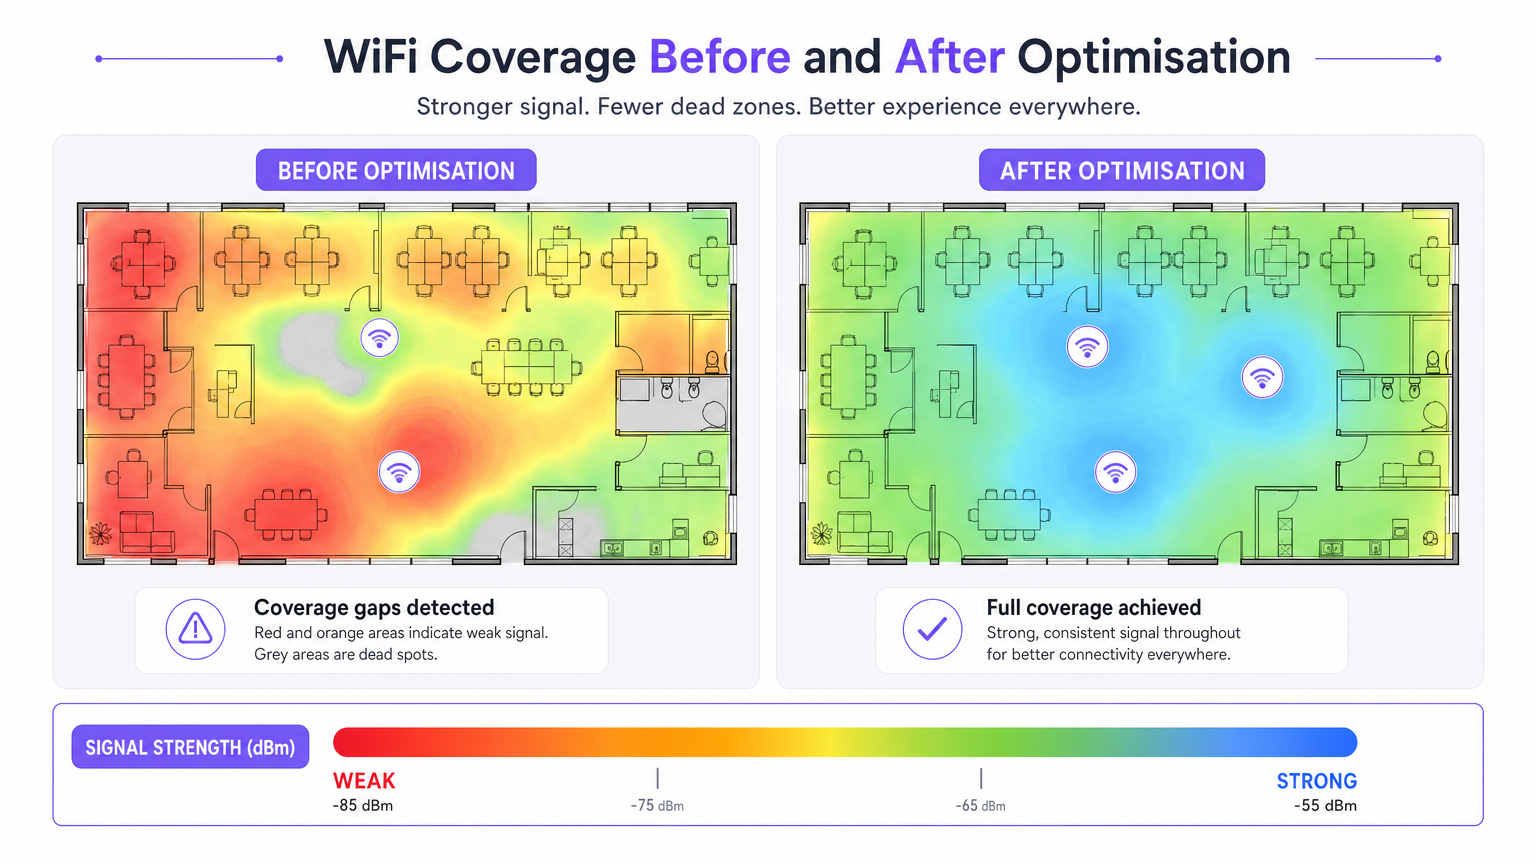
- Lacunas de Cobertura (Pontos Mortos): Frequentemente causadas por atenuação estrutural imprevista. Mitigação: Conte com pesquisas preditivas validadas por pesquisas passivas pós-implantação.
- Alta Interferência: Redes vizinhas ou dispositivos não-WiFi (por exemplo, micro-ondas, Bluetooth) elevando o ruído de fundo. Mitigação: Utilize ferramentas de análise de espectro em seu software de pesquisa para identificar e evitar canais congestionados.
- Clientes Fixos: Dispositivos que se recusam a fazer roaming para um AP mais próximo. Mitigação: Valide a configuração 802.11r/k/v e garanta que a potência de transmissão do AP não esteja muito alta, o que pode inflar artificialmente o tamanho da célula percebida.
ROI e Impacto nos Negócios
O retorno sobre o investimento para software profissional de pesquisa de WiFi é medido na mitigação de riscos e na eficiência operacional.
- Otimização de Despesas de Capital (CapEx): Pesquisas preditivas evitam o superdimensionamento custoso de APs e infraestrutura de comutação.
- Redução de Despesas Operacionais (OpEx): Uma rede devidamente pesquisada gera menos tickets de suporte e requer menos tempo para solucionar problemas.
- Habilitação de Receita: Em setores como Varejo e Hotelaria , um WiFi robusto sustenta estratégias de engajamento digital, permitindo WiFi Footfall Analytics: Como Medir e Agir sobre Dados de Visitantes precisas e campanhas de marketing direcionadas.
Definições principais
RSSI (Received Signal Strength Indicator)
A measurement of the power level being received by the client device's antenna.
Used to determine if a device is close enough to an AP to maintain a stable connection. Measured in negative decibels (dBm).
SNR (Signal-to-Noise Ratio)
The difference between the received wireless signal strength and the background RF noise.
Crucial for determining data throughput. A high SNR means a clean signal capable of supporting high data rates.
Channel Utilisation
The percentage of time a specific WiFi channel is busy transmitting data or handling interference.
High utilisation leads to network congestion and slow speeds, even if the signal strength is excellent.
Co-Channel Interference (CCI)
Interference caused when two or more APs are transmitting on the exact same channel within hearing distance of each other.
Forces APs and clients to wait their turn to transmit, severely degrading network capacity.
Attenuation
The loss of signal strength as RF waves pass through physical obstacles like walls, doors, or human bodies.
Must be accurately modelled in predictive surveys to ensure adequate coverage post-installation.
Sticky Client
A wireless device that remains connected to an AP even when a closer, stronger AP is available.
Often caused by poor roaming configuration or AP transmit power being set too high.
Predictive Survey
A software-based simulation of RF coverage using a floor plan and defined building materials, performed before hardware installation.
Used to estimate the number and placement of APs required for a new deployment.
Active Survey
A site survey where the device connects to the network to measure actual data throughput, latency, and packet loss.
Essential for validating the real-world performance of the network for the end-user.
Exemplos práticos
A 200-room hotel is experiencing frequent dropped WiFi calls when guests walk from the lobby to their rooms. The IT manager suspects a coverage issue, but the dashboard shows all APs are online.
- Conduct an active survey walking the exact path guests take from the lobby to the rooms.
- Monitor the roaming behaviour specifically looking for IEEE 802.11r (Fast BSS Transition) handoffs.
- Analyse the RSSI overlap between the lobby APs and the corridor APs.
- Adjust the transmit power of the lobby APs down slightly to encourage client devices to roam sooner, rather than 'sticking' to the lobby AP until the signal drops completely.
A large retail chain is rolling out a new inventory management system that relies on handheld scanners. They need to ensure seamless coverage across a 50,000 sq ft warehouse with high metal shelving.
- Perform a predictive survey importing the warehouse floor plan and explicitly defining the metal shelving as high-attenuation obstacles.
- Design the AP layout using directional antennas positioned down the aisles, rather than omnidirectional antennas that would bounce signals off the metal racks.
- Post-installation, conduct a passive survey to validate the coverage cell boundaries and ensure a minimum RSSI of -67 dBm in all aisles.
Questões práticas
Q1. You are reviewing a site survey report for a new corporate office. The RSSI in the main boardroom is excellent (-55 dBm), but the SNR is only 12 dB. What is the likely impact on user experience, and what should be your next troubleshooting step?
Dica: Consider the relationship between signal strength and background noise.
Ver resposta modelo
Despite the strong signal, the low SNR (12 dB) indicates a high noise floor, likely due to interference. Users will experience slow speeds, dropped packets, and poor video call quality. The next step is to use a spectrum analyser to identify the source of the interference (e.g., a neighbouring network on the same channel, or non-WiFi devices) and change the AP's channel assignment.
Q2. A stadium deployment requires APs to be mounted 15 metres high in the roof structure. Should you use omnidirectional or directional antennas, and why?
Dica: Think about how RF energy propagates from different antenna types over long distances.
Ver resposta modelo
You should use directional antennas. Omnidirectional antennas broadcast energy in all directions (like a lightbulb), which would waste signal propagating upwards and cause massive co-channel interference across the stadium seating. Directional antennas focus the RF energy downwards into specific seating sectors (like a spotlight), increasing signal strength for users and reducing interference between APs.
Q3. During a post-installation active survey in a hospital, you notice that devices are not roaming smoothly between APs in the corridors, leading to dropped VoIP calls for nurses. What specific configuration should you verify on the wireless controller?
Dica: Look for enterprise roaming standards.
Ver resposta modelo
You should verify that IEEE 802.11r (Fast BSS Transition), 802.11k (Radio Resource Measurement), and 802.11v (BSS Transition Management) are enabled and supported by the client devices. Additionally, check that the AP transmit power is not set too high, which can create artificially large coverage cells and cause 'sticky clients'.
Continue a ler esta série
Como reduzir o número de SSIDs de WiFi usando PSK por dispositivo (iPSK, DPSK, MPSK)
Este guia de referência técnica definitivo explica como as equipes de TI podem eliminar a degradação de desempenho do WiFi causada pelo overhead de beacons de SSID, colapsando múltiplas redes dedicadas em um único SSID usando PSK por dispositivo (xPSK). Ele abrange o ecossistema de fornecedores, incluindo Cisco iPSK, HPE Aruba MPSK, Ruckus DPSK, Juniper Mist PPSK e Ubiquiti UniFi PPSK, com orientações práticas de implementação sobre atribuição dinâmica de VLAN, integração de IoT e conformidade com o PCI DSS. Operadores de locais em hotelaria, varejo, estádios e organizações do setor público encontrarão orientações de arquitetura acionáveis e exemplos práticos do mundo real.
O que é uma Solicitação de Sondagem (Probe Request)? Entendendo Como os Dispositivos Descobrem Redes
Este guia de referência técnica oferece uma análise aprofundada das solicitações de sondagem IEEE 802.11, varredura ativa versus passiva e o impacto da randomização de MAC na análise de locais. Ele fornece estratégias de implementação acionáveis para arquitetos de rede otimizarem implantações de alta densidade, mitigarem tempestades de sondagem e garantirem a coleta de dados precisa e em conformidade com o GDPR usando camadas de identidade autenticadas.
Como Corrigir WiFi Lento Sem Fazer Upgrade do Seu Plano de Internet
Um guia de referência técnica abrangente para gerentes de TI e arquitetos de rede sobre como otimizar o desempenho de WiFi empresarial sem aumentar a largura de banda do ISP. Abrange ajuste de RF, gerenciamento de densidade de clientes, implementação de QoS e como aproveitar a análise de WiFi para diagnosticar e resolver gargalos.