WiFi para Passageiros: Como Operadores de Transporte Usam Dados de WiFi para Entender Jornadas
Este guia técnico explica como os operadores de transporte aproveitam a infraestrutura de WiFi para passageiros para capturar análises operacionais. Ele abrange a arquitetura técnica, as melhores práticas de implantação e as aplicações no mundo real para medir o fluxo de pessoas, o tempo de permanência e os padrões de jornada.
Ouça este guia
Ver transcrição do podcast

Resumo Executivo
Para operadores de transporte — seja gerenciando redes ferroviárias intermunicipais, frotas de ônibus urbanos ou serviços de balsa marítima — o WiFi para passageiros é frequentemente visto estritamente como um custo operacional ou uma comodidade para o passageiro. No entanto, quando integrada a uma camada de análise de nível empresarial, essa infraestrutura existente se transforma em uma poderosa ferramenta de inteligência operacional. Ao capturar metadados de conexão de dispositivos, os operadores podem mapear o fluxo de passageiros, medir os tempos de permanência em zonas de estações e rastrear padrões de jornada sem depender exclusivamente de dados de bilhetagem.
Este guia fornece a gerentes de TI, arquitetos de rede e diretores de operações uma estrutura prática para implantar e aproveitar a análise de WiFi para passageiros. Exploramos a arquitetura técnica subjacente necessária para capturar sinais de dispositivos com segurança, os casos de uso operacionais que entregam ROI mensurável e os requisitos de conformidade necessários para processar esses dados dentro dos frameworks de GDPR e proteção de dados.
Ouça o briefing do nosso consultor sênior sobre este tópico:
Análise Técnica Aprofundada: Arquitetura e Fluxo de Dados
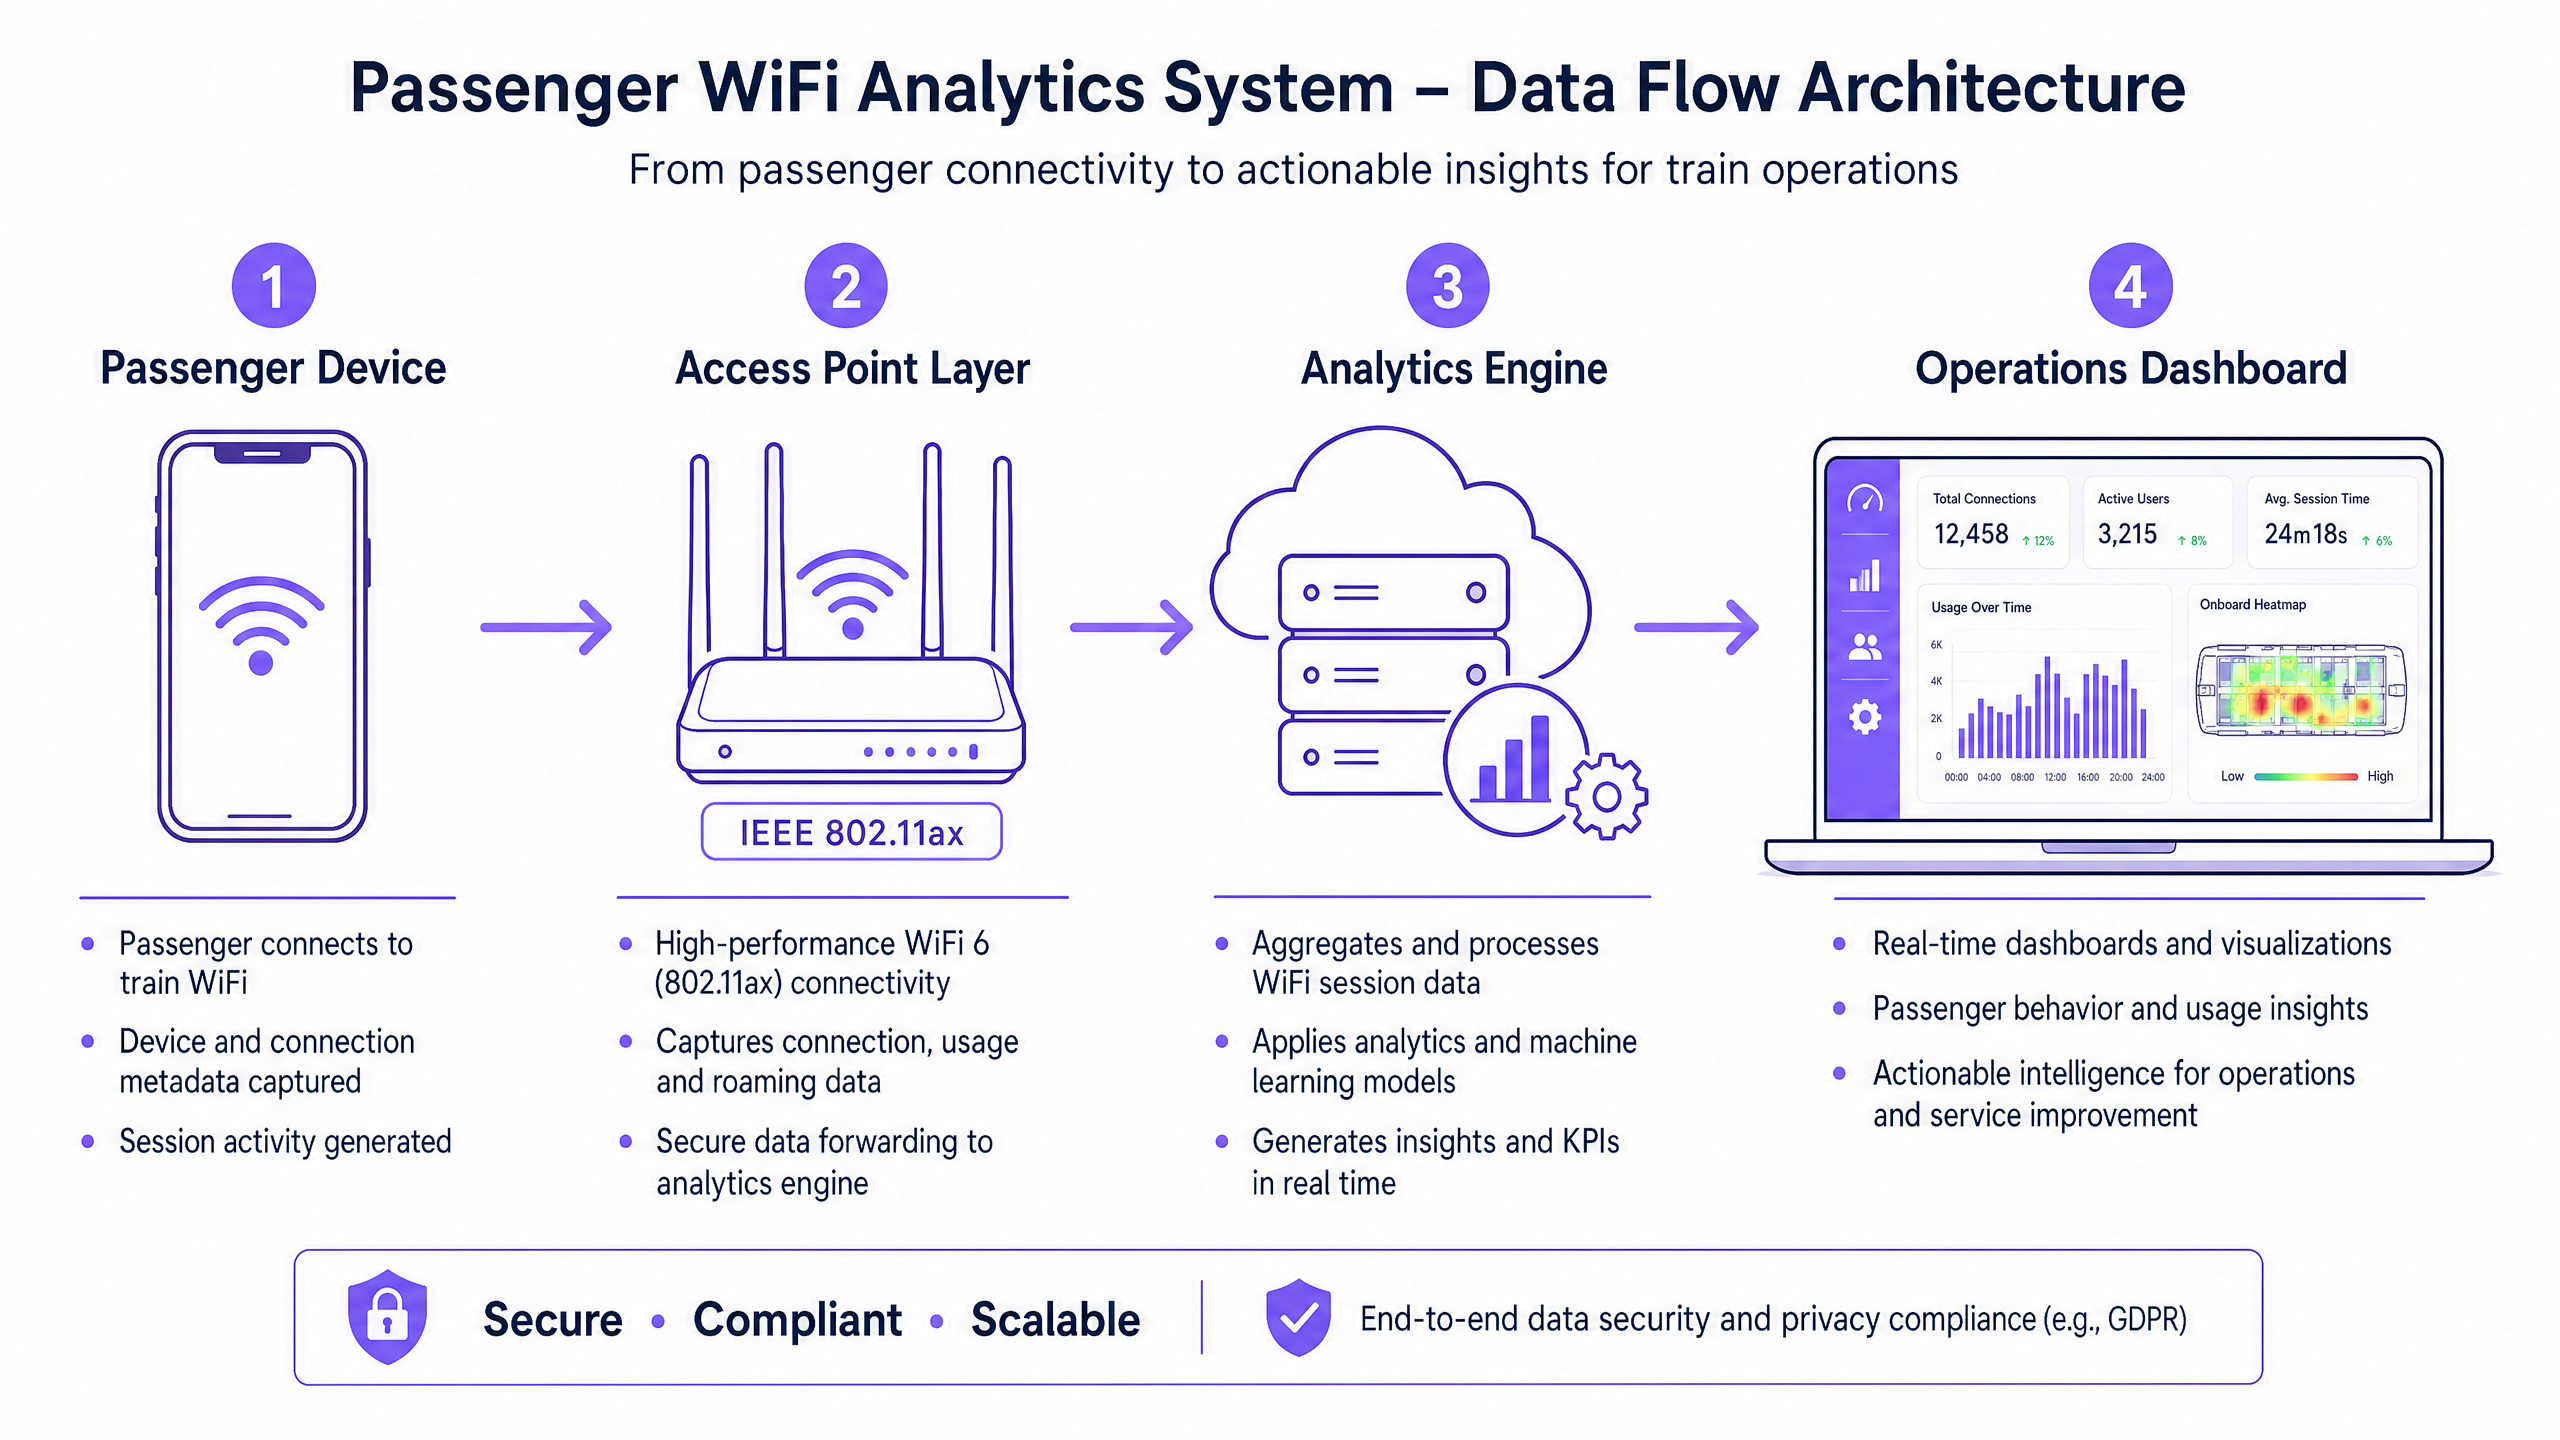
A base de qualquer capacidade de análise de WiFi para passageiros é a capacidade da rede de capturar e processar metadados de dispositivos com segurança. A arquitetura geralmente consiste em quatro camadas principais:
- Camada de Ponto de Acesso (Edge): Hardware físico implantado em estações e material rodante. Implantações modernas que utilizam IEEE 802.11ax (WiFi 6) fornecem suporte a clientes de alta densidade e capturam metadados essenciais, incluindo endereços MAC, intensidade do sinal (RSSI) e carimbos de data/hora de conexão.
- Camada de Coleta de Dados (Controlador): Um controlador centralizado gerenciado na nuvem agrega logs de sessão brutos e transferências de roaming da camada de ponto de acesso.
- Mecanismo de Análise: Plataformas como a camada de Análise de WiFi da Purple processam os logs brutos, aplicando modelos de aprendizado de máquina para filtrar dispositivos de funcionários e sinais transientes, transformando dados brutos em métricas significativas (por exemplo, tempo de permanência, fluxo de pessoas).
- Painel de Operações: A camada de visualização onde planejadores de rede e gerentes de estação consomem insights por meio de painéis em tempo real e mapas de calor.
Superando a Randomização de MAC
Um desafio técnico crítico na análise de WiFi moderna é a randomização de endereços MAC. Desde o iOS 14 e Android 10, os dispositivos randomizam seus endereços MAC por rede para aumentar a privacidade. Embora isso não afete as métricas agregadas de fluxo de pessoas ou tempo de permanência (já que a sessão permanece consistente durante uma única visita), limita a capacidade de rastrear visitantes recorrentes anonimamente ao longo do tempo.
A solução arquitetônica é o WiFi para Convidados autenticado. Ao direcionar os usuários através de um Captive Portal que requer autenticação (por exemplo, e-mail ou login social), o sistema cria um perfil de usuário persistente e consentido. Este perfil ancora os dados da sessão a um usuário conhecido, contornando as limitações da randomização de MAC enquanto mantém estrita conformidade com as regulamentações de proteção de dados.
Guia de Implementação: Da Infraestrutura aos Insights
A implantação de análises de WiFi para passageiros requer uma abordagem estruturada para garantir a precisão dos dados e a segurança da rede.
- Realize Auditorias Abrangentes de RF: A precisão da análise depende inteiramente da cobertura da rede. Zonas mortas em saguões de estações ou plataformas resultam em sessões perdidas e dados de jornada fragmentados. Realize levantamentos de RF completos no local para garantir cobertura contígua em todas as zonas de passageiros.
- Padronize a Integração de Dados: Redes de transporte frequentemente apresentam hardware heterogêneo (por exemplo, Cisco Meraki em estações, diferentes fornecedores em material rodante). Implemente uma camada de API agnóstica a fornecedores para normalizar os logs de sessão antes que cheguem ao mecanismo de análise.
- Implemente Controles de Segurança Robustos: Redes voltadas para passageiros são superfícies de ataque de alto risco. Imponha WPA3 onde a compatibilidade do cliente permitir, implemente isolamento estrito do cliente (isolamento de Camada 2) para prevenir movimento lateral entre dispositivos de passageiros e implante filtragem de DNS para bloquear domínios maliciosos. Para mais informações sobre como proteger esses ambientes, revise nosso guia Proteja Sua Rede com DNS e Segurança Fortes .
- Defina a Arquitetura Zonal: Segmente suas localizações físicas em zonas lógicas (por exemplo, saguão, área de varejo, plataforma). Isso permite uma análise granular do tempo de permanência, permitindo que os operadores diferenciem entre um passageiro navegando em uma zona de varejo e um esperando em uma plataforma durante um atraso no serviço.
Melhores Práticas e Casos de Uso Operacionais
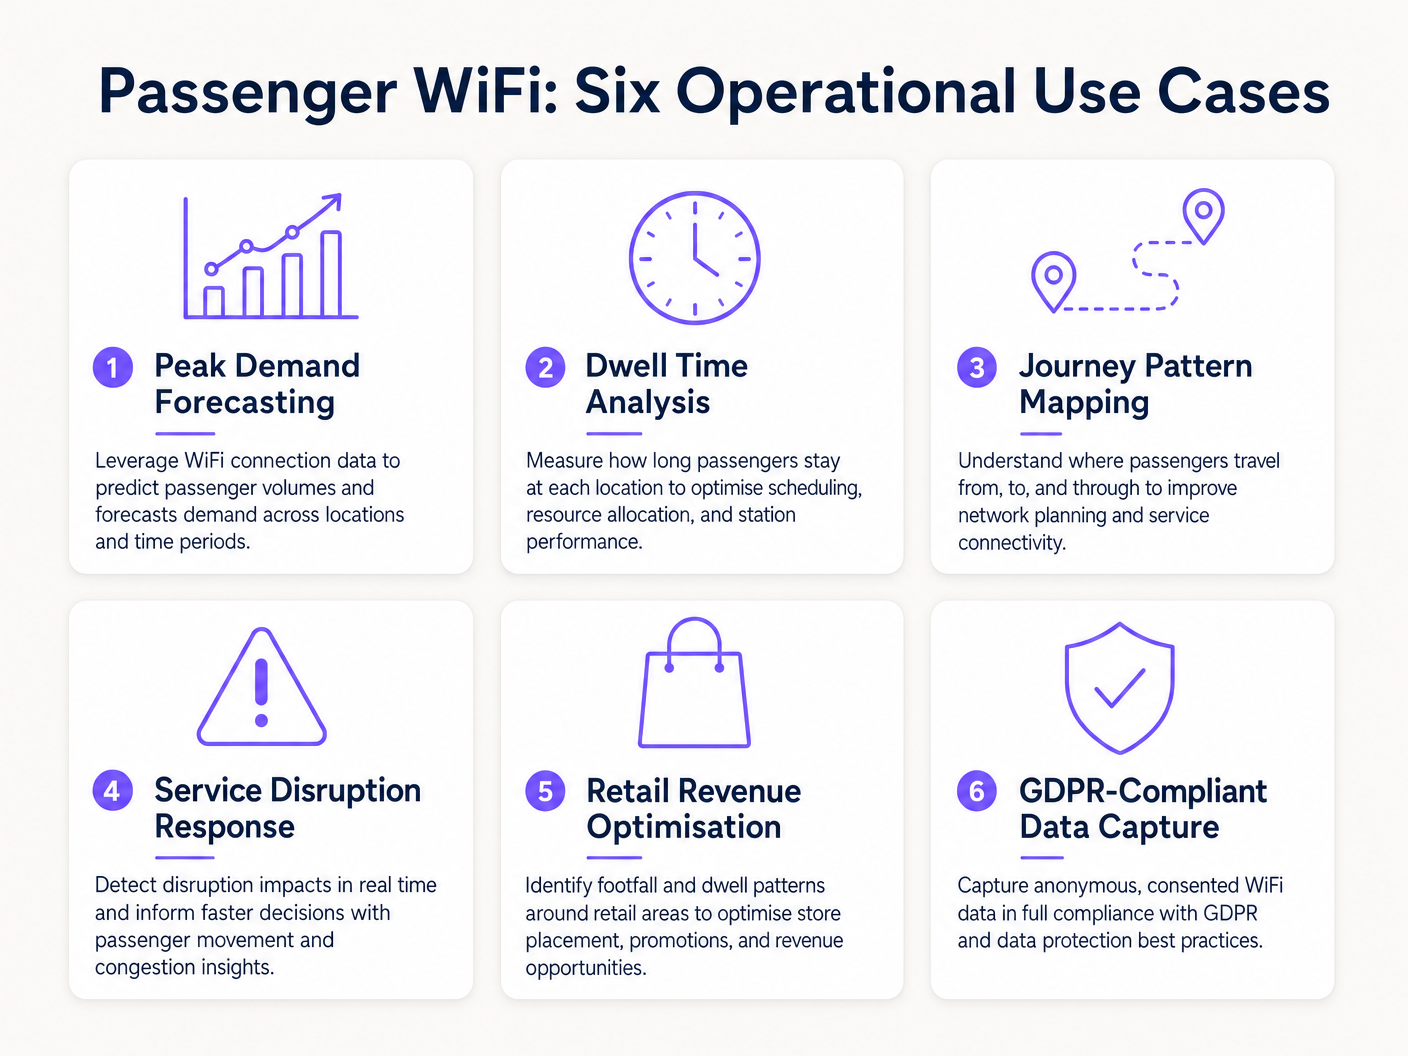
Operadores de transporte estão aproveitando a análise de WiFi para impulsionar a eficiência em múltiplos domínios operacionais. Assim como locais em Varejo e Hotelaria usam dados de fluxo de pessoas para otimizar a equipe, operadores de transporte usam esses insights para gerenciar a demanda de pico.
Estudo de Caso Real: Rede Ferroviária Intermunicipal
Um grande operador ferroviário intermunicipal do Reino Unido implantou análises de WiFi em doze estações terminais para resolver o congestionamento de plataformas. Ao correlacionar picos de conexão WiFi com horários de partida de trens, a equipe de operações identificou que plataformas específicas experimentavam aglomeração perigosa 40 minutos antes da partidare. Os dados revelaram que os passageiros estavam chegando mais cedo do que o previsto devido à sinalização digital pouco clara no saguão principal. Ao ajustar o tempo dos anúncios de plataforma nos painéis de partida, o operador suavizou o fluxo de passageiros, reduzindo a densidade de pico da plataforma em 22% e melhorando a segurança geral.
Estudo de Caso Real: Operações de Terminal de Balsa
Um operador regional de balsas que gerencia alto volume de tráfego de verão utilizou a análise de tempo de permanência do WiFi para otimizar sua estratégia de varejo no terminal. O painel de análise destacou que os passageiros esperando por travessias atrasadas tinham um tempo médio de permanência de 45 minutos no terminal, mas apenas 12% entravam na zona de varejo secundária. Ao reposicionar a sinalização digital e acionar notificações push automatizadas via captive portal oferecendo um desconto de café durante atrasos, o operador aumentou a conversão de varejo em 18% durante eventos de interrupção.
Solução de Problemas e Mitigação de Riscos
Ao implementar a análise de WiFi de passageiros, as equipes de TI devem mitigar vários modos de falha comuns:
- Diluição de Dados de Dispositivos de Funcionários: A falha em filtrar dispositivos de funcionários (por exemplo, equipes de limpeza, funcionários de varejo) distorce significativamente as métricas de tempo de permanência. Implemente filtragem rigorosa de endereços MAC ou SSIDs dedicados para funcionários para garantir que os dados dos passageiros permaneçam limpos.
- Falhas de Conformidade: A captura de dados de dispositivos sem consentimento explícito ou uma base legal documentada viola o GDPR. Garanta que seu captive portal articule claramente a política de processamento de dados e capture o consentimento explícito quando necessário.
- Gargalos de Backhaul: Sistemas a bordo que dependem de backhaul celular (LTE/5G) frequentemente sofrem de restrições de largura de banda. Garanta que sua arquitetura armazene dados de análise localmente durante quedas de conectividade e sincronize assincronamente para evitar perda de dados sem impactar as velocidades de navegação dos passageiros.
ROI e Impacto nos Negócios
O retorno sobre o investimento para a análise de WiFi de passageiros se estende muito além do departamento de TI. Ao tratar a rede como um ativo de inteligência, os operadores podem:
- Otimizar a Alocação de Recursos: Alinhar a equipe da estação, os horários de limpeza e as patrulhas de segurança com dados empíricos de fluxo de pessoas, em vez de horários estáticos.
- Aumentar a Receita de Varejo: Fornecer aos locatários de varejo métricas precisas de fluxo de pessoas e conversão, justificando taxas de aluguel premium em zonas de alto tráfego.
- Melhorar a Experiência do Passageiro: Identificar pontos de atrito na jornada da estação e gerenciar proativamente o congestionamento, muito parecido com a forma como o setor de Healthcare usa tecnologia semelhante para entender o fluxo de pacientes. Para contexto sobre aplicações intersetoriais, veja How WiFi Can Improve Patient Experience in Hospitals .
Ao integrar a análise de WiFi na estratégia operacional central, os operadores de transporte no setor de Transport podem fazer a transição de uma gestão reativa para uma entrega de serviço proativa e orientada por dados.
Definições principais
MAC Address Randomisation
A privacy feature in modern operating systems (iOS, Android) that generates a temporary, random MAC address for each WiFi network the device connects to.
IT teams must account for this as it prevents the tracking of repeat visitors using only hardware identifiers, necessitating captive portal authentication.
Dwell Time
The total duration a device remains connected or visible to the WiFi network within a specific physical zone.
Used by operations directors to measure how long passengers wait on platforms or spend in retail areas, directly impacting commercial and safety planning.
Captive Portal
A web page that users must view and interact with before being granted access to a public WiFi network.
The primary mechanism for capturing user consent, enforcing terms of service, and collecting first-party marketing data.
IEEE 802.11ax (WiFi 6)
The current standard for wireless networks, designed to improve performance in high-density environments.
Essential for transport hubs like stadiums and train stations where thousands of devices attempt to connect simultaneously.
RSSI (Received Signal Strength Indicator)
A measurement of the power present in a received radio signal.
Analytics engines use RSSI values from multiple access points to triangulate a device's physical location within a venue.
Client Isolation
A security feature that prevents devices connected to the same WiFi network from communicating directly with each other.
Critical for public passenger WiFi to prevent malicious actors from scanning or attacking other users' devices on the network.
Footfall
The total number of unique devices detected by the WiFi network within a specific timeframe.
Provides station managers with an accurate proxy for total passenger volume, independent of ticket sales.
Cellular Backhaul
The use of cellular networks (LTE/5G) to connect a local WiFi network (like on a bus or train) back to the internet.
The primary ongoing operational cost (OPEX) for onboard WiFi deployments, requiring careful bandwidth management.
Exemplos práticos
A major train station operator is experiencing severe congestion on Platform 4 during the evening peak. They need to understand where these passengers are originating from within the station (e.g., main concourse vs. retail zone) to improve flow.
- Deploy high-density IEEE 802.11ax access points across the concourse, retail zones, and Platform 4 to ensure contiguous coverage.
- Configure the analytics platform to define logical 'Zones' for each area.
- Analyse the 'Zone-to-Zone Transition' reports in the analytics dashboard during the 16:00-19:00 window.
- Identify the primary origin zones for devices arriving at Platform 4.
- If the data shows a bottleneck originating from the retail zone corridor, operations can deploy staff to redirect flow or update digital signage to route passengers through a secondary concourse entrance.
A regional bus operator wants to offer free onboard WiFi but needs to justify the cellular backhaul costs to the commercial director by capturing marketing data.
- Implement a cloud-managed captive portal for the onboard WiFi network.
- Configure the portal to require authentication via email or social login (e.g., Facebook, Google).
- Ensure the portal includes a clear, GDPR-compliant privacy notice and opt-in checkboxes for marketing communications.
- Integrate the captive portal data capture directly with the operator's CRM or email marketing platform via API.
- Track the volume of new marketing opt-ins generated per route and calculate the equivalent cost-per-acquisition (CPA) to justify the backhaul OPEX.
Questões práticas
Q1. Your ferry terminal has deployed WiFi analytics, but the average dwell time in the main waiting lounge is reporting as 8.5 hours, which is impossible given your sailing schedule. What is the most likely cause and how do you fix it?
Dica: Consider what other devices might be permanently located in or near the waiting lounge.
Ver resposta modelo
The analytics engine is likely capturing static devices (e.g., smart TVs, digital signage, point-of-sale systems) or staff devices that remain in the lounge all day. The solution is to identify the MAC addresses of these known devices and configure the analytics platform to filter them out of the dataset.
Q2. A bus operator wants to track how many passengers travel the full length of a specific route versus hopping off early. They are relying purely on anonymous MAC address tracking from the onboard access point. Why might this data be inaccurate?
Dica: Think about how modern smartphones handle network connections to protect privacy.
Ver resposta modelo
Modern smartphones use MAC address randomisation. While connected to the bus WiFi, the session is tracked accurately. However, if a device disconnects (e.g., goes to sleep) and reconnects later on the route, it may present a new MAC address, making it appear as a new passenger rather than a continuing journey. Implementing a captive portal for authentication is required to track persistent journeys accurately.
Q3. You are deploying WiFi across a large train station with a high-density concourse. To ensure secure data capture and protect passengers, what two critical network security configurations must be enabled on the public SSID?
Dica: One prevents devices from talking to each other; the other prevents access to malicious sites.
Ver resposta modelo
- Client Isolation (Layer 2 isolation) must be enabled to prevent passenger devices from communicating with or attacking each other on the local network. 2. DNS Filtering should be deployed to block access to known malicious domains, phishing sites, and inappropriate content.
Continue a ler esta série
Privacidade desde a Concepção: Anonimizando Dados WiFi para Conformidade com a GDPR
Este guia autorizado detalha a arquitetura técnica e as estratégias de implementação para anonimizar dados WiFi, garantindo a conformidade com a GDPR. Ele fornece a líderes de TI e arquitetos de rede estruturas acionáveis para equilibrar análises robustas de locais com requisitos rigorosos de privacidade de dados.
Heatmapping vs Presence Analytics: Diferenças Técnicas
Este guia técnico e autoritário detalha as diferenças arquitetônicas e operacionais críticas entre WiFi heatmapping e presence analytics para operadores de locais empresariais. Ele fornece a líderes de TI, arquitetos de rede e diretores de operações estruturas de implantação acionáveis, cenários de implementação reais e melhores práticas neutras em relação a fornecedores para extrair o ROI máximo de sua infraestrutura sem fio existente.
Como Calcular o Tempo de Permanência Usando Análise de Localização WiFi
Este guia oferece uma referência técnica abrangente para calcular o tempo de permanência WiFi usando análise de localização WiFi, cobrindo a arquitetura completa, desde a captura de solicitações de sondagem 802.11, passando pela trilateração baseada em RSSI, até a análise de zonas geocercadas. Ele é projetado para gerentes de TI, arquitetos de rede e diretores de operações de locais que precisam implantar inteligência de localização precisa e escalável em ambientes de varejo, hotelaria, saúde e setor público. Os leitores obterão orientação de implementação acionável, estudos de caso reais e uma estrutura clara para traduzir dados espaciais brutos em resultados de negócios mensuráveis.