Tempo médio até à inocência: como provar que o problema não é do WiFi
O tempo médio até à inocência (MTTI) é a métrica crítica que define o tempo que as equipas de TI passam a provar que um problema de rede não é culpa delas. Este guia detalha uma metodologia de observabilidade em cinco passos para eliminar o jogo das culpas em ambientes multi-tenant, substituindo as acusações por provas partilhadas para reduzir o tempo médio de resolução (MTTR).
Ouça este guia
Ver transcrição do podcast
📚 Parte da nossa série principal: Multi-Tenant WiFi Guide →
Executive Summary
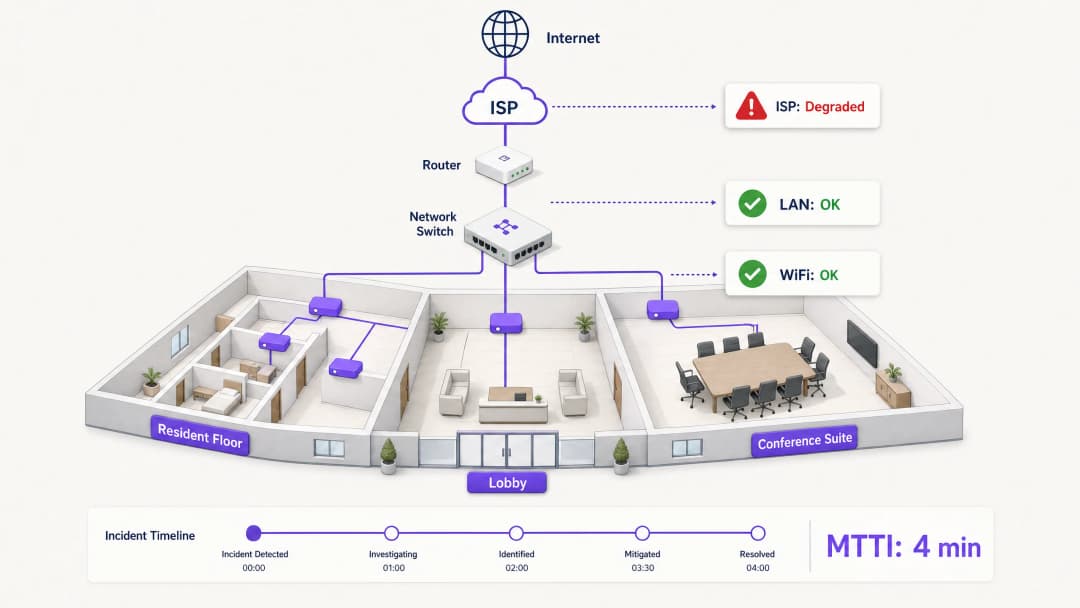
When connectivity drops in a multi-tenant environment, the WiFi gets blamed first. It is the visible edge of the network, the last hop before the device, and the easiest target for frustrated users. For IT managers, network architects, and venue operations directors, this creates a persistent operational tax: the time spent proving innocence.
Mean time to innocence (MTTI) measures the average elapsed time between an incident being reported and a team's ability to demonstrate that their domain is not the root cause. In complex environments like build-to-rent (BTR) blocks, hotels, or conference centres, the network is fragmented across property managers, managed WiFi providers, and internet service providers (ISPs). Without definitive telemetry, MTTI inflates mean time to resolution (MTTR) as teams argue over responsibility rather than fixing the fault.
This guide details a five-step observability methodology to systematically reduce MTTI. By deploying continuous synthetic checks, hop-by-hop path visibility, flow data analysis, topology mapping, and event correlation, you can replace adversarial finger-pointing with shared evidence. The goal is not to win the blame game faster, but to end it entirely.
Technical Deep-Dive: The Mechanics of MTTI
The Distinction Between MTTI and Mean Time to Identify
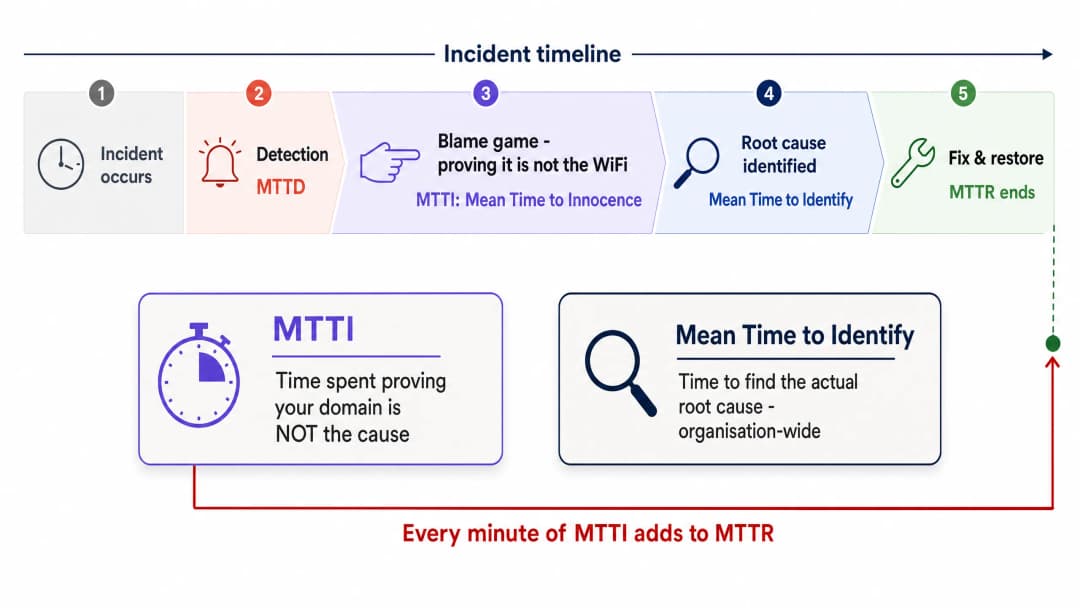
It is vital to separate MTTI from mean time to identify. Mean time to identify is an organisation-wide metric tracking how long it takes to find the actual root cause of an outage. MTTI is a siloed, domain-specific metric tracking how long it takes one team to prove they are not the culprit.
Every minute of MTTI adds directly to MTTR. If a managed WiFi provider spends 40 minutes manually checking access points (APs) and switch logs before concluding the issue lies with the ISP, the MTTR has a 40-minute penalty built in before the actual remediation even begins.
Why the WiFi Takes the Blame
In environments serving 350 million unique users across 80,000+ live venues, Purple sees the same pattern repeatedly. The WiFi layer is blamed by default due to three structural realities:
- Visibility bias: The WiFi signal indicator is the only network diagnostic tool available to the average venue user.
- Edge proximity: As the final hop to the client device, WiFi inherits the symptoms of every upstream failure. A DNS timeout at the ISP looks identical to an AP failure from the user's perspective.
- Telemetry gaps: Historically, proving wireless health required manual intervention. If you cannot show a clean bill of health for the wireless layer in under two minutes, you lose the narrative.
The Multi-Tenant Complication
In a single-tenant enterprise, network teams own the stack from the AP to the firewall. In Multi-Tenant WiFi environments, ownership is fractured.
A BTR resident pays the property manager. The property manager contracts a managed WiFi provider. The managed WiFi provider relies on a third-party ISP circuit and, often, the landlord's in-building distribution network. When a resident cannot stream video, the provider must rapidly exonerate the WiFi hardware (Cisco Meraki, HPE Aruba, Ruckus, or Juniper Mist) and isolate the fault to the client device, the building switch, or the ISP. Failure to do so damages the commercial relationship between the provider and the property manager.
Implementation Guide: The 5-Step Methodology
To systematically reduce MTTI, implement this five-layer observability architecture.
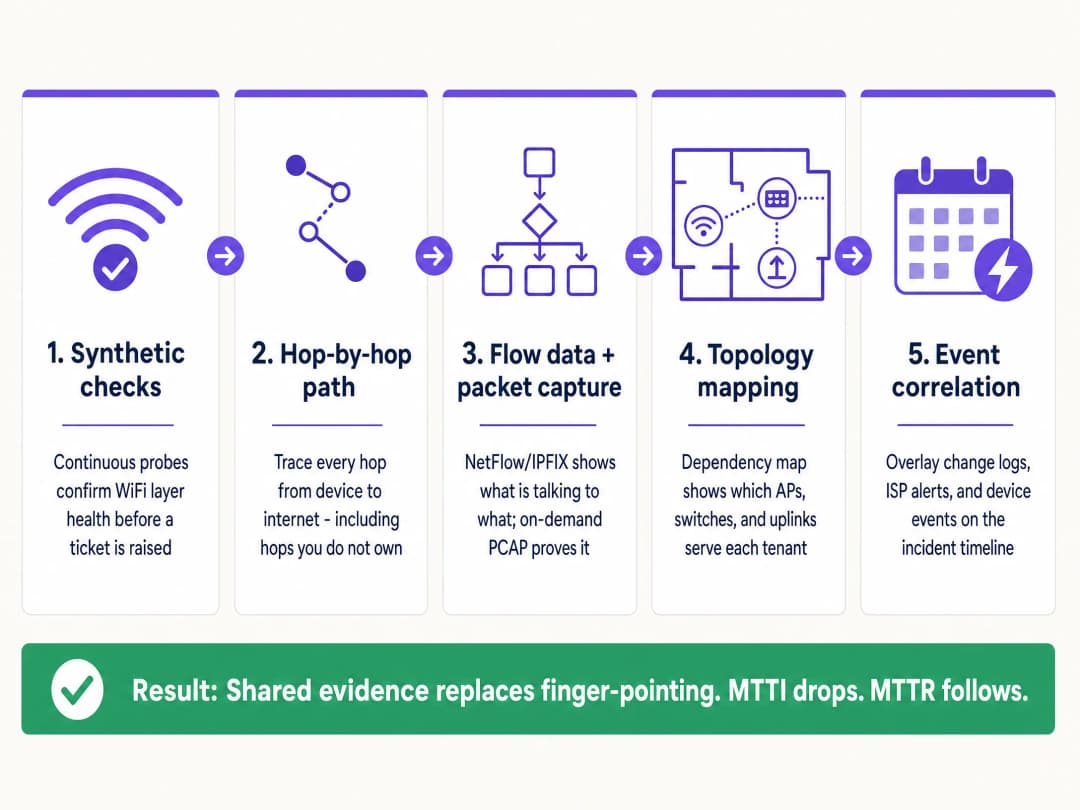
1. Continuous Synthetic Checks
Do not wait for a user to complain. Deploy automated synthetic probes that continuously emulate user behaviour from the network edge.
- Implementation: Configure APs or dedicated sensors to run scheduled tests for DHCP response, DNS resolution, HTTP reachability, and authentication flows (such as 802.1X or Captive Portal logins).
- Outcome: When a ticket is raised, you check the synthetic dashboard first. If the probes show clean HTTP reachability at the exact time of the complaint, you immediately exonerate the WiFi layer and the WAN circuit, shifting focus to the specific client device or the target application.
2. Hop-by-Hop Path Visibility
Proving your hardware is healthy is insufficient if you cannot prove the path to the internet is clear.
- Implementation: Use path visualisation tools to trace traffic from the access layer across the LAN, through the demarcation point, and into the ISP network.
- Outcome: When latency spikes, a path trace reveals exactly which node introduced the delay. If hops one through four (your domain) show 2ms latency, and hop five (the ISP edge router) shows 150ms latency and 12% packet loss, you have definitive proof to hand to the ISP.
3. Flow Data and On-Demand Packet Capture
When users report application-specific failures, you need conversation-level visibility.
- Implementation: Export NetFlow or IPFIX data from your core switches or firewalls. Ensure your access layer hardware supports remote, on-demand packet capture (PCAP) without requiring an engineer on site.
- Outcome: Flow data proves whether traffic to a specific service is leaving your network cleanly. If it is, the network is innocent. If deeper forensic proof is required, a targeted PCAP on the specific VLAN provides undeniable evidence of TCP retransmissions or server-side resets.
4. Topology and Dependency Mapping
In a multi-tenant environment, isolating the blast radius is the fastest way to categorise a fault.
- Implementation: Maintain a live, dynamically updated dependency map linking every AP to its switch, uplink, and WAN circuit, mapped against tenant VLANs.
- Outcome: If a fault affects APs across multiple floors but only on a single switch, the issue is the switch. If it affects all APs but only one tenant's VLAN, it is a logical configuration issue. Rapid scoping prevents wasted effort investigating healthy infrastructure.
5. Event Correlation
Data without context prolongs investigations.
- Implementation: Feed change logs, ISP maintenance alerts, hardware firmware updates, and user tickets into a single timeline view.
- Outcome: Overlaying a spike in authentication failures with a Microsoft Entra ID certificate expiration event that occurred 10 minutes prior immediately identifies the root cause, bypassing the network hardware entirely.
Best Practices
- Standardise the Hardware Stack: Limit deployments to canonical enterprise vendors (Cisco Meraki, HPE Aruba, Ruckus, Juniper Mist, Ubiquiti UniFi, Cambium, Extreme, Fortinet) that expose APIs for synthetic testing and remote PCAP.
- Automate the Evidence: Configure your monitoring platform to automatically attach synthetic test results and path traces to ITSM tickets the moment they are created.
- Share the Dashboard: Provide property managers with read-only access to a high-level health dashboard. Transparency preempts the blame game.
- Track MTTI Formally: Measure the time between ticket creation and the moment your team provides evidence of innocence. Treat it as a primary KPI alongside MTTR.
Troubleshooting & Risk Mitigation
- Risk: The 'No Fault Found' Loop: Users report issues, but synthetic checks show green.
- Mitigation: The issue is likely device-specific or related to RF interference (co-channel interference or physical obstruction). Use client-side analytics to check the specific device's RSSI and roaming history.
- Risk: ISP Denial: The ISP refuses to accept the fault despite your evidence.
- Mitigation: Provide hop-by-hop path traces showing the exact IP address where packet loss begins. Share PCAPs demonstrating clean egress from your demarcation point. Hard data forces escalation past Level 1 support.
- Risk: Captive Portal Failures: Users blame the WiFi when the portal fails to load.
- Mitigation: Isolate the identity provider. Check the status of the integration (Microsoft Entra ID, Okta, Google Workspace). If the network allows pre-authentication traffic but the IdP times out, the network is innocent.
ROI & Business Impact
Reducing MTTI delivers measurable business value beyond simply saving engineering hours.
- Reduced MTTR: Stripping 40 minutes of finger-pointing from an incident directly reduces downtime, protecting revenue in retail and hospitality environments.
- SLA Compliance: Faster exoneration prevents unfair penalties being levied against the managed WiFi provider when the fault lies with the ISP or the building infrastructure.
- Client Retention: In the Multi-Tenant WiFi sector, property managers renew contracts with providers who offer transparency and rapid answers. Shared evidence builds trust; defensive arguments destroy it.
- Resource Optimisation: Highly paid Level 3 network engineers spend their time engineering solutions, rather than manually proving the network is functioning correctly.
Definições Principais
Mean Time to Innocence (MTTI)
O tempo médio necessário para que uma equipa de TI específica prove, através de dados objetivos, que o seu domínio ou infraestrutura não é a causa raiz de um incidente relatado.
Crítico para os fornecedores de WiFi gerido que devem defender o seu serviço contra gestores de propriedades e ISPs.
Mean Time to Identify
A métrica ao nível da organização que rastreia o tempo total decorrido desde a deteção do incidente até à descoberta da verdadeira causa raiz.
O MTTI é um subconjunto desta métrica. Reduzir o MTTI reduz diretamente o tempo total de identificação.
Synthetic Checks
Testes automatizados e contínuos que emulam o tráfego do utilizador (por exemplo, consultas de DNS, pedidos HTTP) para monitorizar proativamente a integridade da rede.
Utilizados para provar que a camada de WiFi estava a funcionar corretamente no momento exato em que um utilizador se queixou.
Hop-by-Hop Path Visibility
Telemetria que rastreia o tráfego de rede nó a nó, do cliente ao destino, medindo a latência e a perda em cada router ou comutador específico.
Essencial para provar que uma falha reside na rede de um ISP ou no comutador de distribuição de um senhorio, em vez de no hardware de WiFi gerido.
Flow Data (NetFlow/IPFIX)
Dados de protocolo de rede que fornecem um resumo das conversações de tráfego, mostrando a origem, o destino, o protocolo e o volume.
Utilizado para provar que o tráfego de aplicações específicas está a sair com sucesso da rede local.
On-Demand Packet Capture (PCAP)
A capacidade de gravar remotamente o tráfego de rede em bruto a partir de um ponto de acesso ou comutador para análise forense.
A prova definitiva utilizada para demonstrar erros do lado do servidor ou comportamento incorreto do dispositivo cliente.
Blast Radius
O âmbito do impacto de um incidente específico (por exemplo, um utilizador, um AP, um comutador, um inquilino ou todo o edifício).
Determinar o blast radius através do mapeamento de topologia é a forma mais rápida de excluir a infraestrutura saudável de uma investigação.
Event Correlation
A prática de sobrepor diferentes fluxos de dados (registos, alertas, atualizações) numa única linha temporal para identificar causa e efeito.
Utilizada para provar que uma interrupção de rede foi causada por uma alteração de terceiros, como uma janela de manutenção não anunciada de um ISP.
Exemplos Práticos
Um hotel de 350 quartos reporta que o WiFi nos quartos está lento em toda a propriedade. A receção culpa o fornecedor de WiFi gerido. Como exonerar a rede e encontrar a causa raiz?
- Verificar as sondas sintéticas: os testes de acessibilidade de DNS e HTTP mostram que os APs têm uma ligação limpa à internet. 2. Rever o mapa de topologia: o problema afeta todos os APs em todos os switches, excluindo o hardware periférico. 3. Executar um rastreio de rota (path trace): o rastreio mostra uma latência de 2ms dentro da LAN do hotel, mas de 180ms no terceiro salto (o router de agregação do ISP). 4. Exportar a prova: enviar a captura de ecrã do rastreio de rota para o gerente do hotel e para o ISP.
Um retalhista nacional reporta que os terminais de ponto de venda (POS) numa região estão a perder ligação ao processador de pagamentos. A equipa de rede é culpada por uma configuração incorreta de firewall ou de encaminhamento.
- Isolar o raio de impacto: confirmar que apenas os terminais POS (VLAN específica) são afetados; o WiFi de convidados e os sistemas administrativos estão operacionais. 2. Analisar dados de fluxo: o NetFlow confirma que o tráfego destinado à gama de IPs do processador de pagamentos está a sair com sucesso dos routers das lojas. 3. Capturar pacotes: uma PCAP a pedido na VLAN dos POS revela que o servidor do processador de pagamentos está a enviar resets TCP (RST). 4. Partilhar a PCAP com a equipa de suporte do processador de pagamentos.
Perguntas de Prática
Q1. Um inquilino num espaço de coworking queixa-se de que não consegue aceder à sua VPN corporativa. Outros inquilinos estão a navegar na internet sem qualquer problema. Qual é a forma mais eficiente de provar que a rede WiFi não tem culpa?
Dica: Considere o raio de impacto (blast radius) e o tipo específico de tráfego que está a falhar.
Ver resposta modelo
Primeiro, utilize o mapa de topologia para confirmar que o raio de impacto está limitado a um utilizador ou a um serviço específico, descartando uma falha geral de AP ou de switch. Segundo, analise os dados de fluxo (NetFlow/IPFIX) para o endereço IP desse cliente. Se os dados de fluxo mostrarem que o tráfego de VPN (ex.: UDP 500 ou TCP 443) está a sair da rede de forma limpa, o WiFi e a LAN estão inocentes. O problema deve-se à configuração de VPN do cliente ou ao firewall corporativo que está a bloquear a ligação.
Q2. O seu painel de monitorização mostra que um AP ficou offline, mas o gestor do imóvel insiste que o WiFi está avariado porque o ISP foi abaixo. Como prova que o problema é de energia interna e não do ISP?
Dica: Procure uma correlação entre o estado da infraestrutura e os eventos externos.
Ver resposta modelo
Utilize a correlação de eventos e o mapeamento de topologia. Se o mapa de topologia mostrar que apenas um AP está offline enquanto outros no mesmo switch estão a funcionar, o circuito do ISP está claramente ativo. A correlação de eventos poderá mostrar um registo de falha de PoE (Power over Ethernet) na porta do switch ligada a esse AP específico. Isto prova que o problema é de hardware local ou cablagem, e não do circuito WAN.
Q3. Um diretor de operações de um estádio afirma que o WiFi falhou durante o intervalo porque os leitores de bilhetes deixaram de funcionar. Precisa de ilibar a rede em menos de dois minutos. Que telemetria utiliza?
Dica: Precisa de uma prova histórica de integridade no momento exato em que a falha foi reportada.
Ver resposta modelo
Extraia os dados históricos das verificações sintéticas contínuas. Mostre ao diretor de operações o painel que confirma que, durante a janela exata de 15 minutos do intervalo, os APs estavam a resolver DNS com sucesso e a alcançar o endereço IP do servidor de bilheteira com baixa latência. Isto prova imediatamente que a rede sem fios estava operacional e transfere a investigação para os servidores da aplicação de bilheteira, que provavelmente cederam sob a carga súbita.
Continue a ler esta série
Conceção de Redes WiFi para Edifícios de Escritórios Multi-Inquilino
Este guia fornece aos gestores de TI, arquitetos de rede e CTOs um plano neutro em termos de fornecedor para conceber redes WiFi escaláveis, seguras e isoladas em edifícios de escritórios multi-inquilino. Aborda a segmentação de VLAN sob IEEE 802.1Q, a Atribuição Dinâmica de VLAN através de 802.1X e RADIUS, o planeamento de RF para ambientes de alta densidade e considerações de conformidade sob GDPR e PCI-DSS. Os operadores de espaços e gestores de edifícios encontrarão orientações de arquitetura práticas, estudos de caso do mundo real e erros de configuração a evitar antes da implementação.
Requisitos Legais e de Conformidade para Infraestrutura de WiFi Partilhada
Este guia de referência técnica autoritário descreve os requisitos legais, regulamentares e de arquitetura críticos para a implementação e gestão de infraestruturas de WiFi partilhadas. Fornece aos gestores de TI, arquitetos de rede e operadores de espaços estruturas acionáveis para garantir uma proteção de dados robusta, conformidade estrita com a segurança de pagamentos e isolamento de inquilinos de alto desempenho utilizando padrões empresariais.
Gestão de Largura de Banda e Qualidade de Serviço (QoS) em Espaços de Co-Working
Um guia de referência técnica autoritativo para gestores de TI, arquitetos de rede e diretores de operações de espaços sobre a implementação de estruturas robustas de Gestão de Largura de Banda e Qualidade de Serviço (QoS) em ambientes de co-working. Este guia detalha a segmentação de rede, a priorização de tráfego, as configurações neutras de fornecedor e as métricas reais de ROI para fornecer conectividade de classe empresarial. Abrange as normas IEEE 802.11e/WMM, o design de VLAN, a limitação de taxa por utilizador e estratégias de resolução de problemas com resultados de negócio mensuráveis.