Mean Time to Innocence: Wie Sie beweisen, dass es nicht am WiFi liegt
Die Mean Time to Innocence (MTTI) ist die entscheidende Kennzahl dafür, wie viel Zeit IT-Teams damit verbringen, zu beweisen, dass ein Netzwerkproblem nicht ihre Schuld ist. Dieser Leitfaden beschreibt eine fünfstufige Observability-Methodik, um gegenseitige Schuldzuweisungen in Multi-Tenant-Umgebungen zu eliminieren und diese durch gemeinsame Beweise zu ersetzen, um die Mean Time to Resolution (MTTR) drastisch zu senken.
Diesen Leitfaden anhören
Podcast-Transkript ansehen
📚 Part of our core series: Multi-Tenant-WiFi: Der vollständige Leitfaden →
Executive Summary
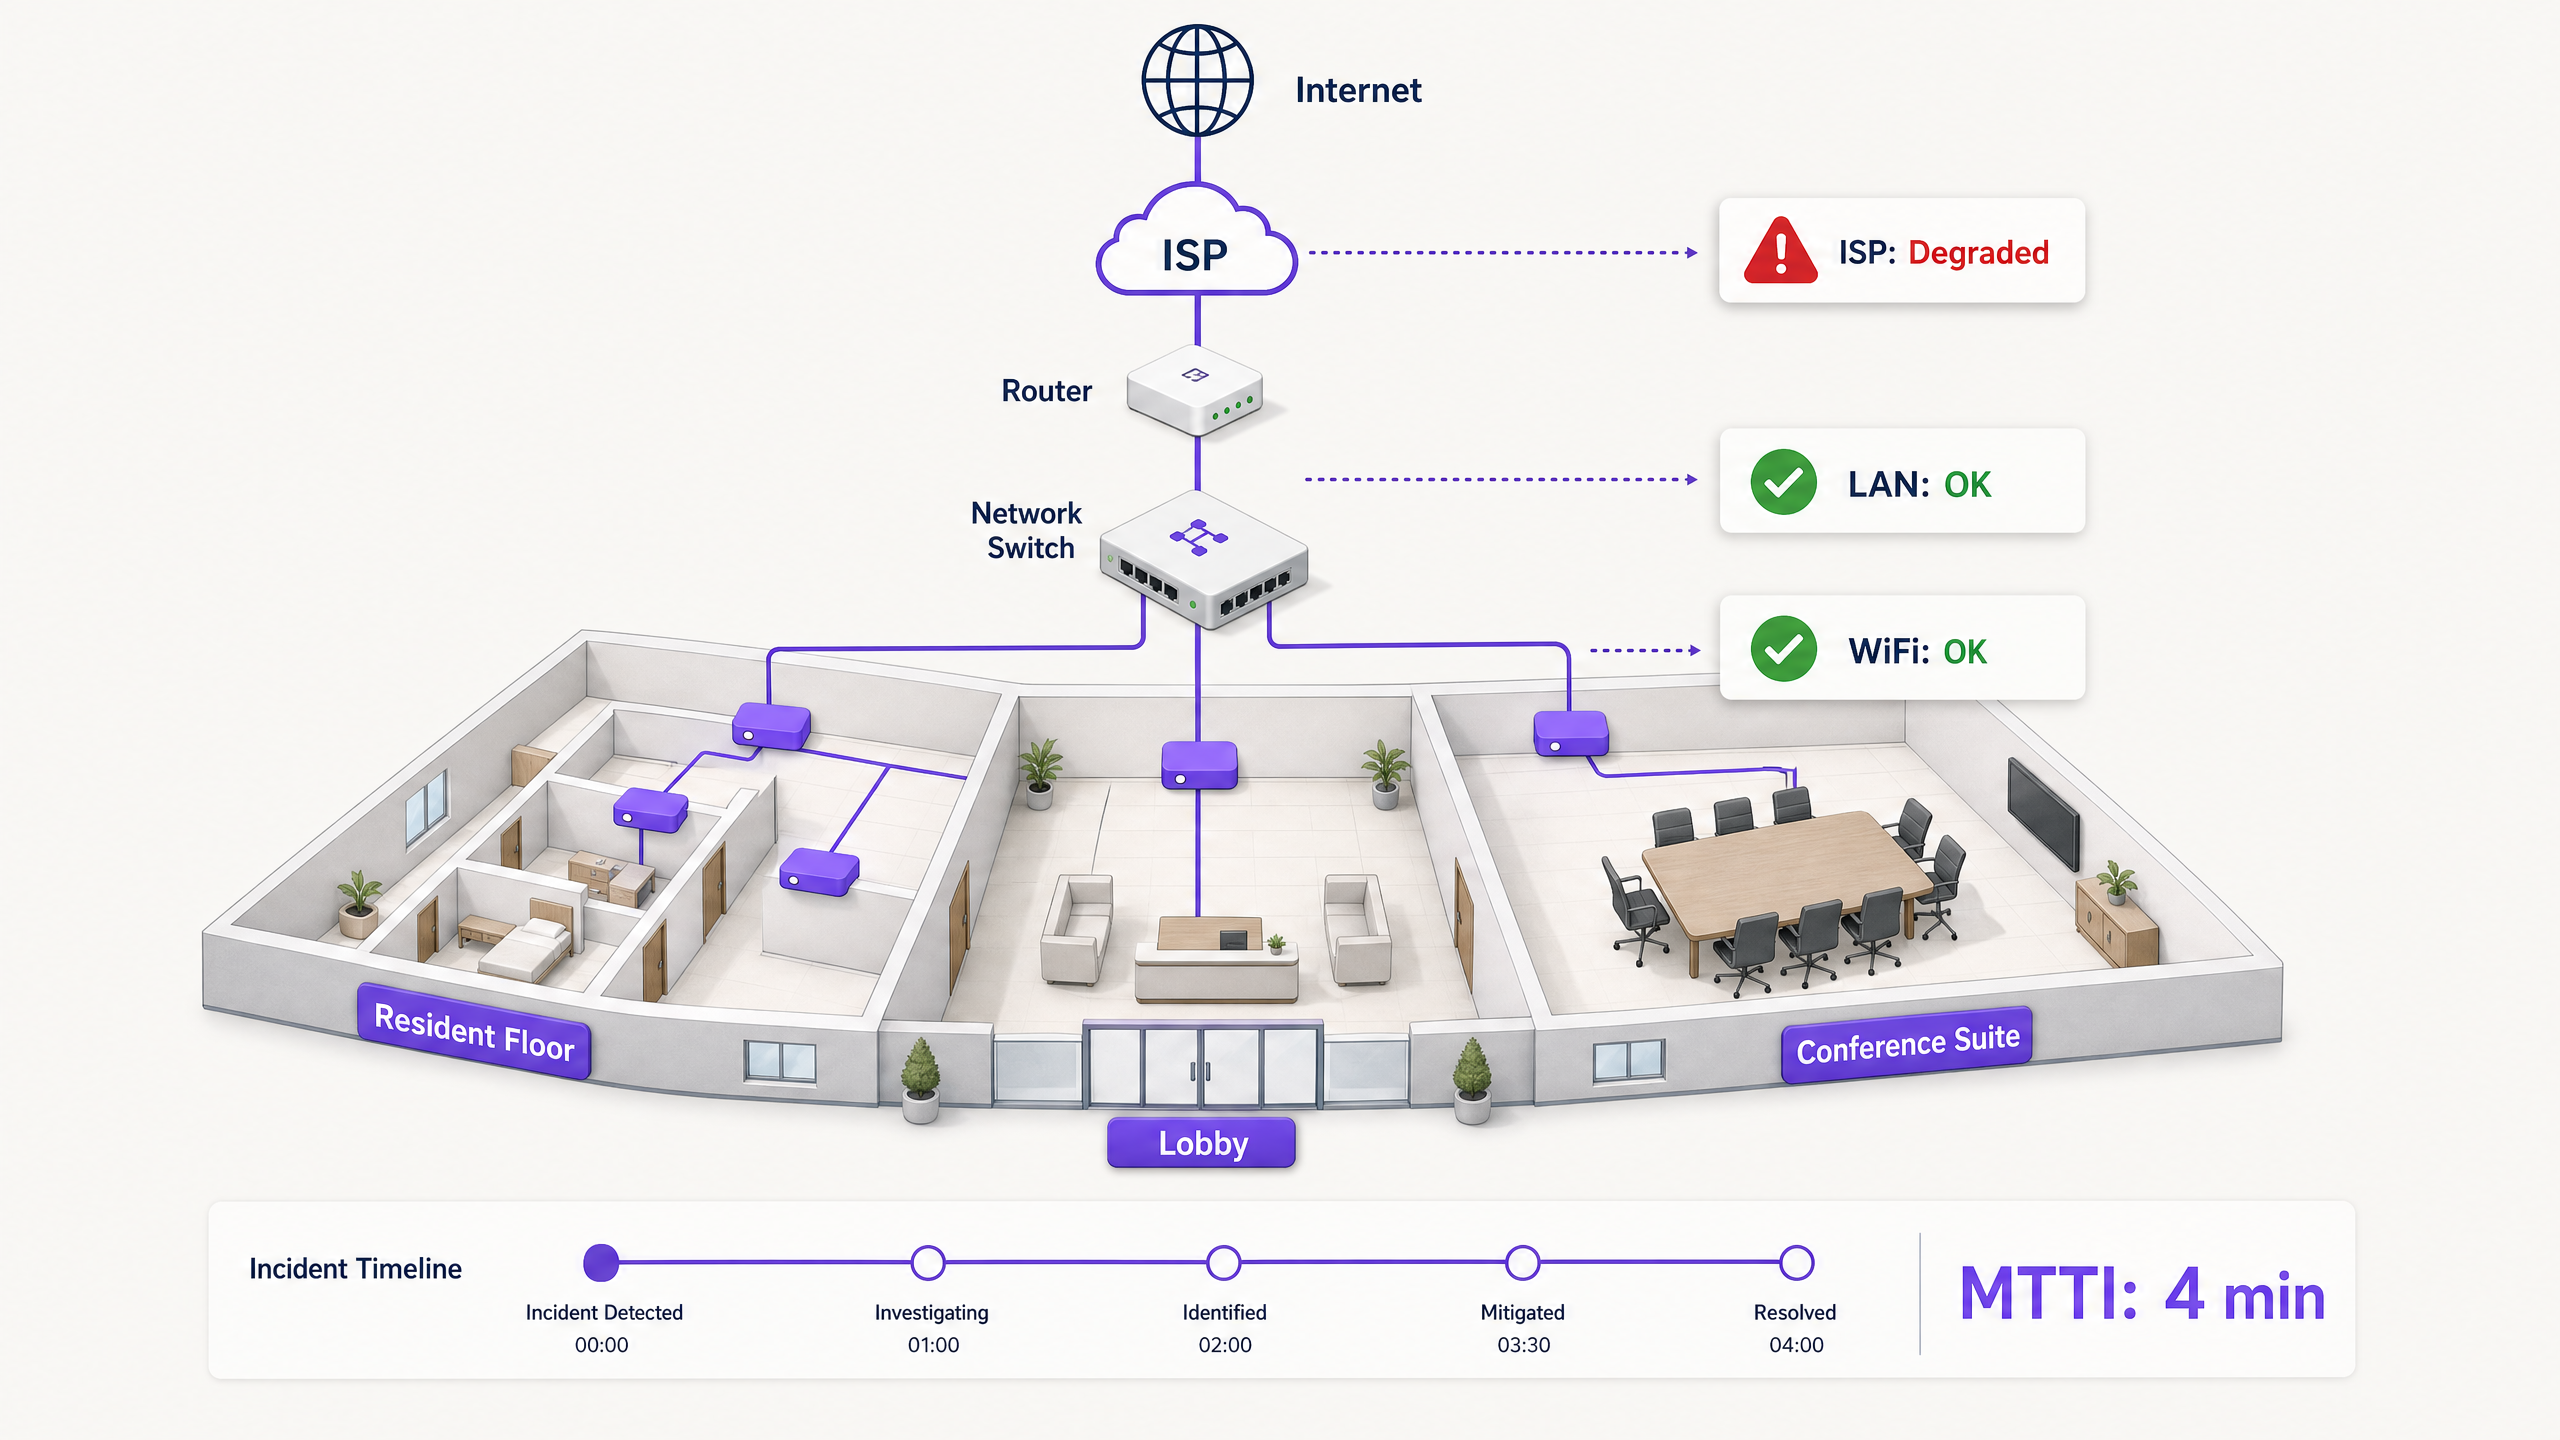
Wenn in einer Multi-Tenant-Umgebung die Verbindung abbricht, wird die Schuld zuerst dem WiFi zugeschoben. Es ist der sichtbare Rand des Netzwerks, der letzte Hop vor dem Gerät und das einfachste Ziel für frustrierte Nutzer. Für IT-Manager, Netzwerkarchitekten und Betriebsleiter von Veranstaltungsorten führt dies zu einer ständigen operativen Belastung: der Zeit, die für den Unschuldsnachweis aufgewendet werden muss.
Die Mean Time to Innocence (MTTI) misst die durchschnittliche Zeit zwischen der Meldung eines Vorfalls und der Fähigkeit eines Teams, nachzuweisen, dass die Ursache nicht in seinem Bereich liegt. In komplexen Umgebungen wie Build-to-Rent-Wohnblöcken (BTR), Hotels oder Konferenzzentren ist das Netzwerk auf Immobilienverwalter, Managed-WiFi-Anbieter und Internet-Service-Provider (ISPs) aufgeteilt. Ohne eindeutige Telemetriedaten verlängert die MTTI die Mean Time to Resolution (MTTR), da die Teams über die Zuständigkeit streiten, anstatt den Fehler zu beheben.
Dieser Leitfaden beschreibt eine fünfstufige Observability-Methodik zur systematischen Reduzierung der MTTI. Durch den Einsatz von kontinuierlichen synthetischen Tests, Hop-by-Hop-Pfadtransparenz, Flussdatenanalyse, Topologie-Mapping und Ereigniskorrelation können Sie gegenseitige Schuldzuweisungen durch gemeinsame Beweise ersetzen. Das Ziel ist nicht, das Schuldspiel schneller zu gewinnen, sondern es ganz zu beenden.
Technischer Deep-Dive: Die Funktionsweise der MTTI
Der Unterschied zwischen MTTI und Mean Time to Identify
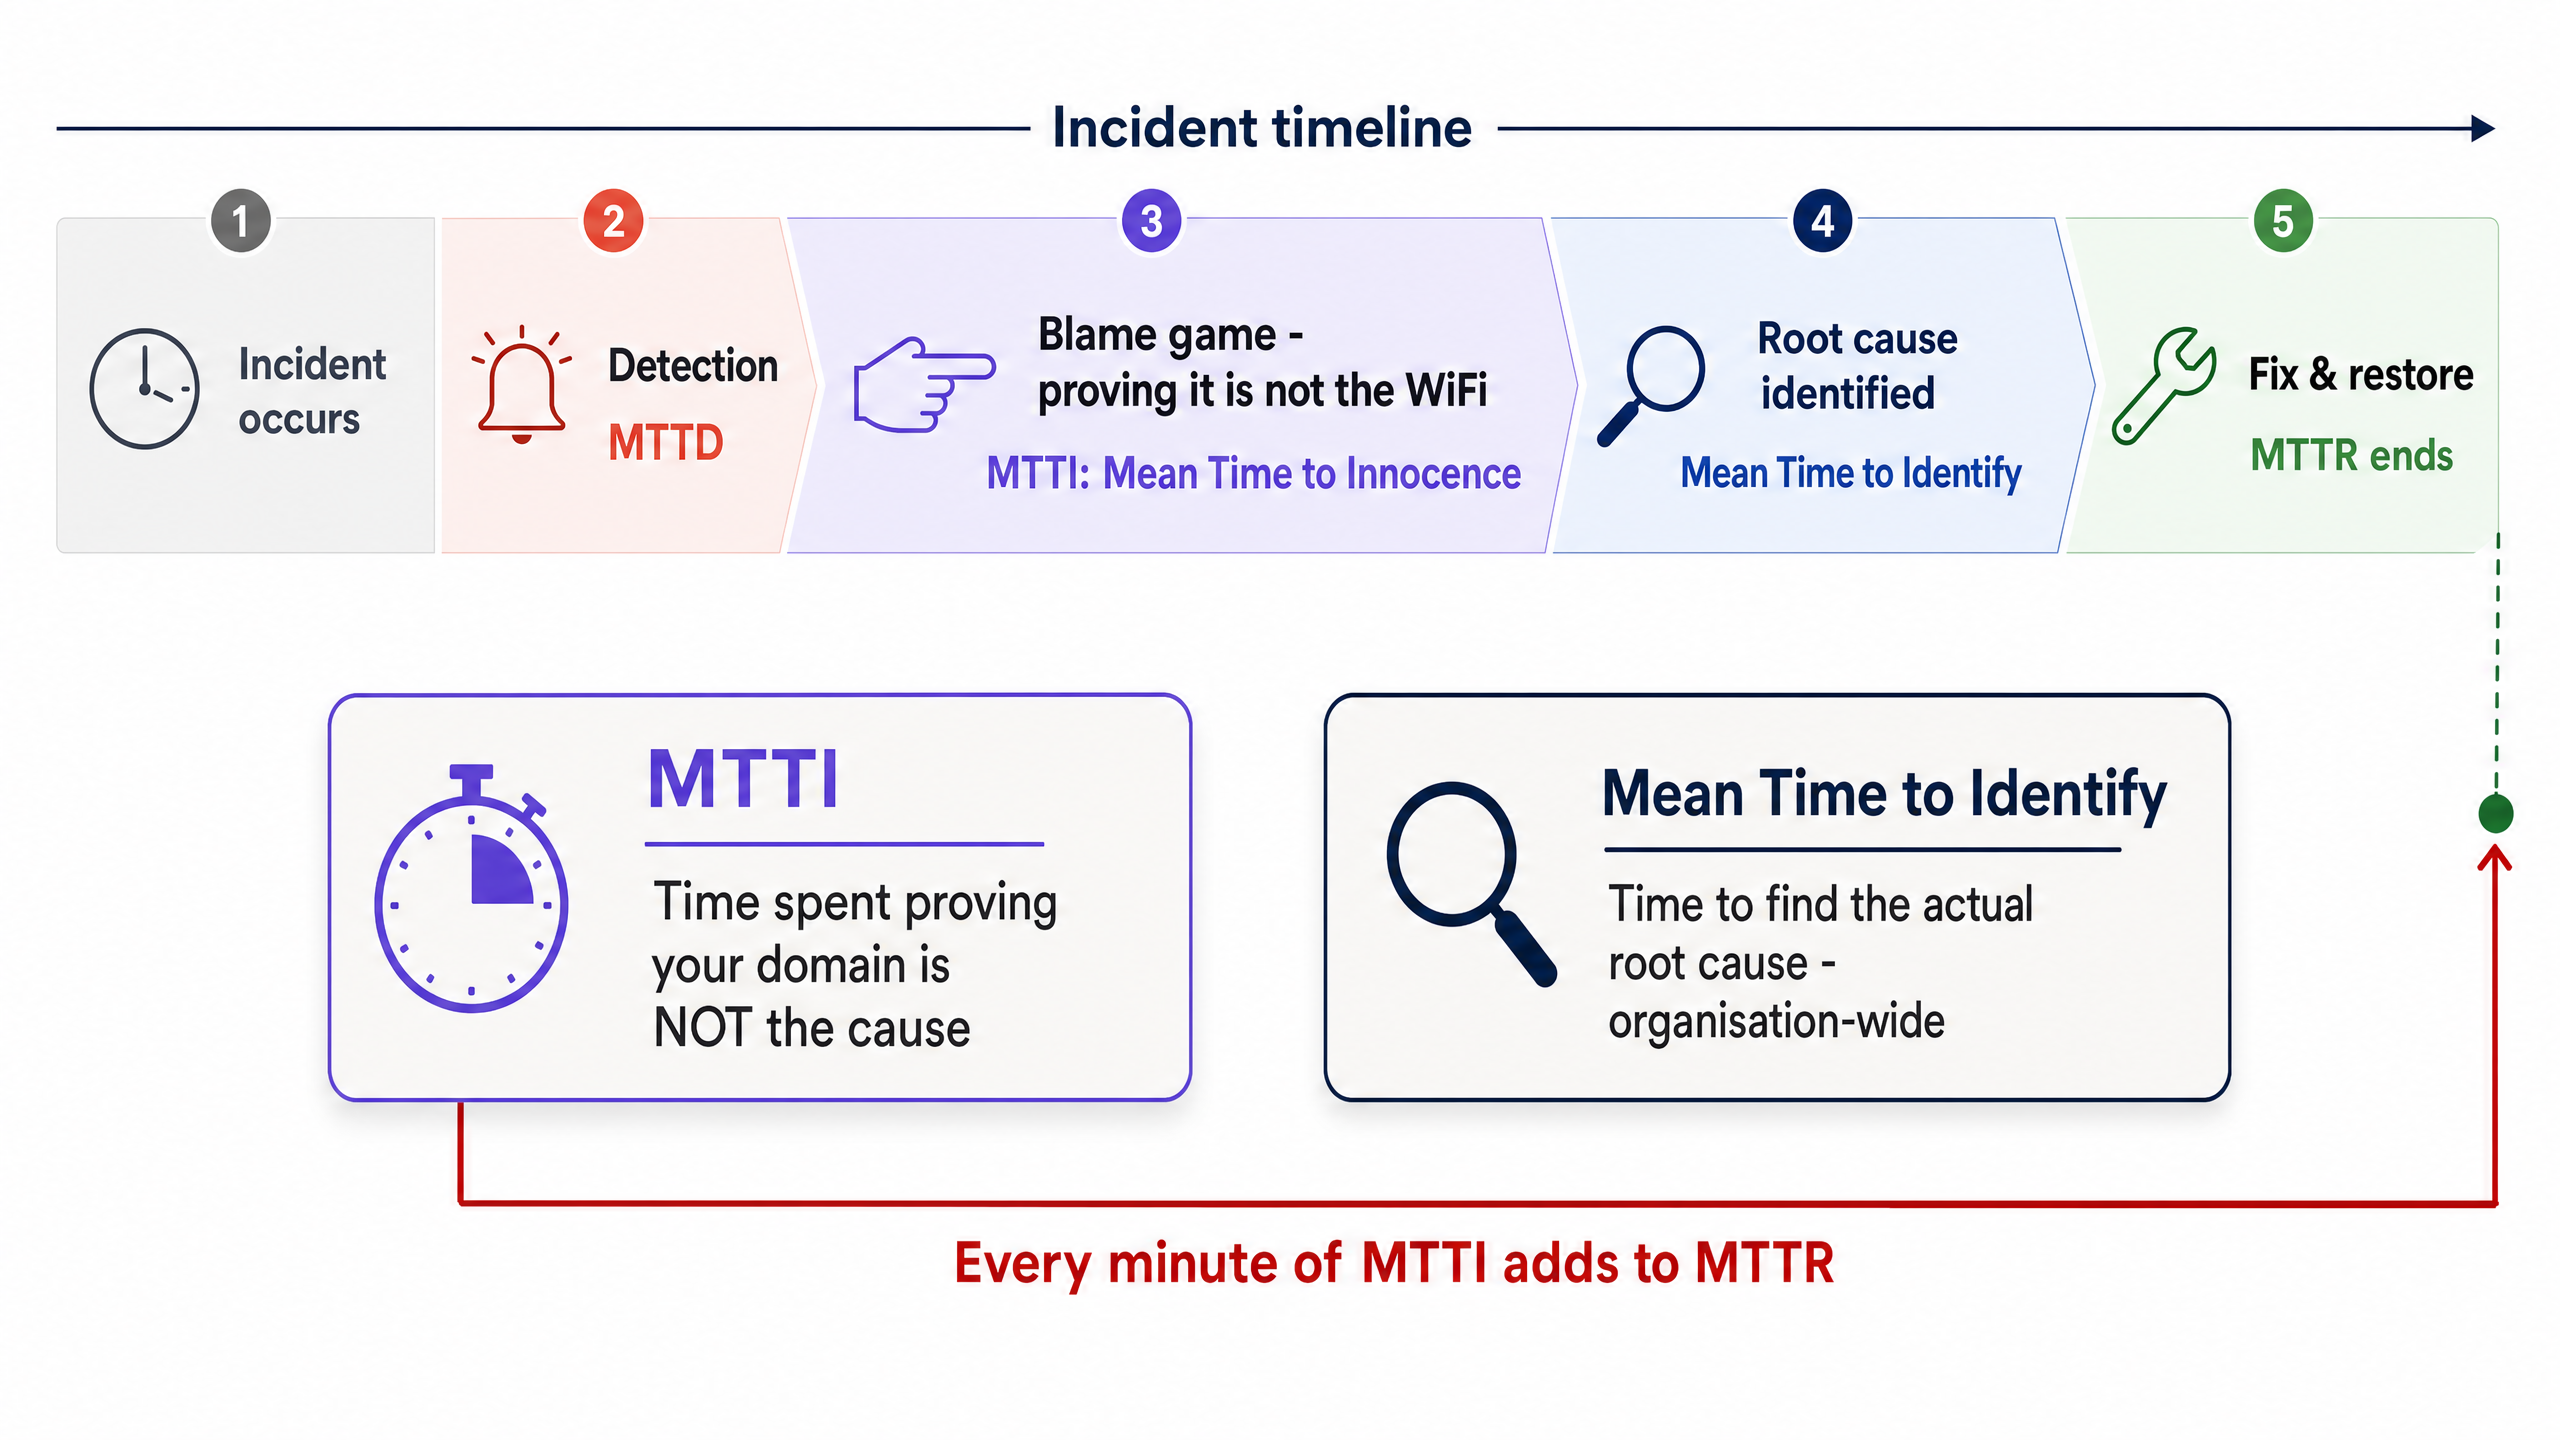
Es ist wichtig, die MTTI von der Mean Time to Identify zu unterscheiden. Die Mean Time to Identify ist eine unternehmensweite Kennzahl, die erfasst, wie lange es dauert, die tatsächliche Ursache eines Ausfalls zu finden. Die MTTI hingegen ist eine isolierte, bereichsspezifische Kennzahl, die misst, wie lange ein Team benötigt, um zu beweisen, dass es nicht der Verursacher ist.
Jede Minute MTTI fließt direkt in die MTTR ein. Wenn ein Managed-WiFi-Anbieter 40 Minuten damit verbringt, Access Points (APs) und Switch-Protokolle manuell zu überprüfen, bevor er feststellt, dass das Problem beim ISP liegt, ist in der MTTR bereits eine Verzögerung von 40 Minuten enthalten, noch bevor die eigentliche Behebung überhaupt beginnt.
Warum dem WiFi die Schuld gegeben wird
In Umgebungen mit 350 Millionen einzigartigen Nutzern an über 80.000 Live-Standorten sieht Purple immer wieder dasselbe Muster. Dem WiFi-Layer wird standardmäßig aufgrund von drei strukturellen Gegebenheiten die Schuld gegeben:
- Sichtbarkeitsverzerrung (Visibility Bias): Die WiFi-Signalanzeige ist das einzige Netzwerkdiagnosetool, das dem durchschnittlichen Nutzer vor Ort zur Verfügung steht.
- Nähe zum Endgerät (Edge Proximity): Als letzter Hop zum Client-Gerät erbt das WiFi die Symptome jedes vorgelagerten Ausfalls. Ein DNS-Timeout beim ISP sieht aus der Perspektive des Nutzers genauso aus wie ein AP-Ausfall.
- Telemetrielücken: In der Vergangenheit erforderte der Nachweis eines einwandfreien WLAN-Status manuelle Eingriffe. Wenn Sie den einwandfreien Zustand des Wireless-Layers nicht in weniger als zwei Minuten nachweisen können, haben Sie argumentativ bereits verloren.
Die Multi-Tenant-Komplikation
In einem Single-Tenant-Unternehmen verwalten die Netzwerkteams den gesamten Stack vom AP bis zur Firewall. In Multi-Tenant-WiFi-Umgebungen ist die Zuständigkeit fragmentiert.
Ein BTR-Bewohner zahlt an die Hausverwaltung. Die Hausverwaltung beauftragt einen Managed-WiFi-Anbieter. Der Managed-WiFi-Anbieter ist auf die Leitung eines Drittanbieter-ISPs und oft auch auf das hausinterne Verteilernetz des Vermieters angewiesen. Wenn ein Bewohner keine Videos streamen kann, muss der Anbieter die WiFi-Hardware (Cisco Meraki, HPE Aruba, Ruckus oder Juniper Mist) schnell entlasten und den Fehler auf das Client-Gerät, den Switch im Gebäude oder den ISP eingrenzen. Gelingt dies nicht, schadet dies der Geschäftsbeziehung zwischen dem Anbieter und der Hausverwaltung.
Implementierungsleitfaden: Die 5-Stufen-Methodik
Um die MTTI systematisch zu reduzieren, implementieren Sie diese fünfstufige Observability-Architektur.
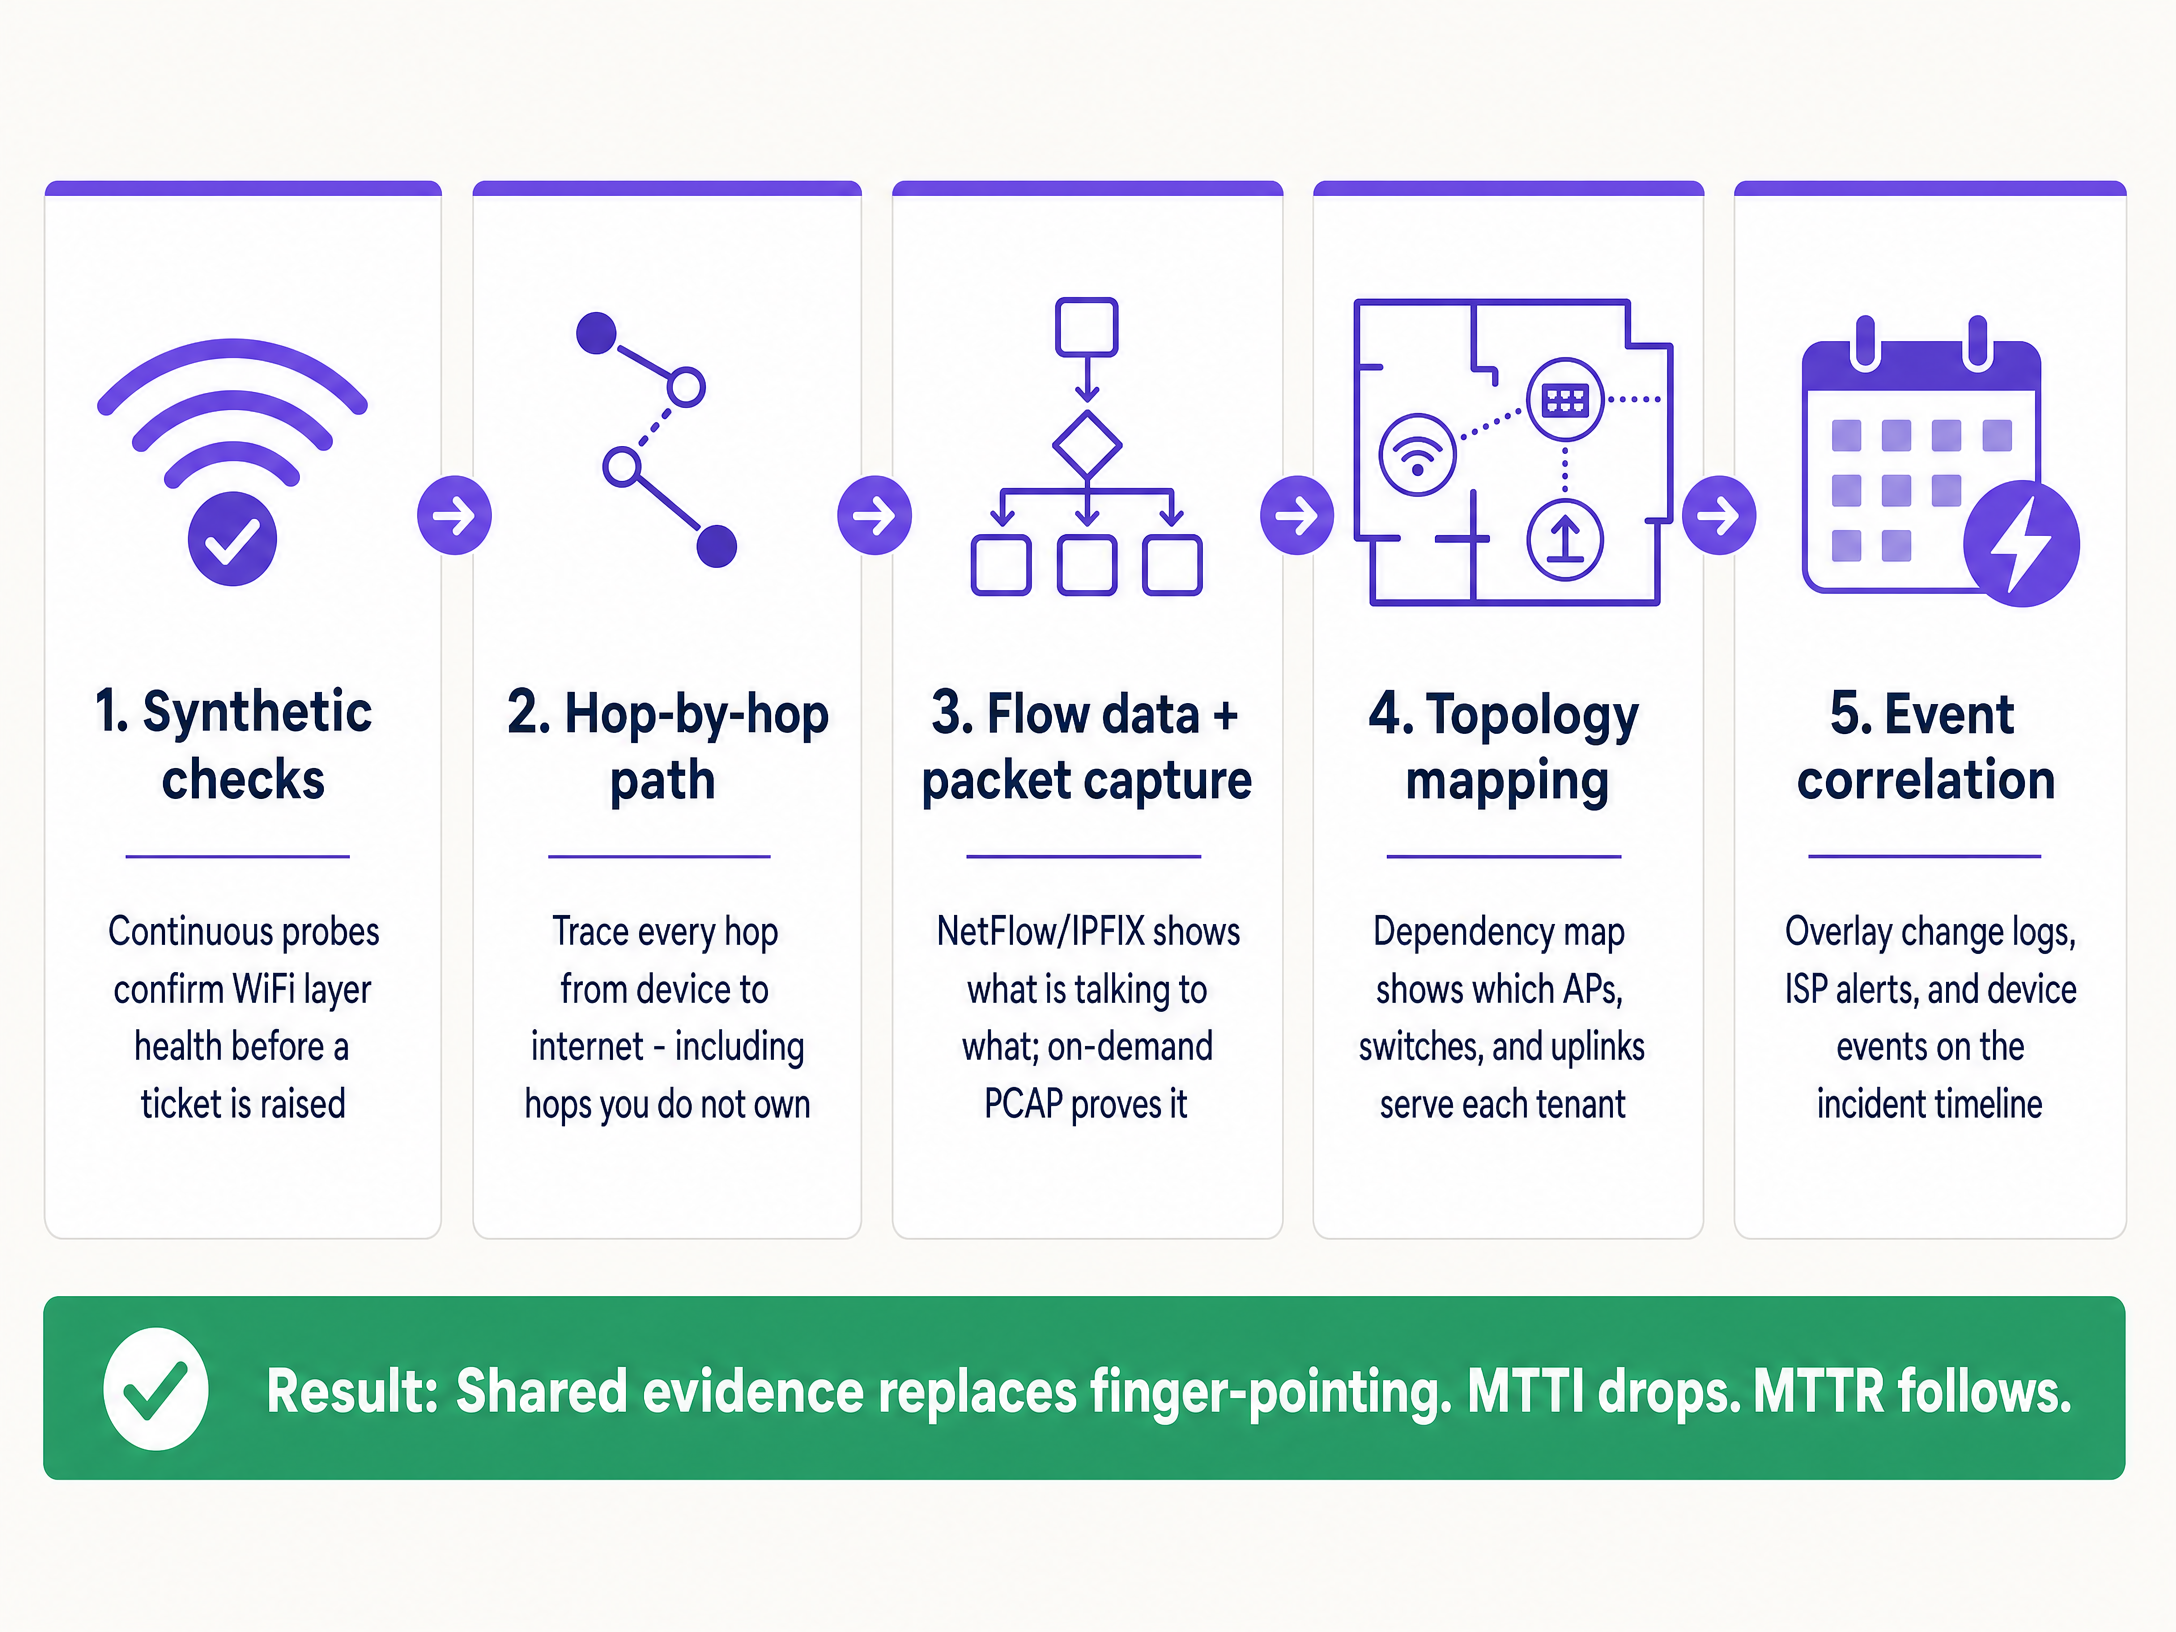
1. Kontinuierliche synthetische Tests
Warten Sie nicht darauf, dass sich ein Nutzer beschwert. Setzen Sie automatisierte synthetische Probes ein, die das Nutzerverhalten kontinuierlich vom Netzwerkrand aus emulieren.
- Implementierung: Konfigurieren Sie APs oder dedizierte Sensoren so, dass sie geplante Tests für DHCP-Antworten, DNS-Auflösung, HTTP-Erreichbarkeit und Authentifizierungsabläufe (wie 802.1X oder Captive Portal-Logins) ausführen.
- Ergebnis: Wenn ein Ticket erstellt wird, prüfen Sie zuerst das Dashboard für die synthetischen Tests. Wenn die Probes zum genauen Zeitpunkt der Beschwerde eine einwandfreie HTTP-Erreichbarkeit anzeigen, entlasten Sie sofort den WiFi-Layer und die WAN-Leitung und richten den Fokus auf das spezifische Client-Gerät oder die Zielanwendung.
2. Hop-by-Hop-Pfadtransparenz
Der Nachweis, dass Ihre Hardware einwandfrei funktioniert, reicht nicht aus, wenn Sie nicht beweisen können, dass der Pfad zum Internet frei ist.
- Implementierung: Nutzen Sie Tools zur Pfadvisualisierung, um den Datenverkehr vom Access-Layer über das LAN, durch den Demarkationspunkt und in das ISP-Netzwerk zu verfolgen.
- Ergebnis: Bei Latenzspitzen zeigt ein Pfad-Trace genau, welcher Knoten die Verzögerung verursacht hat. Wenn die Hops eins bis vier (Ihr Bereich) eine Latenz von 2 ms aufweisen und Hop fünf (der Edge-Router des ISPs) eine Latenz von 150 ms und 12 % Paketverlust zeigt, haben Sie einen eindeutigen Beweis für den ISP in der Hand.
3. Flussdaten und On-Demand-Paketerfassung
Wenn Nutzer anwendungsspezifische Fehler melden, benötigen Sie Transparenz auf Verbindungsebene.
- Implementierung: Exportieren Sie NetFlow- oder IPFIX-Daten von Ihren Core-Switches oder Firewalls. Stellen Sie sicher, dass Ihre Access-Layer-Hardware die Remote-Paketerfassung (PCAP) auf Abruf unterstützt, ohne dass ein Techniker vor Ort sein muss.
- Ergebnis: Flussdaten belegen, ob der Datenverkehr zu einem bestimmten Dienst Ihr Netzwerk sauber verlässt. Wenn dies der Fall ist, ist das Netzwerk unschuldig. Wenn dWenn ein tiefergehender forensischer Nachweis erforderlich ist, liefert ein gezieltes PCAP auf dem spezifischen VLAN unbestreitbare Beweise für TCP-Retransmissions oder serverseitige Resets.
4. Topologie- und Abhängigkeits-Mapping
In einer Multi-Tenant-Umgebung ist die Isolierung des Schadensradius (Blast Radius) der schnellste Weg, um einen Fehler zu kategorisieren.
- Implementierung: Pflegen Sie eine Live-Karte der Abhängigkeiten, die dynamisch aktualisiert wird und jeden AP mit seinem Switch, Uplink und WAN-Schaltkreis verknüpft, abgeglichen mit den VLANs der Mandanten.
- Ergebnis: Wenn ein Fehler APs über mehrere Etagen hinweg, aber nur an einem einzigen Switch betrifft, liegt das Problem beim Switch. Wenn er alle APs, aber nur das VLAN eines einzelnen Mandanten betrifft, handelt es sich um ein logisches Konfigurationsproblem. Eine schnelle Eingrenzung verhindert unnötigen Aufwand bei der Untersuchung einer funktionierenden Infrastruktur.
5. Ereigniskorrelation
Daten ohne Kontext verzögern Untersuchungen.
- Implementierung: Führen Sie Änderungsprotokolle, ISP-Wartungsmeldungen, Hardware-Firmware-Updates und Benutzertickets in einer einzigen Zeitachsenansicht zusammen.
- Ergebnis: Die Überlagerung eines Anstiegs von Authentifizierungsfehlern mit dem Ablauf eines Microsoft Entra ID-Zertifikats, das 10 Minuten zuvor aufgetreten ist, identifiziert sofort die Ursache und umgeht die Netzwerkhardware vollständig.
Best Practices
- Standardisierung des Hardware-Stacks: Beschränken Sie Bereitstellungen auf etablierte Enterprise-Anbieter (Cisco Meraki, HPE Aruba, Ruckus, Juniper Mist, Ubiquiti UniFi, Cambium, Extreme, Fortinet), die APIs für synthetische Tests und Remote-PCAP bereitstellen.
- Beweise automatisieren: Konfigurieren Sie Ihre Monitoring-Plattform so, dass synthetische Testergebnisse und Pfadverfolgungen (Path Traces) automatisch an ITSM-Tickets angehängt werden, sobald diese erstellt werden.
- Dashboard teilen: Bieten Sie Property-Managern Lesezugriff auf ein übergeordnetes Health-Dashboard. Transparenz beugt gegenseitigen Schuldzuweisungen vor.
- MTTI formal erfassen: Messen Sie die Zeit zwischen der Ticketerstellung und dem Moment, in dem Ihr Team den Unschuldsbeweis erbringt. Behandeln Sie dies als primäre KPI neben der MTTR.
Fehlerbehebung & Risikominderung
- Risiko: Die „Kein Fehler gefunden“-Schleife: Benutzer melden Probleme, aber die synthetischen Prüfungen zeigen „Grün“.
- Minderung: Das Problem ist wahrscheinlich gerätespezifisch oder hängt mit HF-Interferenzen zusammen (Kanalinterferenzen oder physische Hindernisse). Nutzen Sie clientseitige Analysen, um die RSSI und den Roaming-Verlauf des spezifischen Geräts zu überprüfen.
- Risiko: Ablehnung durch den ISP: Der ISP weigert sich trotz Ihrer Beweise, den Fehler anzuerkennen.
- Minderung: Stellen Sie Hop-by-Hop-Pfadverfolgungen bereit, die die genaue IP-Adresse zeigen, an der der Paketverlust beginnt. Teilen Sie PCAPs, die einen sauberen Ausgang (Egress) an Ihrem Demarkationspunkt belegen. Harte Fakten erzwingen eine Eskalation über den Level-1-Support hinaus.
- Risiko: Captive Portal-Ausfälle: Benutzer geben dem WiFi die Schuld, wenn das Portal nicht geladen wird.
- Minderung: Isolieren Sie den Identity Provider. Überprüfen Sie den Status der Integration (Microsoft Entra ID, Okta, Google Workspace). Wenn das Netzwerk Pre-Authentication-Traffic zulässt, aber der IdP ein Timeout meldet, ist das Netzwerk unschuldig.
ROI & geschäftliche Auswirkungen
Die Reduzierung der MTTI liefert einen messbaren geschäftlichen Mehrwert, der weit über die bloße Einsparung von Entwicklungsstunden hinausgeht.
- Reduzierte MTTR: Wenn bei einem Vorfall 40 Minuten gegenseitiger Schuldzuweisungen entfallen, reduziert dies direkt die Ausfallzeit und schützt den Umsatz in Einzelhandels- und Hotellerie- Umgebungen.
- SLA-Compliance: Eine schnellere Entlastung verhindert, dass ungerechtfertigte Strafen gegen den Managed-WiFi-Anbieter verhängt werden, wenn der Fehler beim ISP oder der Gebäudeinfrastruktur liegt.
- Kundenbindung: Im Multi-Tenant-WiFi-Sektor verlängern Property-Manager Verträge mit Anbietern, die Transparenz und schnelle Antworten bieten. Gemeinsame Beweise schaffen Vertrauen; defensive Argumente zerstören es.
- Ressourcenoptimierung: Hochbezahlte Level-3-Netzwerktechniker verbringen ihre Zeit mit der Entwicklung von Lösungen, anstatt manuell zu beweisen, dass das Netzwerk ordnungsgemäß funktioniert.
Schlüsseldefinitionen
Mean Time to Innocence (MTTI)
The average time required for a specific IT team to prove, using objective data, that their domain or infrastructure is not the root cause of a reported incident.
Critical for managed WiFi providers who must defend their service against property managers and ISPs.
Mean Time to Identify
The organisation-wide metric tracking the total time elapsed from incident detection to the discovery of the actual root cause.
MTTI is a subset of this metric. Reducing MTTI directly reduces the overall time to identify.
Synthetic Checks
Automated, continuous tests that emulate user traffic (e.g., DNS lookups, HTTP requests) to proactively monitor network health.
Used to prove the WiFi layer was functioning correctly at the exact moment a user complained.
Hop-by-Hop Path Visibility
Telemetry that traces network traffic node-by-node from the client to the destination, measuring latency and loss at each specific router or switch.
Essential for proving a fault lies in an ISP network or a landlord's distribution switch, rather than the managed WiFi hardware.
Flow Data (NetFlow/IPFIX)
Network protocol data that provides a summary of traffic conversations, showing source, destination, protocol, and volume.
Used to prove that specific application traffic is successfully leaving the local network.
On-Demand Packet Capture (PCAP)
The ability to remotely record raw network traffic from an access point or switch for forensic analysis.
The ultimate proof used to demonstrate server-side errors or client device misbehaviour.
Blast Radius
The scope of impact of a specific incident (e.g., one user, one AP, one switch, one tenant, or the entire building).
Determining the blast radius via topology mapping is the fastest way to exclude healthy infrastructure from an investigation.
Event Correlation
The practice of overlaying different data streams (logs, alerts, updates) on a single timeline to identify cause and effect.
Used to prove that a network outage was caused by a third-party change, such as an unannounced ISP maintenance window.
Ausgearbeitete Beispiele
A 350-room hotel reports that in-room WiFi is slow across the entire property. The front desk blames the managed WiFi provider. How do you exonerate the network and find the root cause?
- Check the synthetic probes: DNS and HTTP reachability tests show the APs have a clean connection to the internet. 2. Review the topology map: The issue affects all APs across all switches, ruling out edge hardware. 3. Execute a path trace: The trace shows 2ms latency within the hotel LAN, but 180ms latency at the third hop (the ISP's aggregation router). 4. Export the evidence: Send the path trace screenshot to the hotel manager and the ISP.
A national retailer reports point-of-sale (POS) terminals in one region are dropping connections to the payment processor. The network team is blamed for a firewall or routing misconfiguration.
- Isolate the blast radius: Confirm only POS terminals (specific VLAN) are affected; guest WiFi and back-office systems are healthy. 2. Analyse flow data: NetFlow confirms traffic destined for the payment processor's IP range is successfully leaving the store routers. 3. Capture packets: An on-demand PCAP on the POS VLAN reveals the payment processor's server is sending TCP resets (RST). 4. Share the PCAP with the payment processor's support team.
Übungsfragen
Q1. A tenant in a coworking space complains they cannot access their corporate VPN. Other tenants are browsing the internet without issue. What is the most efficient way to prove the WiFi network is not at fault?
Hinweis: Consider the blast radius and the specific type of traffic failing.
Musterlösung anzeigen
First, use the topology map to confirm the blast radius is limited to one user or one specific service, ruling out a general AP or switch failure. Second, analyse flow data (NetFlow/IPFIX) for that client's IP address. If the flow data shows the VPN traffic (e.g., UDP 500 or TCP 443) is leaving the network cleanly, the WiFi and LAN are innocent. The issue is either the client's VPN configuration or the corporate firewall blocking the connection.
Q2. Your monitoring dashboard shows an AP has gone offline, but the property manager insists the WiFi is broken because the ISP is down. How do you prove the issue is internal power, not the ISP?
Hinweis: Look for correlation between infrastructure state and external events.
Musterlösung anzeigen
Use event correlation and topology mapping. If the topology map shows only one AP is offline while others on the same switch are functioning, the ISP circuit is clearly active. Event correlation might show a PoE (Power over Ethernet) failure log from the switch port connected to that specific AP. This proves the issue is local hardware or cabling, not the WAN circuit.
Q3. A stadium operations director claims the WiFi failed during halftime because ticket scanners stopped working. You need to exonerate the network in under two minutes. What telemetry do you use?
Hinweis: You need historical proof of health at the exact moment of the reported failure.
Musterlösung anzeigen
Pull the historical data from the continuous synthetic checks. Show the operations director the dashboard confirming that during the exact 15-minute halftime window, the APs were successfully resolving DNS and reaching the ticketing server's IP address with low latency. This immediately proves the wireless network was healthy and shifts the investigation to the ticketing application servers, which likely buckled under the sudden load.
Weiterlesen in dieser Reihe
Der Enterprise-Leitfaden für SCEP: Bereitstellung des Simple Certificate Enrollment Protocol für automatisierte Campus-WiFi-Sicherheit
Dieser technische Referenzleitfaden bietet einen definitiven Architektur-Blueprint und eine Schritt-für-Schritt-Implementierungsstrategie für die Bereitstellung von Enterprise-WiFi-Zertifikaten mit SCEP. Er behandelt die entscheidenden Unterschiede zwischen SCEP und PKCS, die genaue Bereitstellungsreihenfolge für einen erfolgreichen Rollout sowie praxisnahe Strategien zur Risikominderung für IT-Verantwortliche.
Warum verbindet sich mein Gäste-WiFi nicht? Fehlerbehebung bei Captive Portal-Problemen
Dieser maßgebliche technische Leitfaden erklärt die zugrunde liegenden Mechanismen der Captive Portal-Erkennung und beschreibt die sechs primären Fehlermodi, die verhindern, dass sich das Gäste-WiFi verbindet. Er bietet IT-Managern und Netzwerkarchitekten ein praktisches Framework zur Fehlerbehebung, um HTTP-Redirect-Probleme, DNS-Konflikte und Herausforderungen bei der MAC-Randomisierung zu lösen.
So implementieren Sie SCEP für die automatisierte WiFi-Zertifikatsregistrierung
Dieser Leitfaden erklärt, wie Sie SCEP (Simple Certificate Enrollment Protocol) für die automatisierte WiFi-Zertifikatsregistrierung in Unternehmensstandorten implementieren. Er deckt den gesamten architektonischen Entwurf ab – vom PKI-Design und der MDM-Integration bis hin zur obligatorischen dreistufigen Bereitstellungssequenz – und zeigt IT-Managern und Netzwerkarchitekten, wie sie gemeinsam genutzte Anmeldedaten eliminieren, das Zertifikats-Lebenszyklusmanagement automatisieren und PCI DSS- und GDPR-Anforderungen im großen Stil erfüllen.