
How Shopping Centres Use WiFi Analytics to Attract and Retain Retailers
This authoritative technical reference guide explains how shopping centre IT teams and property managers deploy WiFi analytics to capture footfall data, measure dwell time by zone, and build the empirical evidence base needed to negotiate leases, retain premium retailers, and attract new tenants. It covers the full technical stack from AP deployment and MAC-layer data capture through to GDPR-compliant analytics dashboards, with concrete worked examples and decision frameworks for IT practitioners ready to implement this quarter.
Video overview
Listen to this guide
View podcast transcript
Part of our core series: WiFi Analytics Guide →
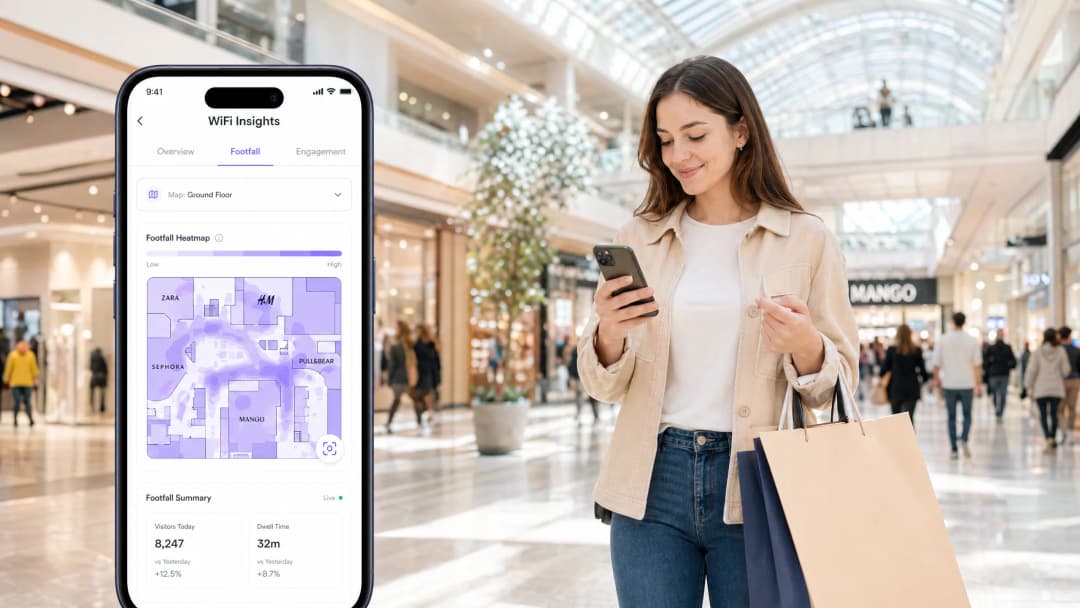
Executive Summary
For modern shopping centres, a wireless network is no longer just a guest amenity - it is the physical venue's primary telemetry system. By deploying a robust Guest WiFi infrastructure paired with an enterprise-grade WiFi Analytics platform, venue operators transform passive wireless signals into actionable commercial intelligence.
This guide details the technical architecture, deployment strategies, and data utilisation methodologies required to capture highly accurate footfall and dwell metrics. For IT managers, network architects, and CTOs, the mandate is clear: build a resilient, high-density network that not only supports high user throughput but also delivers the spatial data accuracy needed by leasing and commercial teams to prove ROI, justify lease values, and attract tier-one retail tenants. The same principles apply across hospitality, transport, and healthcare environments, where spatial intelligence drives operational and commercial decisions.
Technical Deep-Dive
How WiFi Data Collection Works
The foundation of shopping centre WiFi analytics is the ability to detect and track client devices within the venue. This is achieved through two primary mechanisms operating in parallel.
Presence Analytics (Unauthenticated): Access points (APs) continuously monitor for IEEE 802.11 probe requests emitted by smartphones searching for familiar networks. By capturing MAC addresses - which are instantly hashed using one-way cryptographic functions to maintain GDPR compliance - and measuring the Received Signal Strength Indicator (RSSI) from multiple APs simultaneously, the system estimates device proximity and movement. This provides a baseline metric for total footfall, including visitors who never explicitly connect to the network. This is the "pedestrian" or passer-by count that property managers use to demonstrate the commercial value of high-traffic corridors.
Authenticated Sessions: When a user actively connects via the Captive Portal, the venue captures first-party data - demographics, email addresses, and CRM integration hooks - on the basis of explicit consent. This shifts the data model from anonymous device tracking to enriched customer profiling. The integration of OpenRoaming (Hotspot 2.0 / Passpoint), where Purple acts as a free Identity Provider under the connect license, facilitates seamless and secure onboarding without traditional splash pages. This vastly increases the volume of authenticated sessions, providing a richer and more statistically robust dataset for commercial analysis.
Spatial Triangulation and Zone Accuracy
To provide actionable data for specific retail zones - rather than just venue-wide aggregate data - the network must accurately locate devices within a defined area. This requires trilateration: the process of using RSSI readings from at least three access points simultaneously to calculate a device's location on a floor plan. The accuracy of this process is directly proportional to AP density.
A standard coverage-model deployment for location analytics (one AP per 1,000-1,500 sq ft) is insufficient. A location-optimised deployment typically requires one AP per 500-700 sq ft in key tracking zones, with careful attention paid to transmit power settings to ensure cell sizes are small enough to provide meaningful spatial resolution.
| Deployment Model | AP Density | Primary Use Case | Location Accuracy |
|---|---|---|---|
| Coverage | 1 per 1,500 sq ft | Basic Connectivity | None |
| Capacity | 1 per 800 sq ft | High-throughput Events | Low |
| Location Analytics | 1 per 500 sq ft | Footfall and Dwell Tracking | High (±3-5m) |
Infrastructure Agnosticism and Integration Architecture
Modern analytics platforms, including Purple, operate as an overlay on existing enterprise wireless infrastructure. They integrate with existing Cisco, Aruba, Meraki, and Ruckus Wireless LAN Controllers (WLCs) via standard protocols. WLCs forward presence data - typically via syslog, SNMP traps, or vendor-specific APIs - to the cloud analytics engine. This eliminates the need for immediate hardware replacement, allowing venues to leverage their existing capital investments and add an analytics layer progressively.
For venues considering upgrading to a leased line to support the increased data throughput from high-density analytics deployments, a dedicated symmetric connection is highly recommended to ensure consistent latency for real-time dashboard updates.

Got questions about your specific setup?
Our team works with venue operators, IT managers, and network engineers across 80,000 venues. Book a 20-minute call and we will show you how others like you solved it.
Implementation Guide
Deploying a location-aware wireless network requires meticulous planning across four distinct phases.
Phase 1 - RF Planning and Site Survey: Before installing any hardware, use predictive survey tools like Ekahau Pro or AirMagnet to model the RF environment. Take attenuation from building materials into account - glass atrium roofs, metal retail fixtures and concrete structural columns all create multipath interference that distorts RSSI-based location calculations. Determine the required location accuracy for each zone and work backwards to establish the AP placement grid.
Phase 2 - Hardware Deployment and Configuration: Install APs according to the predictive survey, then conduct an active site survey to validate real-world RSSI readings against the model. Configure Radio Resource Management (RRM) but enforce strict transmit power caps - typically 14-17 dBm - to maintain small cell sizes. Ensure that the guest SSID remains isolated from corporate and POS networks via VLAN segmentation, complying with PCI DSS requirements.
Phase 3 - Analytics Platform Integration: Connect the WLC to the Purple analytics platform. Define geofenced zones within the dashboard that align precisely with individual retail units, common areas, entrance corridors and food court zones. Calibrate floor plans within the platform using known reference points.
Phase 4 - Captive Portal and Consent Configuration: Design a streamlined onboarding flow. Minimise friction - each additional step in the authentication process reduces the attach rate by approximately 15-20%. Integrate CRM and marketing automation platforms via APIs. Ensure that the consent language is explicit, granular and compliant with GDPR Article 7 requirements.
Best Practices
Account for MAC Randomisation: iOS 14+ and Android 10+ devices randomise their MAC addresses by default when probing networks. An analytics platform that does not account for this will report inflated footfall figures - sometimes three to five times the actual visitor count. Ensure your platform uses authenticated session data as the primary metric and applies deduplication algorithms to the probe request dataset.
Prioritise network security: Implement robust network segmentation. Guest traffic must be kept separate from corporate infrastructure. For a comprehensive guide to DNS filtering and network security best practices applicable to multi-tenant venue environments, see Protect Your Network with Strong DNS and Security.
Enforce data governance: Strictly comply with GDPR or applicable local data privacy regulations. Use MAC hashing for unauthenticated tracking, require explicit opt-in consent during Captive Portal authentication, and implement a documented data retention policy. Ensure that data processing agreements are in place with all third-party analytics vendors.
Leverage OpenRoaming for scale: Adopt Passpoint/Hotspot 2.0 to provide seamless, secure connectivity similar to the cellular roaming experience. This removes Captive Portal friction for returning users, increases authenticated data capture rates, and improves the statistical confidence of your analytics.

Troubleshooting and Risk Mitigation
Inaccurate location data: The most common cause of this is insufficient AP density or excessive transmit power creating large cell sizes. A device connected to an AP 80 metres away will be shown in the incorrect zone. Conduct an active site survey, review RSSI heat maps, and reduce Tx power to tighten cell boundaries. Verify that each tracked zone has at least three APs detecting clients.
Low authentication rates (below 30%): A complex or slow Captive Portal process is the main cause. Audit the onboarding flow on a mobile device over a 4G connection (not the venue WiFi). Minimise the number of form fields, offer social login options, and ensure the portal page loads within two seconds. Consider deploying OpenRoaming to completely bypass the portal for returning visitors.
Data Silos: Collecting analytics data that the commercial team cannot access or interpret. Resolve this by configuring automated API integrations, which push weekly footfall and dwell reports directly to property management CRM or BI tools. Schedule a monthly data review with the leasing team to ensure that the captured metrics align with the answers they need in tenant negotiations.
GDPR compliance gaps: Regularly audit consent records stored against authenticated user profiles. Ensure that opt-out requests are processed within the 30-day GDPR window and that data is deleted from all downstream systems, including third-party CRM integrations.
ROI and Business Impact
For commercial teams, the ROI of a correctly deployed WiFi analytics solution is substantial and measurable across three primary value streams.
Lease Negotiations: Property managers move from subjective arguments to data-driven negotiations. By presenting authenticated visitor counts, dwell time distribution, and demographic breakdowns for specific retail zones, the venue can demonstrate the commercial value of each unit with the same rigour as a digital advertising platform. This data supports both premium pricing for high-traffic units and evidence-based rent reviews.
Tenant Retention: Retailers receive localised insights - how many people walked past their store versus how many entered, and how long those who entered stayed. This data helps retailers optimise window displays, staffing schedules, and promotional timing. When a retailer sees that footfall past their unit increased by 18% following a marketing campaign, they have a compelling reason to renew their lease and invest further in the venue.
Operational Efficiency: Flow analytics enables operations teams to optimise cleaning schedules, security patrol routes, and HVAC usage based on real-time and historical occupancy patterns. Through data-driven resource allocation, venues typically report a 10-15% reduction in operational costs within the first year of deployment.
Similar data-driven approaches are proving highly effective in other high-footfall venue categories. Zoo and Theme Park WiFi: High-Footfall Venue Connectivity Guide covers similar spatial analytics challenges in leisure environments, and the same architectural principles apply across all large-scale physical venues.
Key Definitions
RSSI (Received Signal Strength Indicator)
A measurement of the power level present in a received radio signal, expressed in dBm (negative values, where -30 dBm is excellent and -90 dBm is very weak).
The primary input to the location analytics engine. Multiple APs report their RSSI reading for the same client device, and the engine uses these values to triangulate the device's position on the floor plan.
Trilateration
A method of determining the position of a point by measuring its distance from three or more known reference points, using the geometry of intersecting circles.
Requires a minimum of three access points to simultaneously detect a client device to calculate its position. This is why AP density is the critical variable for location analytics accuracy.
MAC Randomisation
A privacy feature in modern mobile operating systems (iOS 14+, Android 10+) that causes a device to broadcast a randomly generated MAC address when probing for WiFi networks, rather than its true hardware address.
The primary technical challenge for presence-based analytics. Platforms must use authenticated session data as the primary metric and apply deduplication algorithms to avoid massively inflating visitor counts.
OpenRoaming (Hotspot 2.0 / Passpoint)
A WiFi roaming federation standard that allows a device to automatically and securely connect to a participating network using a pre-installed profile, without requiring a captive portal interaction.
Purple acts as a free identity provider for OpenRoaming under the Connect licence. Deploying OpenRoaming significantly increases authenticated session volumes by removing the captive portal friction for returning users.
Dwell Time
The duration for which a detected device remains within a specifically defined geofenced zone, measured from first detection to last detection within that zone.
A critical commercial metric for retailers. High dwell time indicates engagement with a storefront or retail environment. Low dwell time in a zone with high footfall suggests a conversion problem rather than a traffic problem.
Probe Request
An IEEE 802.11 management frame broadcast by a client device to discover available wireless networks in its vicinity.
The mechanism used to capture unauthenticated presence data for total footfall counts, including visitors who never connect to the network. Subject to MAC randomisation on modern devices.
Captive Portal
A web page that a user of a public-access network is required to interact with before being granted full network access, typically used to present terms of service and collect consent for data processing.
The primary mechanism for capturing first-party demographic data and explicit GDPR-compliant marketing consent. The design and length of the portal flow directly determines the attach rate.
Attach Rate
The percentage of total detected devices (presence analytics) that successfully complete the captive portal authentication process and become authenticated sessions.
The key performance indicator for the quality of your analytics data. A low attach rate means the majority of your footfall data is anonymous and lacks demographic enrichment, limiting its commercial value.
Geofencing
The use of GPS or RSSI-based location data to define a virtual geographic boundary, triggering actions or data capture when a device enters or exits the defined area.
Used within the analytics platform to define specific retail zones, corridors, and entrances, enabling zone-level footfall and dwell time metrics rather than venue-wide aggregates.
Worked Examples
A 150-unit regional shopping centre has a persistently high vacancy rate in its West Wing. The commercial team suspects footfall is lower than in the East Wing but has no data to confirm this. The existing WiFi network provides basic coverage using Cisco Meraki APs but has no analytics integration. The operations director needs data within 60 days to support a rent restructuring proposal.
Step 1: Conduct an active site survey of the West Wing to assess current AP density and RSSI coverage. Identify zones where fewer than three APs can detect a client device simultaneously. Step 2: Add supplementary APs in the West Wing corridors to achieve trilateration coverage. Reduce transmit power on all APs to 15 dBm to tighten cell sizes. Step 3: Enable the Cisco Meraki location analytics API and connect it to the Purple WiFi Analytics platform. Step 4: Define geofenced zones for each vacant unit, the main West Wing corridor, and the equivalent East Wing zones for comparison. Step 5: Collect 30 days of baseline data. Export a comparative report showing unique device counts, dwell time averages, and peak hour distributions for both wings. Step 6: Present the data to prospective tenants, demonstrating the actual footfall differential and the commercial opportunity for the right retail concept.
A premium fashion retailer is disputing their lease renewal at a major city-centre shopping centre. They claim that footfall past their unit has declined significantly since a new secondary entrance was opened on the opposite side of the mall 18 months ago, and they are demanding a 25% rent reduction. The property manager needs to verify or refute this claim using objective data.
Step 1: Access the WiFi analytics platform's historical data archive. Navigate to the zone corresponding to the retailer's storefront. Step 2: Pull the monthly unique device count and dwell time data for the 12 months prior to the new entrance opening and the 12 months following. Step 3: Analyse the pathing data to determine whether the primary traffic flow through the mall shifted after the new entrance opened. Identify which zones gained and which lost footfall. Step 4: Cross-reference the retailer's zone data against the overall mall footfall trend to determine whether any decline is specific to their location or part of a broader pattern. Step 5: Export a formal data report with timestamped, anonymised metrics. Present this as the objective evidence base for the lease negotiation.
Practice Questions
Q1. A venue operator wants to track visitor movement through a 200-unit shopping centre but has budget constraints that limit AP deployment to the main corridors only, with APs spaced 50 metres apart in a linear arrangement. The IT director claims this will be sufficient for zone-level analytics. Evaluate this claim and identify the primary technical limitation.
Hint: Consider the minimum number of access points required for spatial triangulation and the relationship between cell size and location accuracy.
View model answer
The IT director's claim is incorrect. Accurate zone-level location tracking requires trilateration - a minimum of three access points simultaneously detecting the same client device. A linear corridor deployment with 50-metre spacing means that in most locations, a device will only be within range of one or two APs, making trilateration impossible. The result will be a binary 'in corridor / not in corridor' detection rather than zone-level accuracy. The correct approach is a grid-based deployment with APs at 15-20 metre spacing in key tracking zones, with transmit power reduced to 14-17 dBm to create small, accurate cells.
Q2. The marketing team reports that the WiFi analytics platform is showing 450,000 unique visitors for the month of March. The physical door counters at all entrances recorded a combined total of 95,000 entries for the same period. The discrepancy is causing the commercial team to question the reliability of all WiFi data. What is the most likely technical cause, and how would you resolve it?
Hint: Consider how modern mobile operating systems handle WiFi network discovery and what this means for MAC-address-based counting.
View model answer
The most likely cause is MAC randomisation. iOS 14+ and Android 10+ devices broadcast randomised MAC addresses when probing for networks. If the analytics platform is counting each unique MAC address as a unique visitor, a single device that moves through the venue over several hours - generating new randomised MACs each time it probes - will be counted multiple times. The resolution is threefold: (1) switch the primary footfall metric to authenticated session counts rather than probe-based device counts; (2) ensure the platform applies a deduplication algorithm to filter randomised MACs; and (3) calibrate the platform's footfall multiplier against the physical door counter data to establish a validated conversion ratio.
Q3. A new anchor tenant - a large department store - is negotiating their lease and demands that the property manager provide monthly reports showing the number of unique visitors who entered the shopping centre specifically via the entrance adjacent to their unit, the average time those visitors spent in the wing containing their store, and the demographic breakdown of those visitors. The current WiFi network provides venue-wide footfall data only. What infrastructure and platform changes are required to meet this requirement?
Hint: Think about the difference between venue-wide aggregate data and zone-specific, entrance-attributed data, and what the analytics platform configuration needs to support.
View model answer
Meeting this requirement involves three changes. First, the AP deployment in the wing adjacent to the anchor tenant must be upgraded to a location-analytics density (one AP per 500 sq ft) to support trilateration and accurate zone assignment. Second, within the analytics platform, specific geofenced zones must be defined for: (a) the entrance corridor adjacent to the anchor tenant, (b) the retail wing containing the anchor tenant, and (c) individual sub-zones within that wing. Third, the Captive Portal must be configured to capture demographic data (age range, gender, postcode) with explicit GDPR consent, and the platform must be configured to attribute authenticated sessions to the entry zone where the device was first detected. The resulting reports will show entrance-attributed unique visitors, wing dwell time, and demographic breakdowns - all exportable via API to the tenant's own reporting tools.
Continue reading in this series
Measuring the Business ROI of Guest WiFi and Location Analytics
This technical reference shows IT and venue teams how to measure the ROI of guest WiFi with a defensible chain from network health and consented data to validated operational or commercial outcomes. It separates measurable evidence from assumptions, maps Purple Connect, Capture and Engage to the right measurement layer, and gives planning scenarios for hotels, retail estates and event venues.
Privacy by Design: Anonymising WiFi Data for GDPR Compliance
This authoritative guide details the technical architecture and implementation strategies for anonymising WiFi data to ensure GDPR compliance. It provides IT leaders and network architects with actionable frameworks for balancing robust venue analytics with strict data privacy requirements.
Heatmapping vs Presence Analytics: Technical Differences
This authoritative technical guide details the critical architectural and operational differences between WiFi heatmapping and presence analytics for enterprise venue operators. It provides IT leaders, network architects, and operations directors with actionable deployment frameworks, real-world implementation scenarios, and vendor-neutral best practices for extracting maximum ROI from their existing wireless infrastructure.
Got questions about your specific setup?
Our team works with venue operators, IT managers, and network engineers across 80,000 venues. Book a 20-minute call and we will show you how others like you solved it.