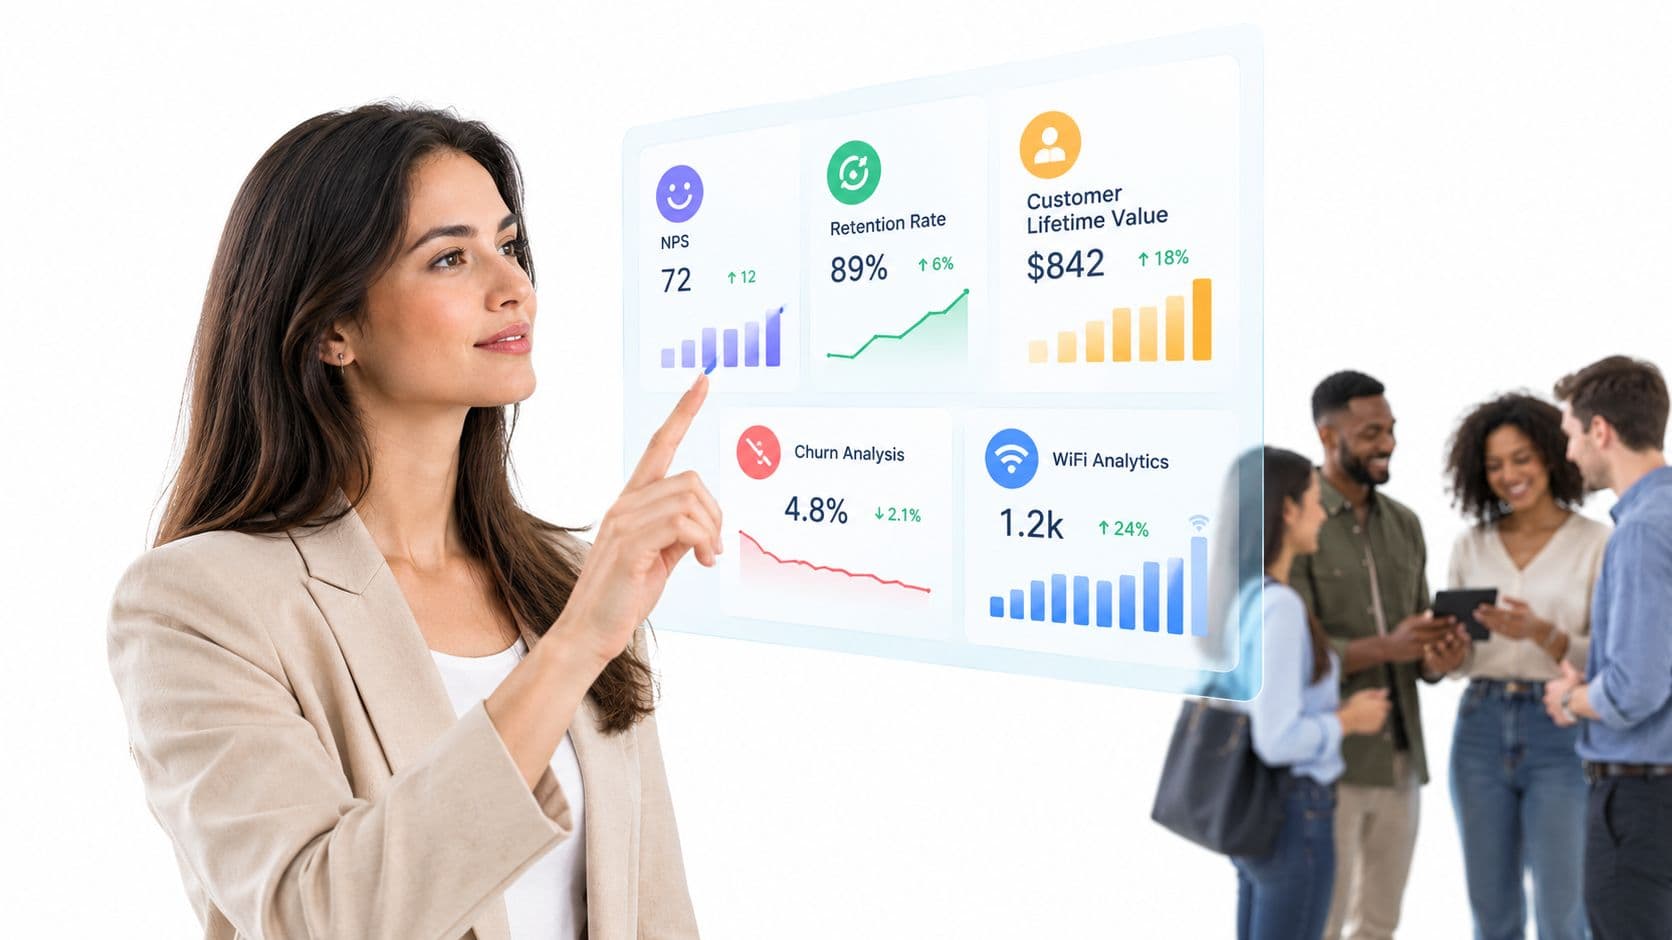
Repeat visits, loyalty program enrollment and satisfaction scores are often treated as proof of customer loyalty. They aren't. Each metric captures a useful signal, but none can tell you whether a guest returned because they preferred your brand, because your venue was nearby, because a discount changed their behavior, or because they had no practical alternative.
A reliable answer to how to measure customer loyalty combines three forms of evidence: what customers say, what they do, and how much effort they make to choose you again. For hospitality and retail operators, that means joining survey responses and CRM records with physical access data, WiFi authentication and behavioral cohorts. The result is a more honest view of retention, one that distinguishes temporary engagement from a relationship strong enough to survive inconvenience, competition and changing circumstances.
The Convenience Trap in Loyalty Measurement
Repeat footfall looks persuasive on a dashboard. A venue sees the same device or customer identifier returning, purchase volume rises, and the loyalty report labels the relationship healthy. That conclusion is premature. A repeat visit proves recurrence, not preference.
Customers return for practical reasons all the time. A hotel may be closest to a workplace, a shopping center may be the only convenient option in a local area, and a café may sit on a commuter's daily route. Habit, price, parking lot access, opening hours and a lack of alternatives can all create repeat behavior without any meaningful emotional attachment to the brand.
US evidence makes the distinction difficult to ignore. In a February 2024 survey of 1,000 US adults, 2 in 5 respondents said they repeat-purchase because of brand preference, but only 6% said they would go out of their way to buy the brand again (Intuit, Mailchimp and Canvas8 US Shopping Mindset). The gap shows why ordinary repeat purchasing can overstate loyalty.
Separate recurrence from deliberate choice
The first practical change is to stop placing every returning customer in the same category. A venue analytics team should distinguish between:
- Passive recurrence, where the customer returns but shows no evidence of deliberate preference.
- Reward-driven recurrence, where visits rise after a discount, points offer or promotional campaign.
- Unprompted retention, where the customer returns without a tracked incentive.
- Active loyalty, where the customer returns, expresses preference, recommends the venue or chooses it despite alternatives.
This classification needs customer-level history, not just aggregate footfall. Compare authenticated visits with campaign exposure, visit intervals, purchase records and stated switching intent. A guest who returns three times after a voucher has behaved differently from one who returns three times without an incentive and says they'd choose the same venue over a competitor.
Practical rule: Treat repeat behavior as evidence to investigate, not as a loyalty verdict.
Physical access logs are especially useful because they reveal behavior that surveys miss. A respondent may say they intend to return, yet never appear again. Another customer may give a neutral survey response but continue visiting regularly. Neither signal should automatically override the other. The useful question is whether stated preference predicts subsequent behavior within a defined cohort.
Test what happens when convenience disappears
A strong loyalty framework introduces friction into the analysis, not into the customer experience. Examine whether customers return when the usual reason for convenience changes, such as a different time of day, a new venue nearby, the end of a promotion or a change in location. You don't need to manipulate every condition experimentally. Cohort comparisons can reveal whether behavior falls away as soon as an incentive expires.
Measure return intention, switching intent and willingness to recommend alongside repeat visits. Ask why a customer chose the venue again, rather than assuming the answer from transaction volume. This is how operators avoid celebrating hollow engagement and identify customers who may appear retained while becoming vulnerable to churn.
Selecting KPIs That Prove Active Retention
A loyalty dashboard should begin with the commercial outcome the operator wants to protect. For a hotel, that may be repeat stays and direct bookings. For a shopping center, it may be returning visitors, tenant engagement or increased visit frequency. For a residential operator, renewal and continued use of shared amenities may matter more than transaction value.
Program enrollment is an input metric. It tells you that a customer accepted an invitation, not that they remained engaged. A 2022 survey of 1,266 US consumers found that 71.5% defined loyalty as tending to buy from the same brand, while 46% or more had joined a brand loyalty program to demonstrate loyalty (Yotpo, The State of US Customer Loyalty and Retention). Enrollment matters, but active use, retention and advocacy provide stronger commercial evidence.
Build a scorecard around behavior
Track the following measures together, with each customer or household assigned to a consistent cohort:
- Customer retention rate: The proportion of customers active at the end of a period who were also active at its start.
- Churn: Customers who stop purchasing, visiting, renewing, or engaging within the organization's defined inactivity window.
- Repeat-visit rate: The share of identified visitors who return after their first authenticated visit.
- Time between visits: The interval between visits, which can show whether engagement is strengthening, weakening, or remaining stable.
- Active-member rate: The proportion of enrolled members who perform a meaningful action, such as visiting, purchasing, or redeeming a benefit.
- Voluntary advocacy: Recommendations, referrals, or other actions taken without a direct reward.
- Average spend and purchase frequency: Useful commercial indicators, but only when interpreted alongside retention and incentive exposure.
NPS adds a standardized measure of recommendation. Ask customers to rate their likelihood of recommending the organization on a 0 - 10 scale. Promoters score 9 - 10, passives score 7 - 8 and detractors score 0 - 6. NPS equals the percentage of promoters minus the percentage of detractors. Report it by venue, cohort and experience event, then compare it with what those customers do afterward.
Don't let incentives hide churn
A promotion can improve visits while weakening the quality of the relationship. Keep an incentive flag in the customer record and compare behavior during the campaign with behavior after it ends. A customer who returns only while rewarded needs a different retention intervention from one who keeps visiting without an offer.
Satisfaction measures still have a role, particularly after a specific interaction. They explain experience quality at a moment in time, while retention demonstrates what happened later. Operators looking at workplace hospitality or shared amenity experiences may also find CSAT and NPS for break rooms useful when designing short, context-specific feedback programs.
The scorecard should show movement through the relationship, from sign-up to first visit, repeat visit, renewal and recommendation. A rising membership count with falling active-member rate is a warning. So is a strong NPS that fails to predict returning behavior. The best KPI is not the most flattering one. It's the measure that helps the team identify who is retained, who is drifting and what action can change the outcome.
Capturing First-Party Data and Survey Feedback
Behavioral loyalty measurement depends on identity resolution. If the same guest appears as an anonymous device on one visit, a loyalty member at checkout and a different email address in a survey, the business can't build a dependable journey. It will count activity without knowing whether one person returned, several people visited, or a household shared an identifier.
Start with a clear purpose for each data field. Capture an authenticated identity at a relevant touchpoint, connect it to the venue or property, and record the visit event without adding unnecessary steps to the customer journey. Passwordless WiFi authentication and OpenRoaming can support recognition across return visits, while CRM and point-of-sale integrations add purchase context where consent and lawful use are in place.
Use a short, timely feedback loop
A survey sent long after a visit asks customers to reconstruct an experience they may barely remember. Trigger a short micro-survey after a venue visit, onboarding event, support interaction or relevant transaction. Keep the questions tied to the moment:
- How likely are you to recommend the venue?
- How likely are you to return?
- How easy was the experience?
- What most influenced your score?
- Is there anything the team should fix?
The survey response should join to behavioral history through a controlled identifier, such as a hashed customer ID. Don't give every team unrestricted access to raw identity data. Separate the operational need to act on feedback from the analytical need to understand cohorts, and document retention, consent and deletion rules.
Join the data at the point of use
A customer who rates a hotel highly should be visible in the retention analysis, but the score shouldn't become a permanent label detached from context. Store the survey event with its venue, date, experience type, acquisition channel, and relevant visit history. Then measure what followed. Did the guest return, renew, recommend the venue, or disappear?
ACSI offers a useful model for designing the survey layer. It covers 13 sectors and 26 customer-experience metrics, combining measures such as NPS, customer effort, trust and right-first-time performance (Zendesk's overview of NPS and US customer experience measurement). Operators don't need to copy every measure. They should borrow the principle of combining recommendation with effort, trust and delivery quality.
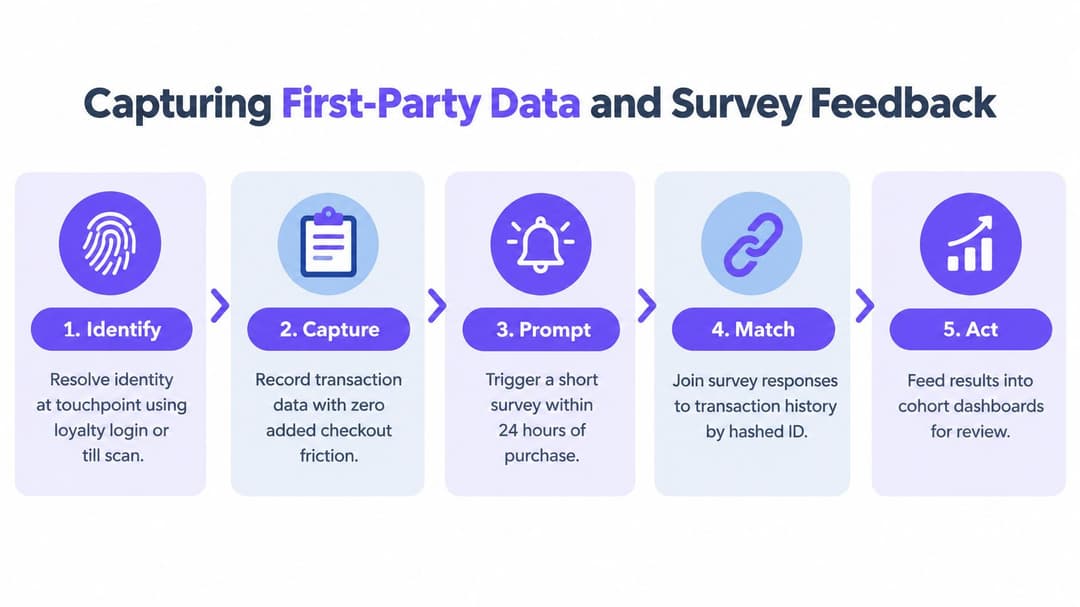
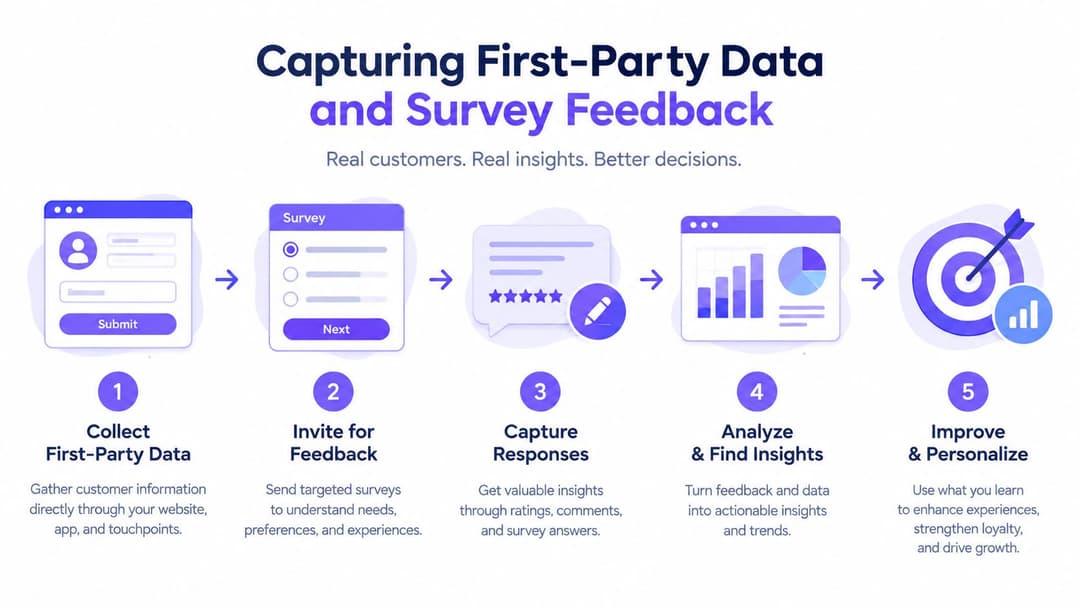
A practical data pipeline looks like this:
- Identify: Resolve the customer at the WiFi, loyalty or transaction touchpoint.
- Capture: Record visit, dwell, purchase or renewal events with the correct cohort attributes.
- Prompt: Send a brief survey while the experience is still recent.
- Match: Join feedback to observed behavior through a governed identifier.
- Act: Route the result to the relevant CRM, service or venue team.
For teams evaluating first-party data through guest WiFi, the important test isn't how many contacts the network can collect. It's whether authenticated access produces a consistent, permissioned identity that can be connected to repeat behavior and useful feedback. Data volume without identity quality creates a larger version of the same measurement problem.
Triangulating Intent With Observed Behavior
No single loyalty measure deserves to stand alone. Survey responses capture attitude, access logs capture presence, CRM records capture commercial activity and customer service data captures friction. A triangulated index brings those signals together without pretending they mean the same thing.
Begin by defining cohorts that reflect how customers use the organization. Hotel guests, retail visitors, healthcare users, tenants and staff may all interact with the same physical network, but their loyalty events are different. A hotel guest may renew through a repeat booking, while a tenant may demonstrate retention through continued occupancy and regular amenity use.
Create a behavior-linked cohort table
For every respondent, connect the survey event to subsequent outcomes across 90, 180 and 365 days. The table should contain:
- Stated likelihood to return and recommend.
- Observed repeat visits and time between visits.
- Purchase, renewal or referral activity where available.
- Exposure to campaigns, discounts and service incidents.
- Tenure, acquisition channel, geography and venue type.
- Seasonality and the customer's normal visit frequency.
This structure lets the team ask a more valuable question than “What was our NPS?” It asks whether customers who gave a particular score returned more often, renewed at a higher rate, or referred someone else. If promoters and detractors behave identically, the score may be measuring a pleasant moment rather than durable loyalty.
The analysis doesn't need to begin with a complex model. Cross-tabulate survey categories against later behavior, review the differences by cohort and identify obvious confounding factors. For larger datasets, logistic regression can test whether a survey response predicts a defined retention event. Survival analysis can examine time to churn while controlling for tenure, customer value, seasonality and visit frequency.
The index is useful only if it predicts an outcome the business can act on.
A composite score should therefore remain explainable. Combine stated intent, demonstrated behavior and customer effort, but keep the components visible. A high score might require a return visit, a positive recommendation response and evidence of deliberate choice. A customer with high satisfaction but no subsequent activity should not receive the same classification as a customer who returns regularly and recommends the venue.
Investigate contradictions instead of averaging them away
Contradictions are often the most useful finding. A customer may express strong intent but stop visiting because the venue became difficult to access. Another may return frequently but give poor feedback because the location is convenient and the experience is deteriorating. These groups need different actions, and a single average score would conceal them.
UKCSI's methodology reinforces this broader view by combining experience, complaint handling, customer ethos, emotional connection and ethics into a 0–100 Customer Satisfaction Index, rather than treating satisfaction as loyalty by itself (Royal Society of Arts customer satisfaction methodology). The lesson for venue operators is straightforward: measure the relationship across several dimensions, then validate each dimension against observed retention.
Analytics from guest WiFi visit data can contribute the physical behavior layer, particularly where a business needs to understand returning visitors, visit intervals and cohort movement. It shouldn't replace transaction or survey data. Its value comes from joining a reliable presence signal to the rest of the customer journey.
Establishing Baselines and Benchmarking Cohorts
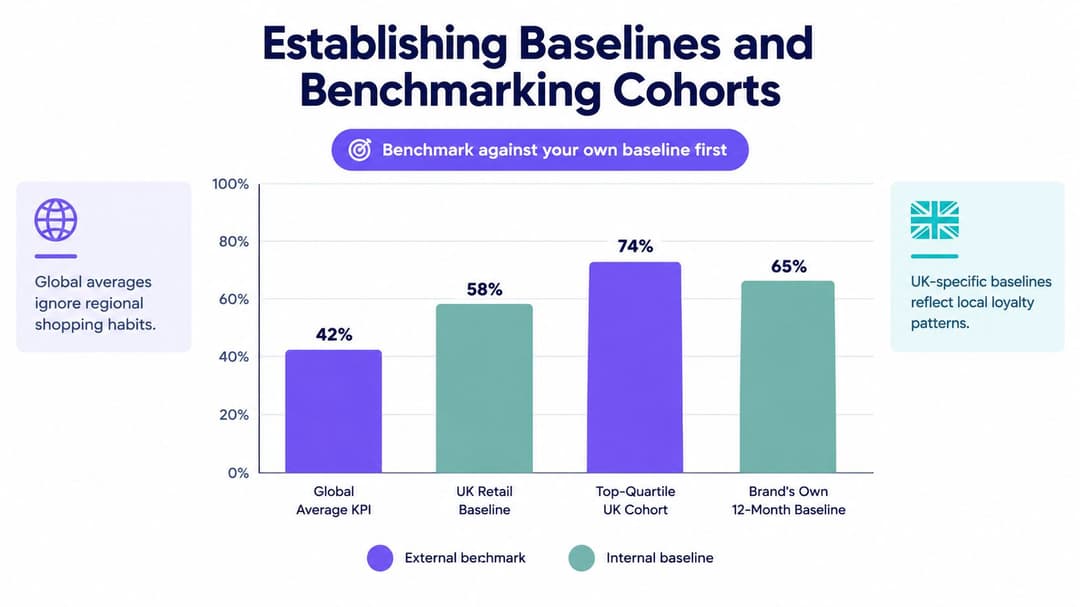
A generic loyalty target can create false confidence. A headline score may look strong against an international benchmark while hiding weak retention in one venue, acquisition channel, or customer segment. US operators should establish their own baseline first, then use external comparisons as context rather than as a target copied without examination.
Build a longitudinal view of each cohort. Track new customers, returning customers, dormant customers and reactivated customers separately. Compare hotel guests with retail visitors, tenants with staff, and members acquired through different channels. A single organization-wide retention rate can hide a serious problem in one location while a high-performing site lifts the average.
Use benchmarks with discipline
External benchmarks help answer whether a result is unusual, but internal baselines answer whether the organization is improving. Record the measurement definition, observation period, cohort rules, and response volume every time. Without that consistency, a change in the dashboard may reflect a change in sampling rather than a change in loyalty.
Survey results also need uncertainty attached to them. Report response counts and confidence intervals alongside the headline score. Treat response rates below 15% as directional, because non-response can overrepresent highly enthusiastic or dissatisfied customers. A small group of respondents shouldn't determine a major operational decision without corroboration from access, transaction or service data.
Compare cohorts across the dimensions that change the customer experience:
- Venue type: A leisure site and a commuter cafe have different natural visit patterns.
- Tenure: New customers may need onboarding, while long-standing customers may be vulnerable to service decline.
- Acquisition channel: Paid, partner, and organic visitors can show different retention behavior.
- Geography: Local convenience and competitive alternatives affect deliberate choice.
- Experience event: A support interaction, visit, or complaint may alter the next action.
The case for separating frequency from retention is supported by loyalty activity data. 66% of brands report increased purchase frequency from loyalty activity, yet only 21% report churn reduction (Collinson Loyalty Landscape 2025). More visits can therefore coexist with weak underlying attachment. Track dormant customer reactivation, incentive-free frequency and post campaign retention rather than accepting increased activity as proof.
Establish a US-specific reference point
US scoring norms may differ from other markets, so don't import a global NPS target and assume it predicts local retention. Use an internal 12-month baseline, compare like-for-like cohorts, and test whether changes in the score lead to changes in repeat usage. For operators refining their smaller-format retention reporting, a guide to retention for coffee shops can provide a useful operational perspective, provided its measures are adapted to the venue's own customer cycle.
The most credible benchmark is the one that helps a manager decide what to do next. If a venue's score improves but its return interval lengthens, the team needs to investigate. If NPS remains flat while unprompted repeat visits rise, the organization may be delivering dependable utility without creating strong advocacy. Both findings are actionable when the cohort design is sound.
Operationalizing Insights Across Physical and Digital Channels
Measurement matters only when it changes the next customer experience. A detractor who receives a generic newsletter has not received a loyalty intervention. A returning guest recognized at the venue, offered relevant service recovery and tracked afterward has entered a measurable improvement loop.
Assign each loyalty segment a specific workflow. A first-time visitor gets orientation. A dormant regular gets a service-focused reactivation prompt rather than a blanket discount. A customer reporting high effort enters an operational queue, while a willing advocate can be invited to refer others. Measure whether each assignment changes subsequent visits, response behavior or retention.
Physical access data makes these workflows more precise. Authenticated venue visits, WiFi logins and visit intervals can connect a known customer to observed behavior, while CRM records and survey responses explain intent. Use guest WiFi integrations to support that technical connection, then validate whether the resulting cohort behaves differently from customers who received no intervention.
Cross-channel consistency matters because customers judge the relationship as a whole. 74% of US consumers say online and in-store consistency matters, while 69% value mobile access, yet only 55% feel loyalty emails are personalized (Home of Direct Commerce coverage of US loyalty expectations). An organization that recognizes a guest online but treats them as unknown at the venue creates friction when loyalty should feel tangible.
Put privacy into the operating model
Identity-based measurement requires a defined purpose, lawful basis, transparent notice, and suitable retention controls under CCPA/CPRA. Make consent status visible to systems that trigger campaigns, and give customers a clear opt-out route. Authenticated access does not grant permission to infer information beyond what the customer agreed to share.
Apply the same governed identity rules across network access, CRM workflows and venue operations. A visit can trigger feedback, a service issue can suppress a promotion, and a verified preference can guide the next relevant interaction. Review commercial outcomes alongside opt-out behavior. Short-term activity is not a successful result if personalization damages trust.
For operators connecting physical access data with CRM and marketing automation, Purple offers passwordless guest WiFi authentication, physical visit analytics, survey capabilities, and CRM integrations. To assess its fit, visit Purple and compare the workflow with your existing network and customer systems.