A guest leaves your hotel lounge after a quiet coffee, connects to the WiFi, browses for a while, and checks out without saying anything negative. Your team marks the visit as successful. Weeks later, the guest hasn't returned, their session pattern has disappeared, and no survey response explains why.
That gap is where guest satisfaction metrics become useful. Surveys tell you what guests remember and choose to report. WiFi and CRM data can show how often they return, how long they stay, and whether the digital experience creates friction. Used together, these signals help hospitality and retail teams spot weakening loyalty before a guest announces it in a review.
Why Guest Satisfaction Feels Hard to Measure
A receptionist can read a guest's body language. A restaurant manager can hear a warm thank-you at the door. A retail team can watch shoppers browse, smile, and leave with a purchase. None of those observations proves the guest will return.
The problem is especially clear when nobody complains. A guest may accept a slow check - in, an awkward lounge layout, or unreliable WiFi because raising the issue feels harder than leaving. Staff see a calm interaction. The business sees a visit. The guest changes their behavior.

Reviews show moments, not the whole relationship
Public reviews are valuable because they capture unsolicited reactions, but they're selective. Guests are more likely to post after an unusually good or bad experience than after an ordinary visit. The review may also arrive long after the problem occurred, when the team has lost the chance to recover the relationship.
US hospitality review analysis found 81% positive sentiment across more than 7,200 sites, while positive and negative reviews were both rising and neutral reviews were falling, according to hospitality review analysis. That pattern suggests guests are becoming more willing to express strong reactions, making an average rating less informative on its own.
The same analysis reported that 22% of negative reviews received no response, even though 95% of unhappy customers were willing to return when issues were resolved quickly and efficiently. Those figures point to a practical lesson. Satisfaction measurement must include not only what guests say, but also whether the venue responds and how quickly it closes the loop.
Guesswork hides the cost of friction
A venue can maintain a reasonable satisfaction score while losing repeat visits among a valuable group. A hotel can receive positive comments about its rooms while guests spend less time in shared spaces. A shopping mall can collect favorable feedback while visitors struggle to find a particular store.
Practical rule: Treat a satisfaction score as a signal to investigate, not as a final verdict on the guest experience.
A balanced measurement system combines stated sentiment, observed behavior, and service reliability. That combination gives operators a view of both the guest's opinion and the choices that follow it.
What Guest Satisfaction Metrics Really Tell You
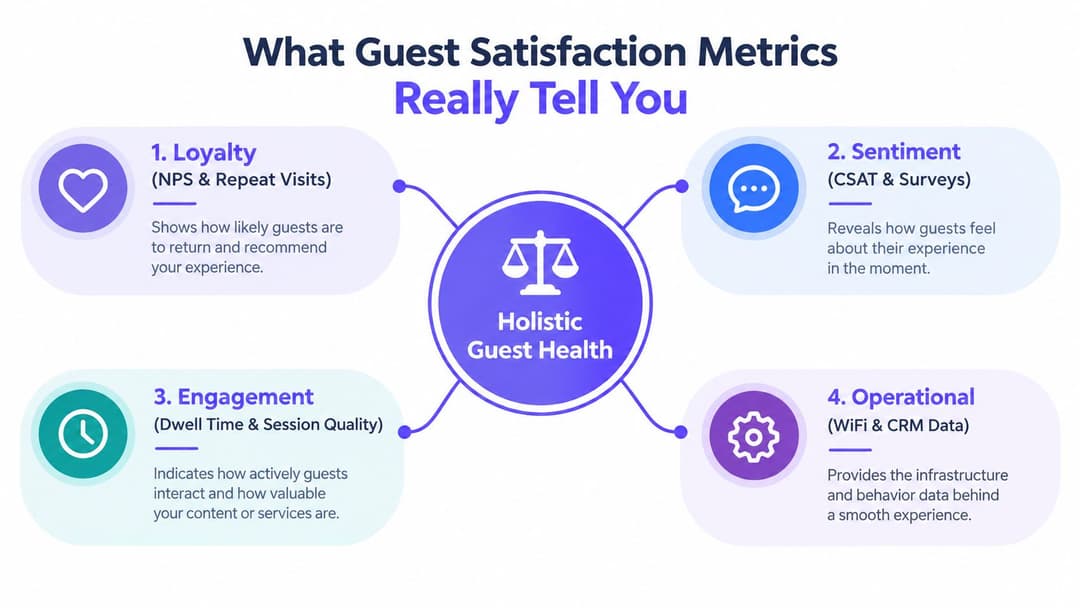
A guest leaves a hotel after a slow check-in, returns less often, and spends less time using the lobby WiFi. No survey is required to spot the change. Satisfaction can appear in behavior before a guest describes it in words.
A useful measurement system works like a health check. One reading cannot explain a patient's condition, and one score cannot explain a guest relationship. Surveys show stated feeling, visit frequency shows whether the relationship continues, dwell time signals engagement with a space, and service reliability shows whether needs are resolved without extra effort.
Three lenses create a clearer picture
Stated sentiment includes NPS, CSAT, open - text comments, and review themes. These measures answer, “How did the guest feel?” and “Would they recommend the venue?” They provide direct feedback, though response bias and survey timing can change the result.
Observed behavior includes repeat visits, dwell time, WiFi session quality, and engagement with digital touchpoints. These signals show what guests did during or after an experience. CRM records can reveal whether visits continue, while WiFi data can show session drops, weak connectivity, or sustained engagement. Behavior still needs context. A short session may reflect dissatisfaction, or just a quick task.
Service reliability covers first-contact resolution, complaint response, and whether a need was handled without follow-up friction. Industry benchmarks show 87.7% of leisure and hospitality customers were rated “right first time”, making it a useful operational proxy because it indicates whether the initial experience resolved the need.
Read relationships between metrics
One number rarely identifies the cause. A long WiFi session might indicate engagement, or difficulty completing an online task. A shorter dwell time might signal frustration, or a guest who arrived with one specific purpose.
Look for combinations:
- High CSAT with falling visit frequency: Guests may value individual interactions but have little reason to return.
- Stable NPS with declining session quality: Loyal guests may be tolerating connectivity problems.
- Low right-first-time performance with rising complaints: Process reliability deserves attention before cosmetic changes.
- Long dwell time with low survey sentiment: Guests may be waiting, stuck, or struggling with wayfinding.
Consistent measurement also depends on consistent operating routines, a point reflected in discussions on operator habits. Metrics are clues, not a report card. Connect survey responses, CRM patterns, WiFi behavior, and operational results to understand where the guest journey is working and where friction is changing future behavior.
The Six Guest Satisfaction Metrics That Matter Most
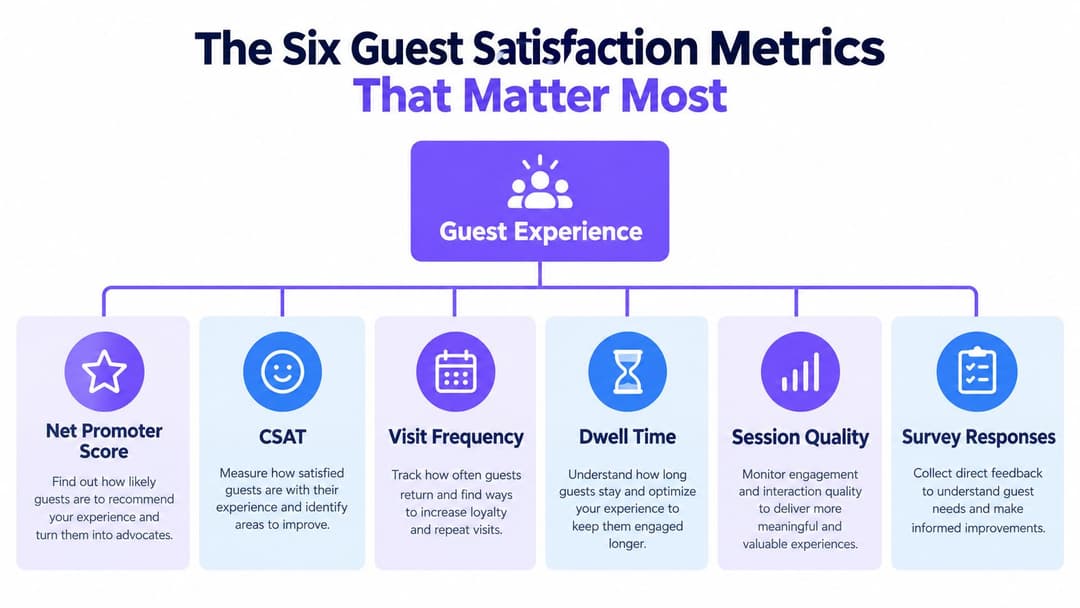
The strongest measurement set combines attitude, behavior, and experience quality. Each metric answers a different question, so the right choice depends on the decision you need to make.
Start with the guest's stated view
Net Promoter Score, or NPS, measures relationship-level loyalty by asking how likely a guest is to recommend the brand. It's useful for tracking broad brand health, but it can be influenced by factors outside one visit.
Customer Satisfaction Score, or CSAT, captures satisfaction with a specific interaction, such as check-in, a meal, a purchase, or complaint handling. It's more immediate than NPS, though it may not predict whether the guest will return.
Survey responses provide the context around a score. A completed rating tells you how many people engaged with the question. Written comments can reveal whether the cause was cleanliness, value, staff behavior, wayfinding, connectivity, or another touchpoint. A low response volume shouldn't be treated as representative of every guest.
Then observe what guests do
Visit frequency measures whether guests come back. It is one of the clearest behavioral loyalty signals, particularly when you compare similar guest groups over time. It doesn't explain why someone stopped visiting, so pair it with surveys or targeted conversations.
Dwell time shows how long a guest remains in an area or venue. In a hotel, it may reveal use of a lounge, restaurant, or workspace. In retail, it can show whether shoppers engage with a zone. Dwell time needs location and visit-purpose context, because waiting and enjoyment can look similar in raw data.
Session quality covers the digital experience around connectivity, such as whether a guest successfully authenticates, maintains a usable session, and returns to the network. Poor session quality can add silent friction even when staff deliver excellent face - to - face service.
| Metric | What it measures | Typical source | Best for |
|---|---|---|---|
| NPS | Relationship loyalty and recommendation intent | Survey platform | Brand health |
| CSAT | Satisfaction with a specific touchpoint | Post-visit or post-interaction survey | Service diagnostics |
| Visit frequency | Repeat behavior | WiFi and CRM records | Loyalty patterns |
| Dwell time | Time spent in a venue or zone | WiFi location analytics | Space engagement |
| Session quality | Reliability of the connected experience | Network and WiFi analytics | Digital friction |
| Survey responses | Engagement with feedback requests and guest context | Survey and CRM data | Response quality and follow-up |
The useful question isn't “Which metric is best?” It's “Which guest decision or operational problem do we need to understand?”
How to Measure Satisfaction Using WiFi and CRM Data
WiFi becomes a satisfaction data source when it connects a guest interaction to a consistent, consented identity. A shared password can provide access, but it doesn't reliably distinguish one visit from another. Authenticated guest WiFi can connect visits, session details, survey invitations, and CRM records without forcing staff to guess who returned.
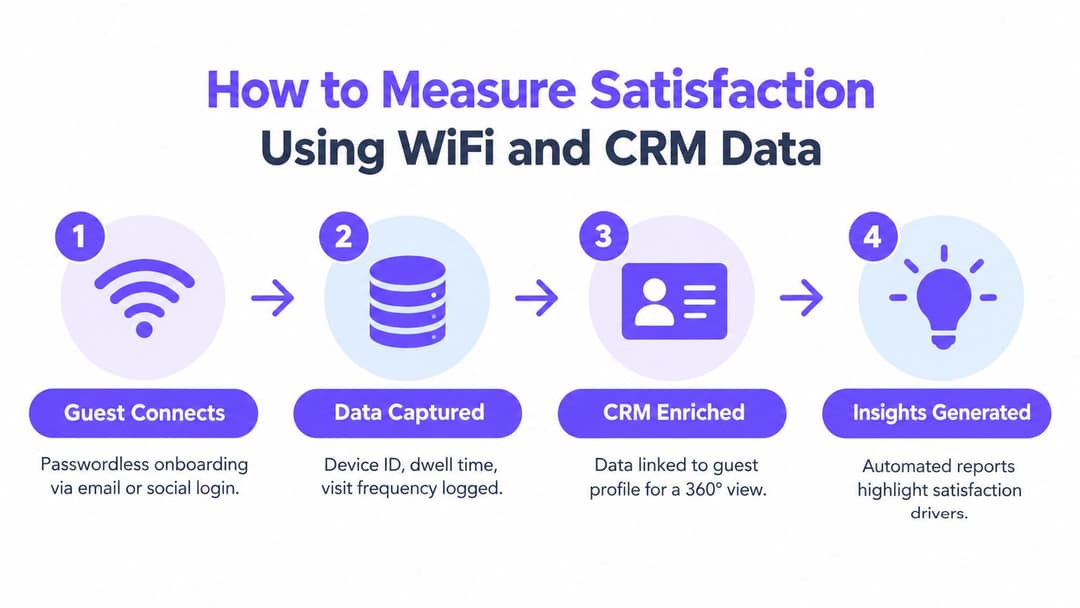
Build the measurement flow
First, make connection simple. Passwordless onboarding, such as email or social login, can create a first - party record while reducing the friction of a shared captive - portal password. The guest should understand what data is collected and why, with consent handled clearly.
Next, define the visit. Set rules for what counts as a visit, how repeat connections are treated, and how inactive devices are handled. Without consistent rules, one guest may appear as several visits while another appears as one extended session.
Then, enrich the CRM profile. Link permitted WiFi activity to a guest record, venue, visit date, dwell pattern, and survey history. The purpose isn't to collect data for its own sake. It's to help teams understand which experiences lead to return behavior and which groups need attention.
Finally, create an action. A dashboard might flag falling return frequency, weak session quality, or a lounge with low engagement. A CRM workflow could trigger a relevant survey after a visit, route a complaint for recovery, or offer a returning guest information that matches their likely reason for visiting.
Keep the data usable and responsible
Start with a baseline for each venue rather than comparing unlike locations. A city hotel, resort, restaurant, and shopping mall attract different visit patterns. Segment results by venue, guest type, visit purpose, and time period before deciding that one group is satisfied and another isn't.
Use Purple's guest WiFi analytics as one example of how network activity can be translated into venue-level insight. A team could combine that information with its CRM, survey tool, point-of-sale data, and review themes, provided the systems and permissions support the connection.
Session quality also matters to travelers who depend on connectivity. Teams designing guest access for international visitors may find guidance on the best eSIM for international travel useful when thinking about the difference between venue WiFi experience and a guest's wider connectivity context.
Privacy should sit inside the design, not at the end. Explain the purpose of authentication, collect only what the team can use, protect identity data, and give guests meaningful choices. Good measurement should improve the experience without making guests feel watched.
Turning Guest Insights Into Action That Improves Loyalty
A metric becomes valuable when it changes a decision. The most effective teams don't chase every movement in a dashboard. They prioritize signals that affect reliability, repeat behavior, and the moments guests remember when deciding whether to return.
Triage the signal before choosing the fix
Use a simple sequence:
- Confirm the movement. Check whether the change appears across comparable visits, venues, or guest groups. A single unusual day may not justify an operational response.
- Locate the friction. Match the signal to a touchpoint. Falling session quality points towards connectivity or authentication. Low CSAT after check-in points towards the arrival process. Falling dwell time in a lounge may point towards layout, noise, temperature, or a weak reason to stay.
- Check the human impact. Read comments, review themes, and complaint records. Behavior tells you where to look, while guest language often explains the experience.
- Assign an owner. A metric without a named owner becomes a recurring dashboard item. Give the action to the person who can change the process.
- Measure recovery. Track response rate and recovery time alongside satisfaction. The ACSI's 2026 release found complaint handling remained the weakest service dimension even though all 13 sectors improved year on year, reinforcing the need to manage recovery as an operating process (American Customer Satisfaction Index quality data).
Match the intervention to the pattern
A visit-frequency decline may justify a relevant return invitation, but only after the team checks whether the guest experienced a problem. Personalization works best when it reflects behavior. A guest who regularly uses a hotel workspace needs a different message from one who visits for dining.
A session-quality alert may need a network or authentication fix, not a promotional campaign. A low right-first-time result may call for better training, clearer ownership, or a simpler handoff between departments. Cosmetic changes can help, but they won't compensate for repeated process failure.
Use Purple's guest engagement tools when a behavioral signal supports a relevant, permission-based message. Keep the campaign tied to a clear hypothesis, such as encouraging a return visit or helping guests discover an underused facility.
Decision test: If the team can't explain what it will do differently after seeing a metric, that metric doesn't yet belong on the operational dashboard.
Close the loop with guests who report a problem. Record when the venue responded, what it offered, and whether the guest returned. That turns service recovery from a vague goodwill activity into a measurable part of loyalty management.
Real World Examples of Satisfaction Metrics in Action
A hotel notices that guests connect to WiFi near its lounge but rarely remain there for long. The raw connection count suggests interest, while short dwell time and weak session quality suggest that the space may be uncomfortable or difficult to use. The team checks feedback, improves seating and connectivity, and watches whether lounge engagement changes. The data doesn't prove the cause, but it identifies a place where observation can guide a practical inspection.
A restaurant group sees strong CSAT after meals but uneven visit frequency among weekday guests. Instead of sending the same offer to everyone, the CRM team separates frequent visitors from guests whose visits have slowed. It tests a return invitation that matches the timing and purpose of each group, then compares repeat behavior with survey sentiment. The team learns whether the message creates useful relevance or attracts discount-driven visits.
A shopping mall triggers a short survey after WiFi authentication. Guests report that finding a particular store is difficult, while dwell patterns show repeated movement through the same central areas. The mall improves signs and digital directions, then asks a focused follow-up question after visits. Survey responses provide the complaint, WiFi data helps locate the friction, and the operational team owns the fix.
These examples use the same metrics differently because each venue has a different guest journey. Hospitality teams seeking comparable venue-level applications can also review the Resorts World Birmingham case study, then ask which signals would support their own operational decisions. The right system doesn't produce identical dashboards everywhere. It produces relevant questions for each place.
Building a Guest Satisfaction System That Lasts
A durable system begins with a balanced scorecard, not one headline number. Combine survey sentiment with visit frequency, dwell time, session quality, and service reliability. These signals work like different views of the same guest journey. Review them consistently, then interpret changes by venue, guest type, and visit purpose.
The July 2026 ACSI offers an external reference point. Accommodation and Food Services scored 80.6 out of 100, Travel scored 80.9, and the all-sector ACSI score was 78.3. Accommodation and Food Services rose 0.6 points year on year, while Travel rose 0.4 points, creating a longer-term comparison for service quality rather than a single review snapshot (ACSI release). Brand benchmarks add context. The 2026 YouGov US hotel rankings placed Hampton by Hilton at 74.4, followed by InterContinental Hotels & Resorts at 67.1, Courtyard by Marriott at 65.7, DoubleTree by Hilton at 64.9, and Marriott at 61.5 (YouGov US hotel rankings).
Start with one venue and a small group of connected signals. Define data rules, obtain consent, assign owners, and record the action taken after each meaningful change. A drop in session quality or visit frequency can prompt investigation before a guest submits a survey. Later, connect operational improvements with repeat behavior and personalized journeys, so leaders can explain how satisfaction supports loyalty and commercial outcomes.
The same method suits hotels, restaurants, and cruise ships. Guests express satisfaction differently, but operators still need to connect what people say, what they do, and how reliably teams deliver.
Purple connects authenticated guest WiFi with analytics, CRM integrations, engagement tools, and survey workflows. Visit Purple to see how visit frequency, dwell time, session quality, and guest sentiment can guide loyalty actions.