Mean time to innocence: how to prove it's not the WiFi
Mean time to innocence (MTTI) is the critical metric defining how long IT teams spend proving a network issue is not their fault. This guide details a five-step observability methodology to eliminate the blame game in multi-tenant environments, replacing finger-pointing with shared evidence to drive down mean time to resolution (MTTR).
Listen to this guide
View podcast transcript
📚 Part of our core series: Multi-tenant WiFi: the complete guide →
Executive Summary
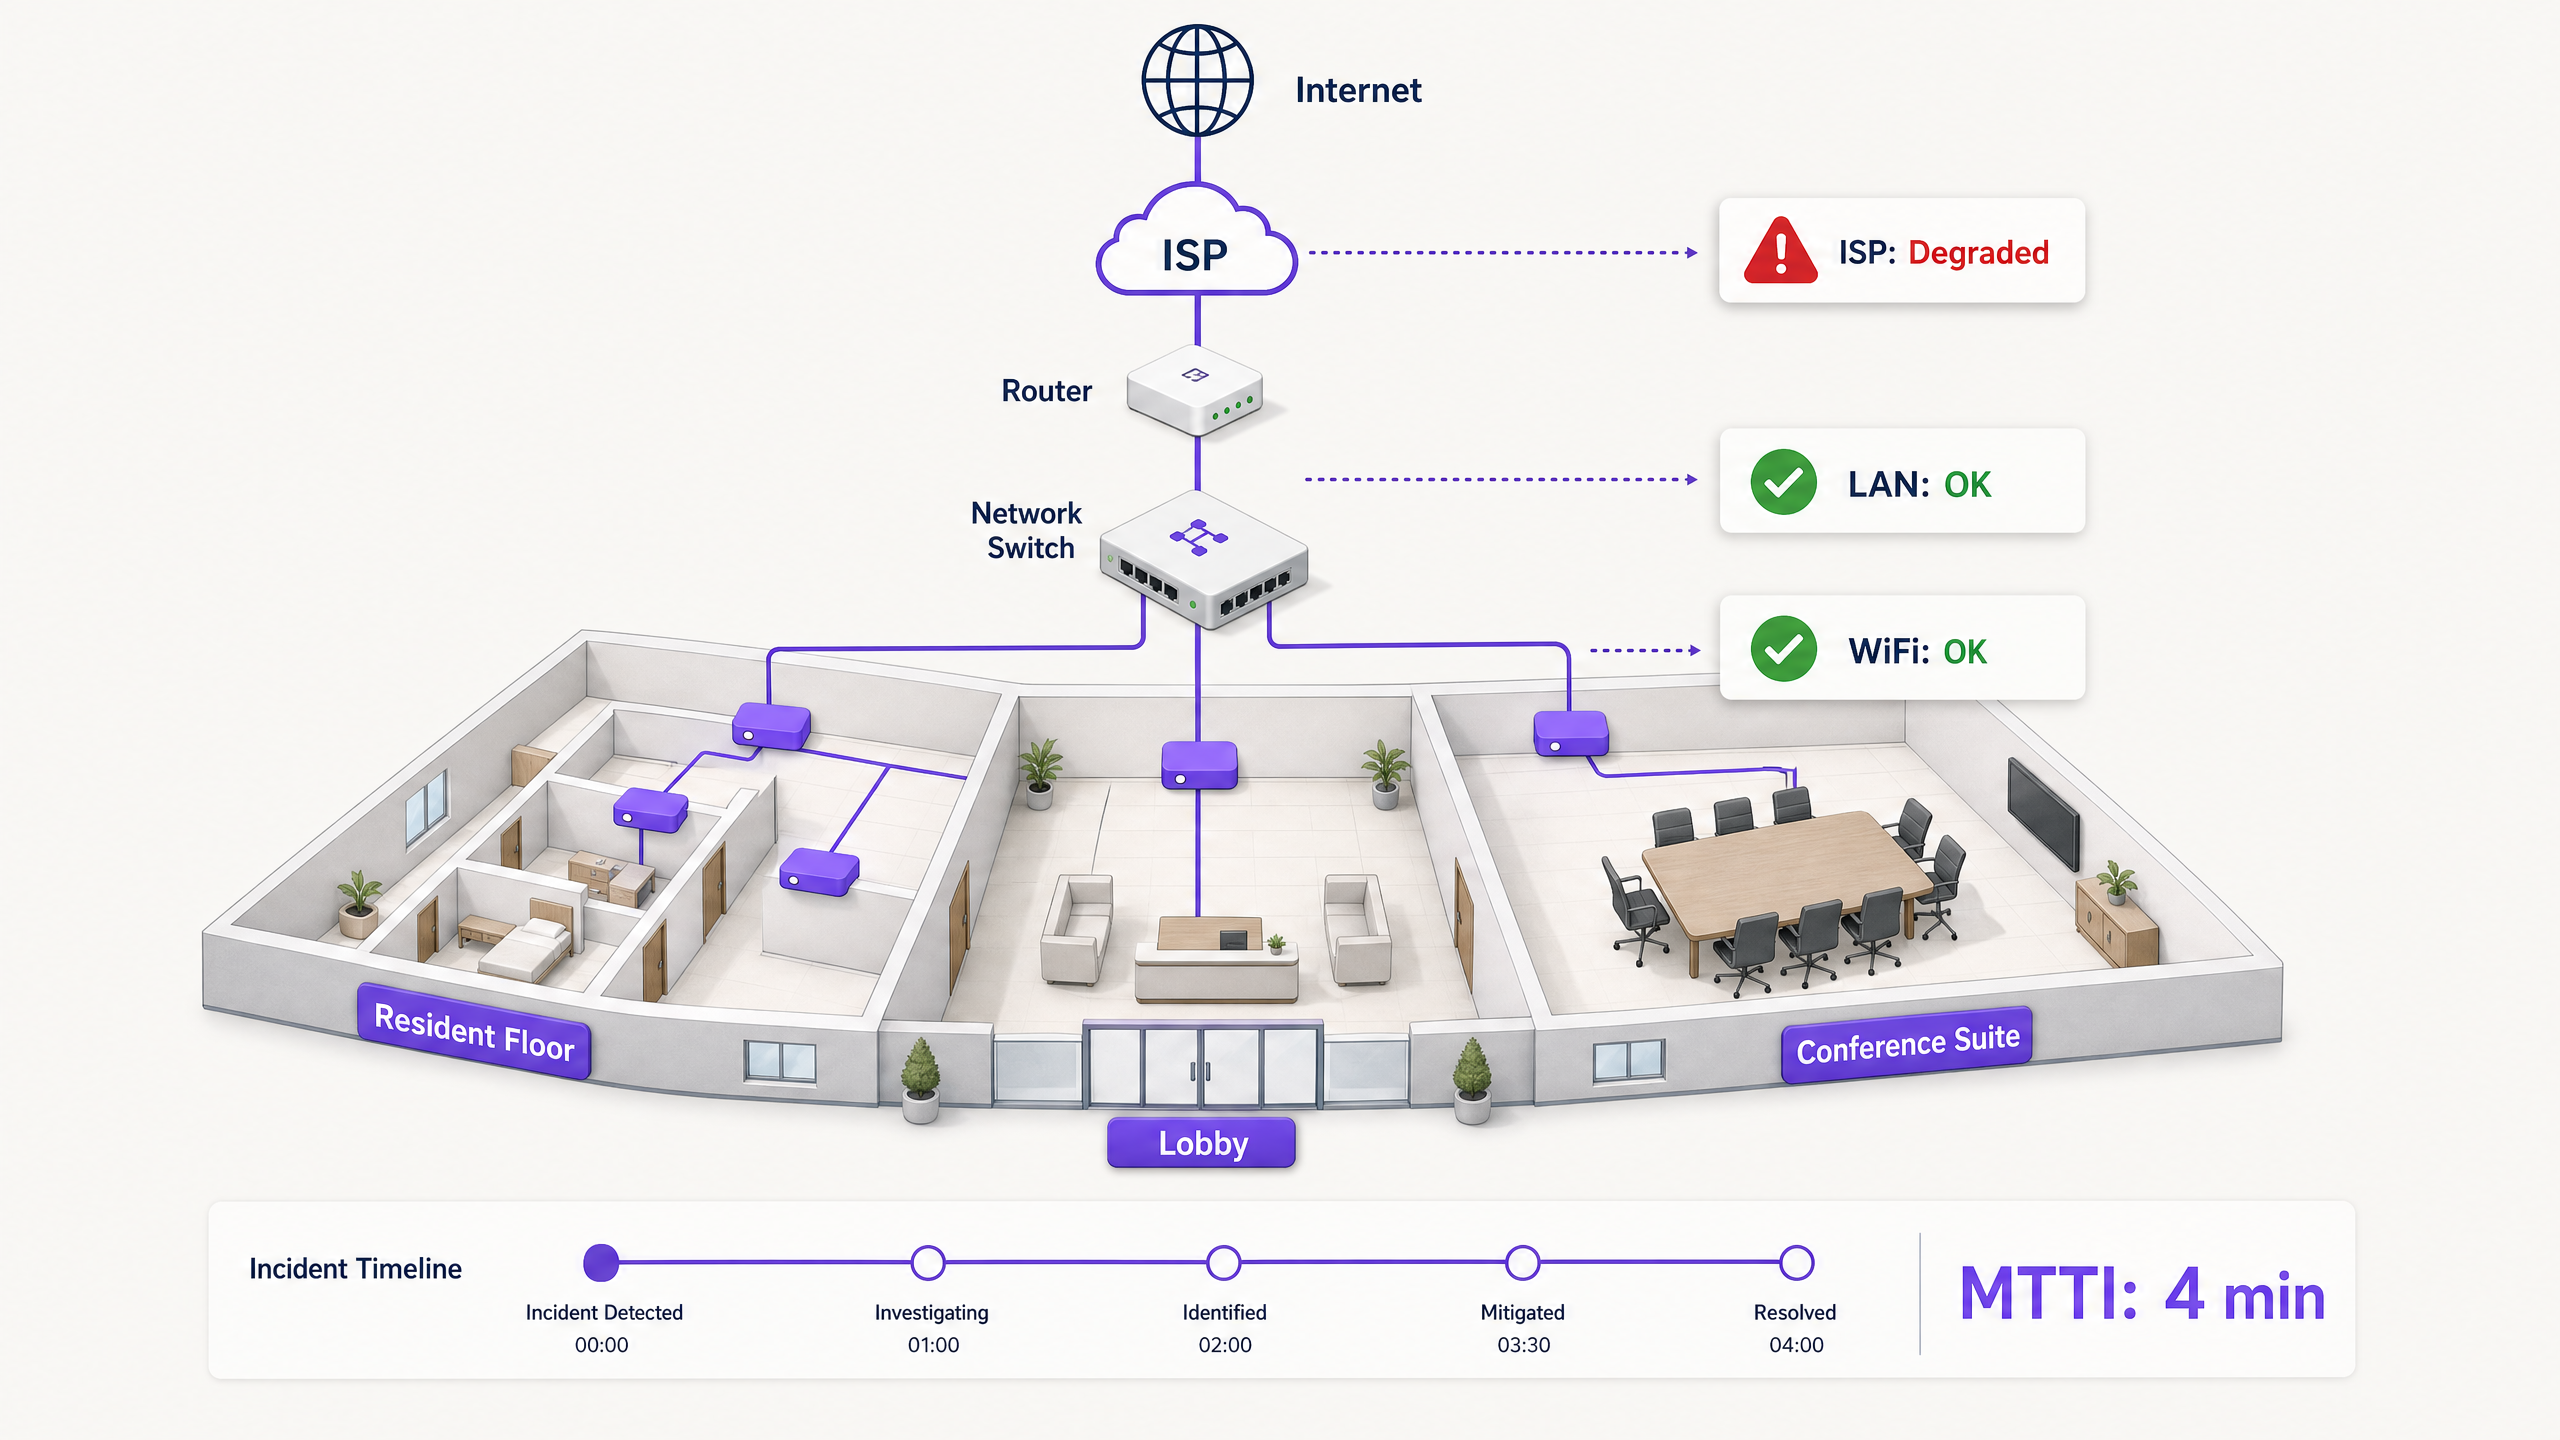
When connectivity drops in a multi-tenant environment, the WiFi gets blamed first. It is the visible edge of the network, the last hop before the device, and the easiest target for frustrated users. For IT managers, network architects, and venue operations directors, this creates a persistent operational tax: the time spent proving innocence.
Mean time to innocence (MTTI) measures the average elapsed time between an incident being reported and a team's ability to demonstrate that their domain is not the root cause. In complex environments like build-to-rent (BTR) blocks, hotels, or conference centres, the network is fragmented across property managers, managed WiFi providers, and internet service providers (ISPs). Without definitive telemetry, MTTI inflates mean time to resolution (MTTR) as teams argue over responsibility rather than fixing the fault.
This guide details a five-step observability methodology to systematically reduce MTTI. By deploying continuous synthetic checks, hop-by-hop path visibility, flow data analysis, topology mapping, and event correlation, you can replace adversarial finger-pointing with shared evidence. The goal is not to win the blame game faster, but to end it entirely.
Technical Deep-Dive: The Mechanics of MTTI
The Distinction Between MTTI and Mean Time to Identify
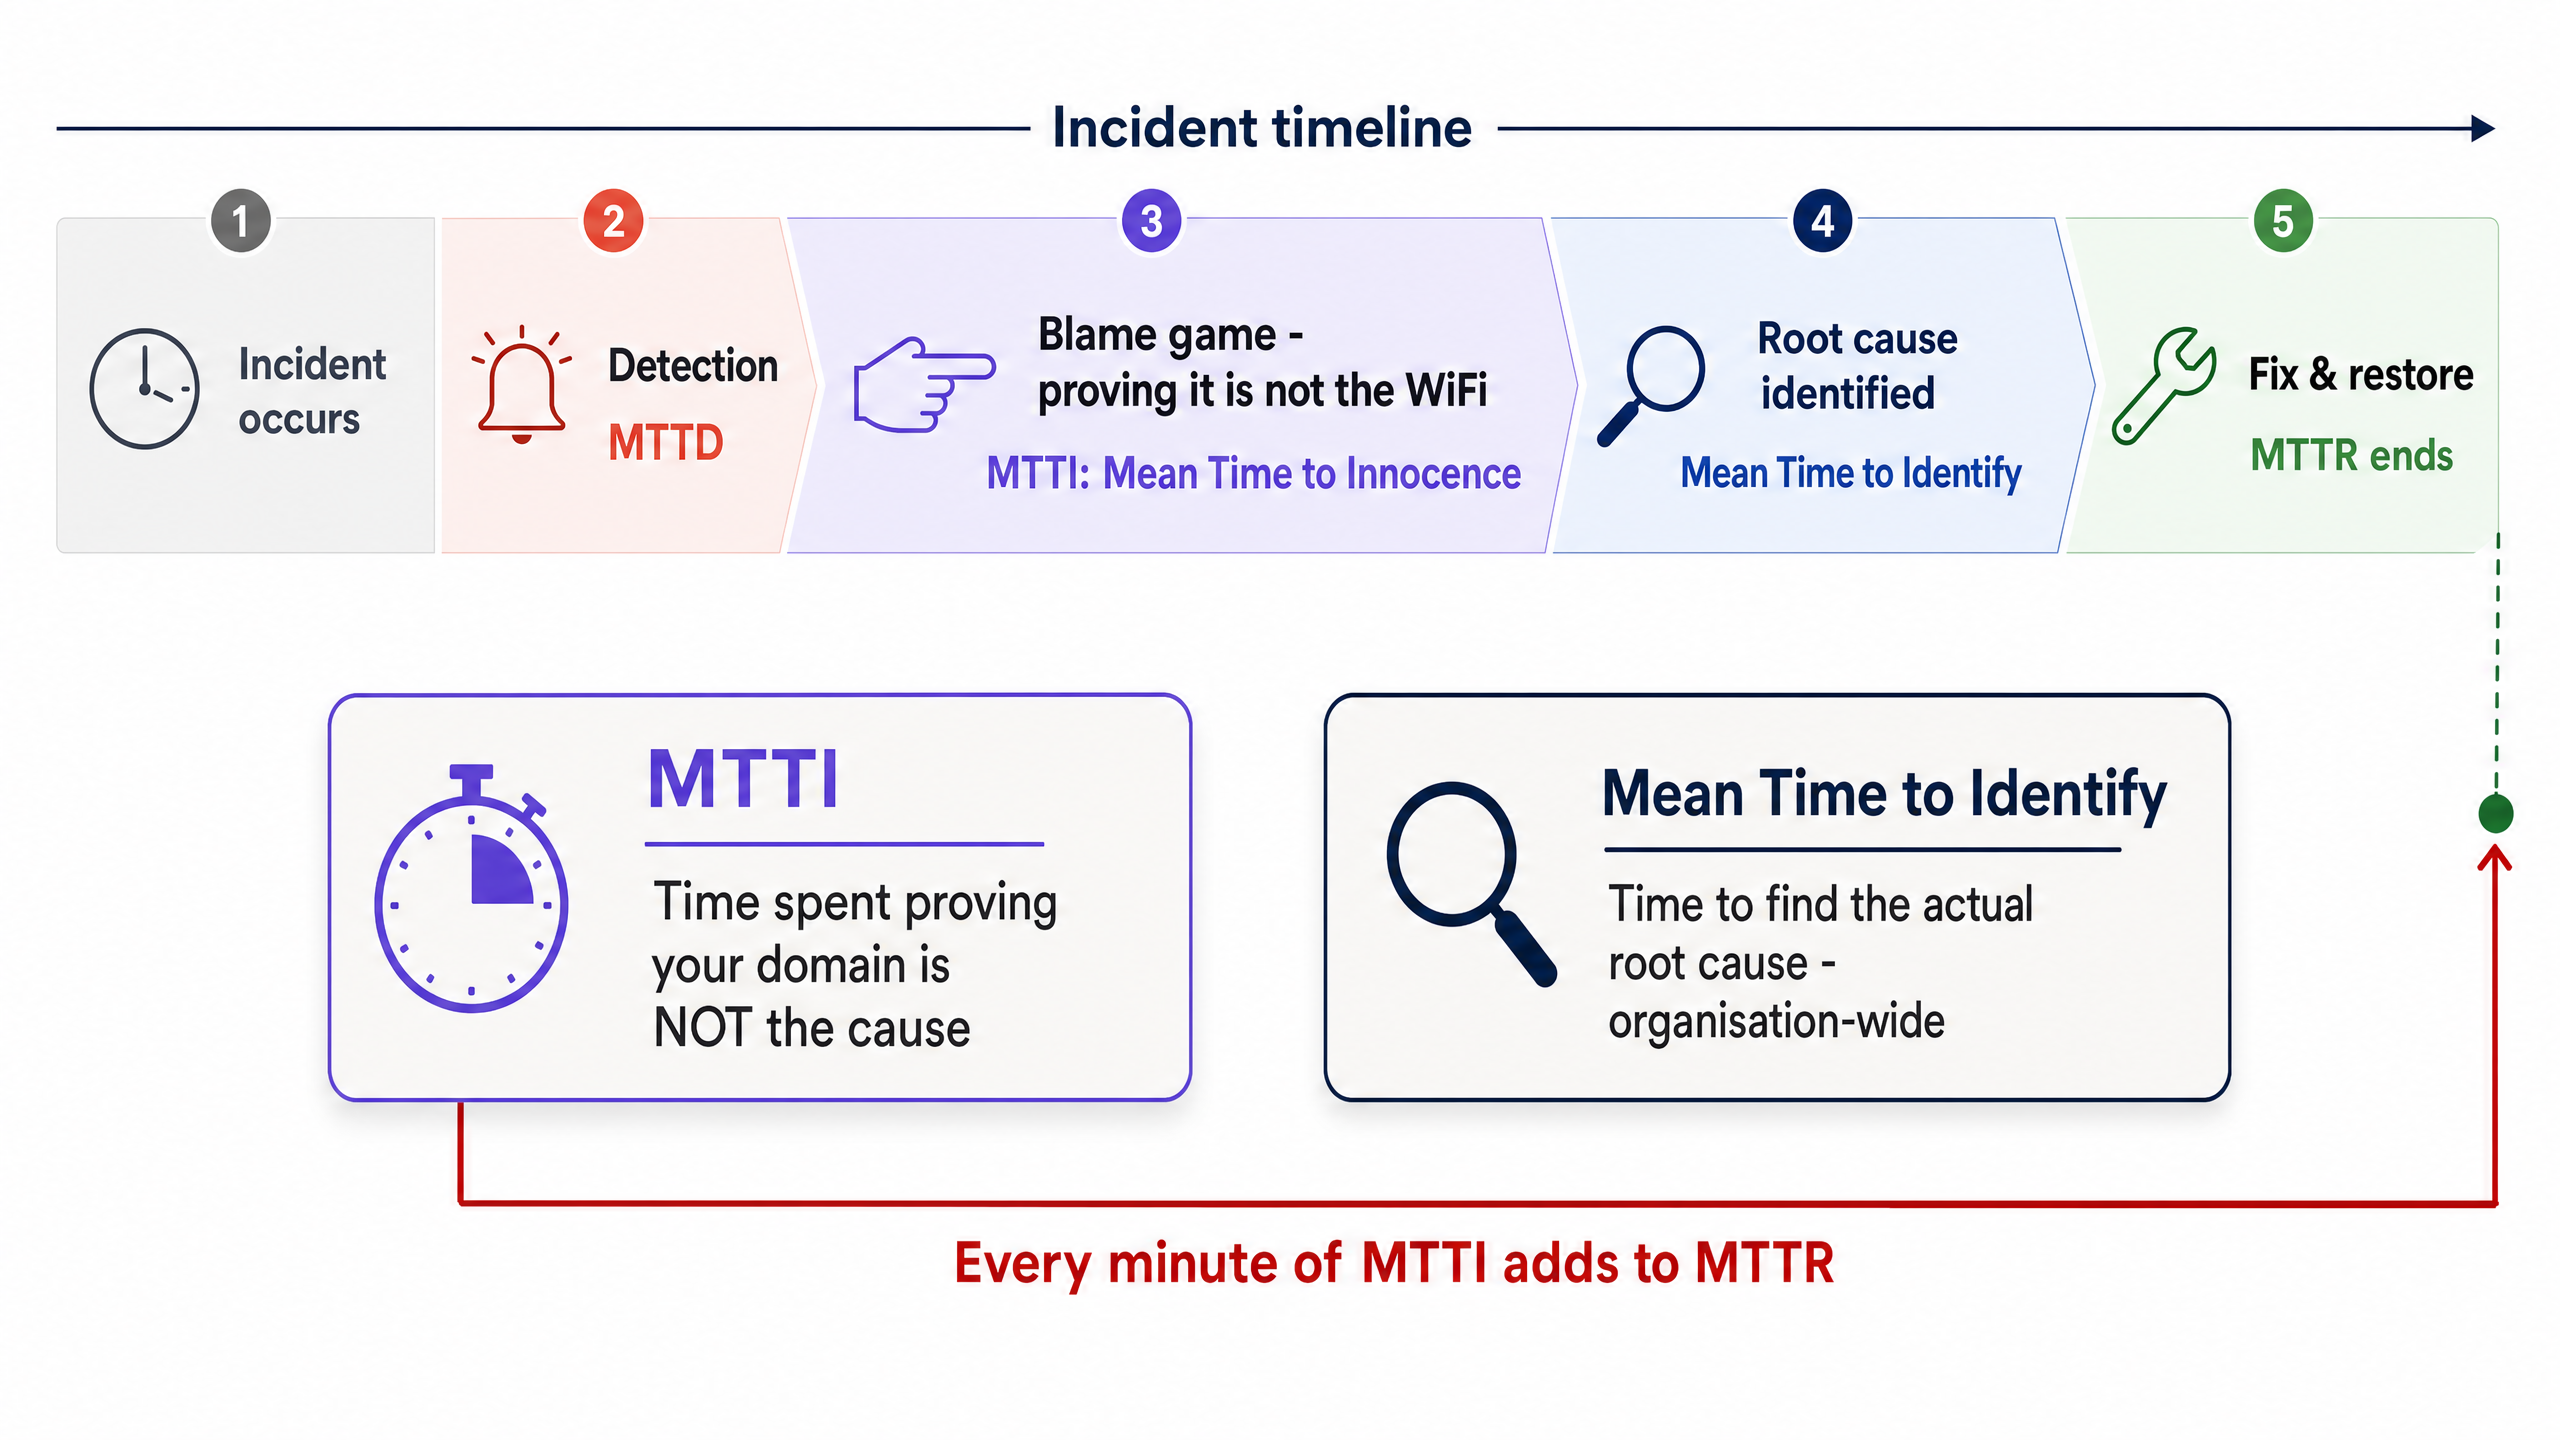
It is vital to separate MTTI from mean time to identify. Mean time to identify is an organisation-wide metric tracking how long it takes to find the actual root cause of an outage. MTTI is a siloed, domain-specific metric tracking how long it takes one team to prove they are not the culprit.
Every minute of MTTI adds directly to MTTR. If a managed WiFi provider spends 40 minutes manually checking access points (APs) and switch logs before concluding the issue lies with the ISP, the MTTR has a 40-minute penalty built in before the actual remediation even begins.
Why the WiFi Takes the Blame
In environments serving 350 million unique users across 80,000+ live venues, Purple sees the same pattern repeatedly. The WiFi layer is blamed by default due to three structural realities:
- Visibility bias: The WiFi signal indicator is the only network diagnostic tool available to the average venue user.
- Edge proximity: As the final hop to the client device, WiFi inherits the symptoms of every upstream failure. A DNS timeout at the ISP looks identical to an AP failure from the user's perspective.
- Telemetry gaps: Historically, proving wireless health required manual intervention. If you cannot show a clean bill of health for the wireless layer in under two minutes, you lose the narrative.
The Multi-Tenant Complication
In a single-tenant enterprise, network teams own the stack from the AP to the firewall. In Multi-Tenant WiFi environments, ownership is fractured.
A BTR resident pays the property manager. The property manager contracts a managed WiFi provider. The managed WiFi provider relies on a third-party ISP circuit and, often, the landlord's in-building distribution network. When a resident cannot stream video, the provider must rapidly exonerate the WiFi hardware (Cisco Meraki, HPE Aruba, Ruckus, or Juniper Mist) and isolate the fault to the client device, the building switch, or the ISP. Failure to do so damages the commercial relationship between the provider and the property manager.
Implementation Guide: The 5-Step Methodology
To systematically reduce MTTI, implement this five-layer observability architecture.
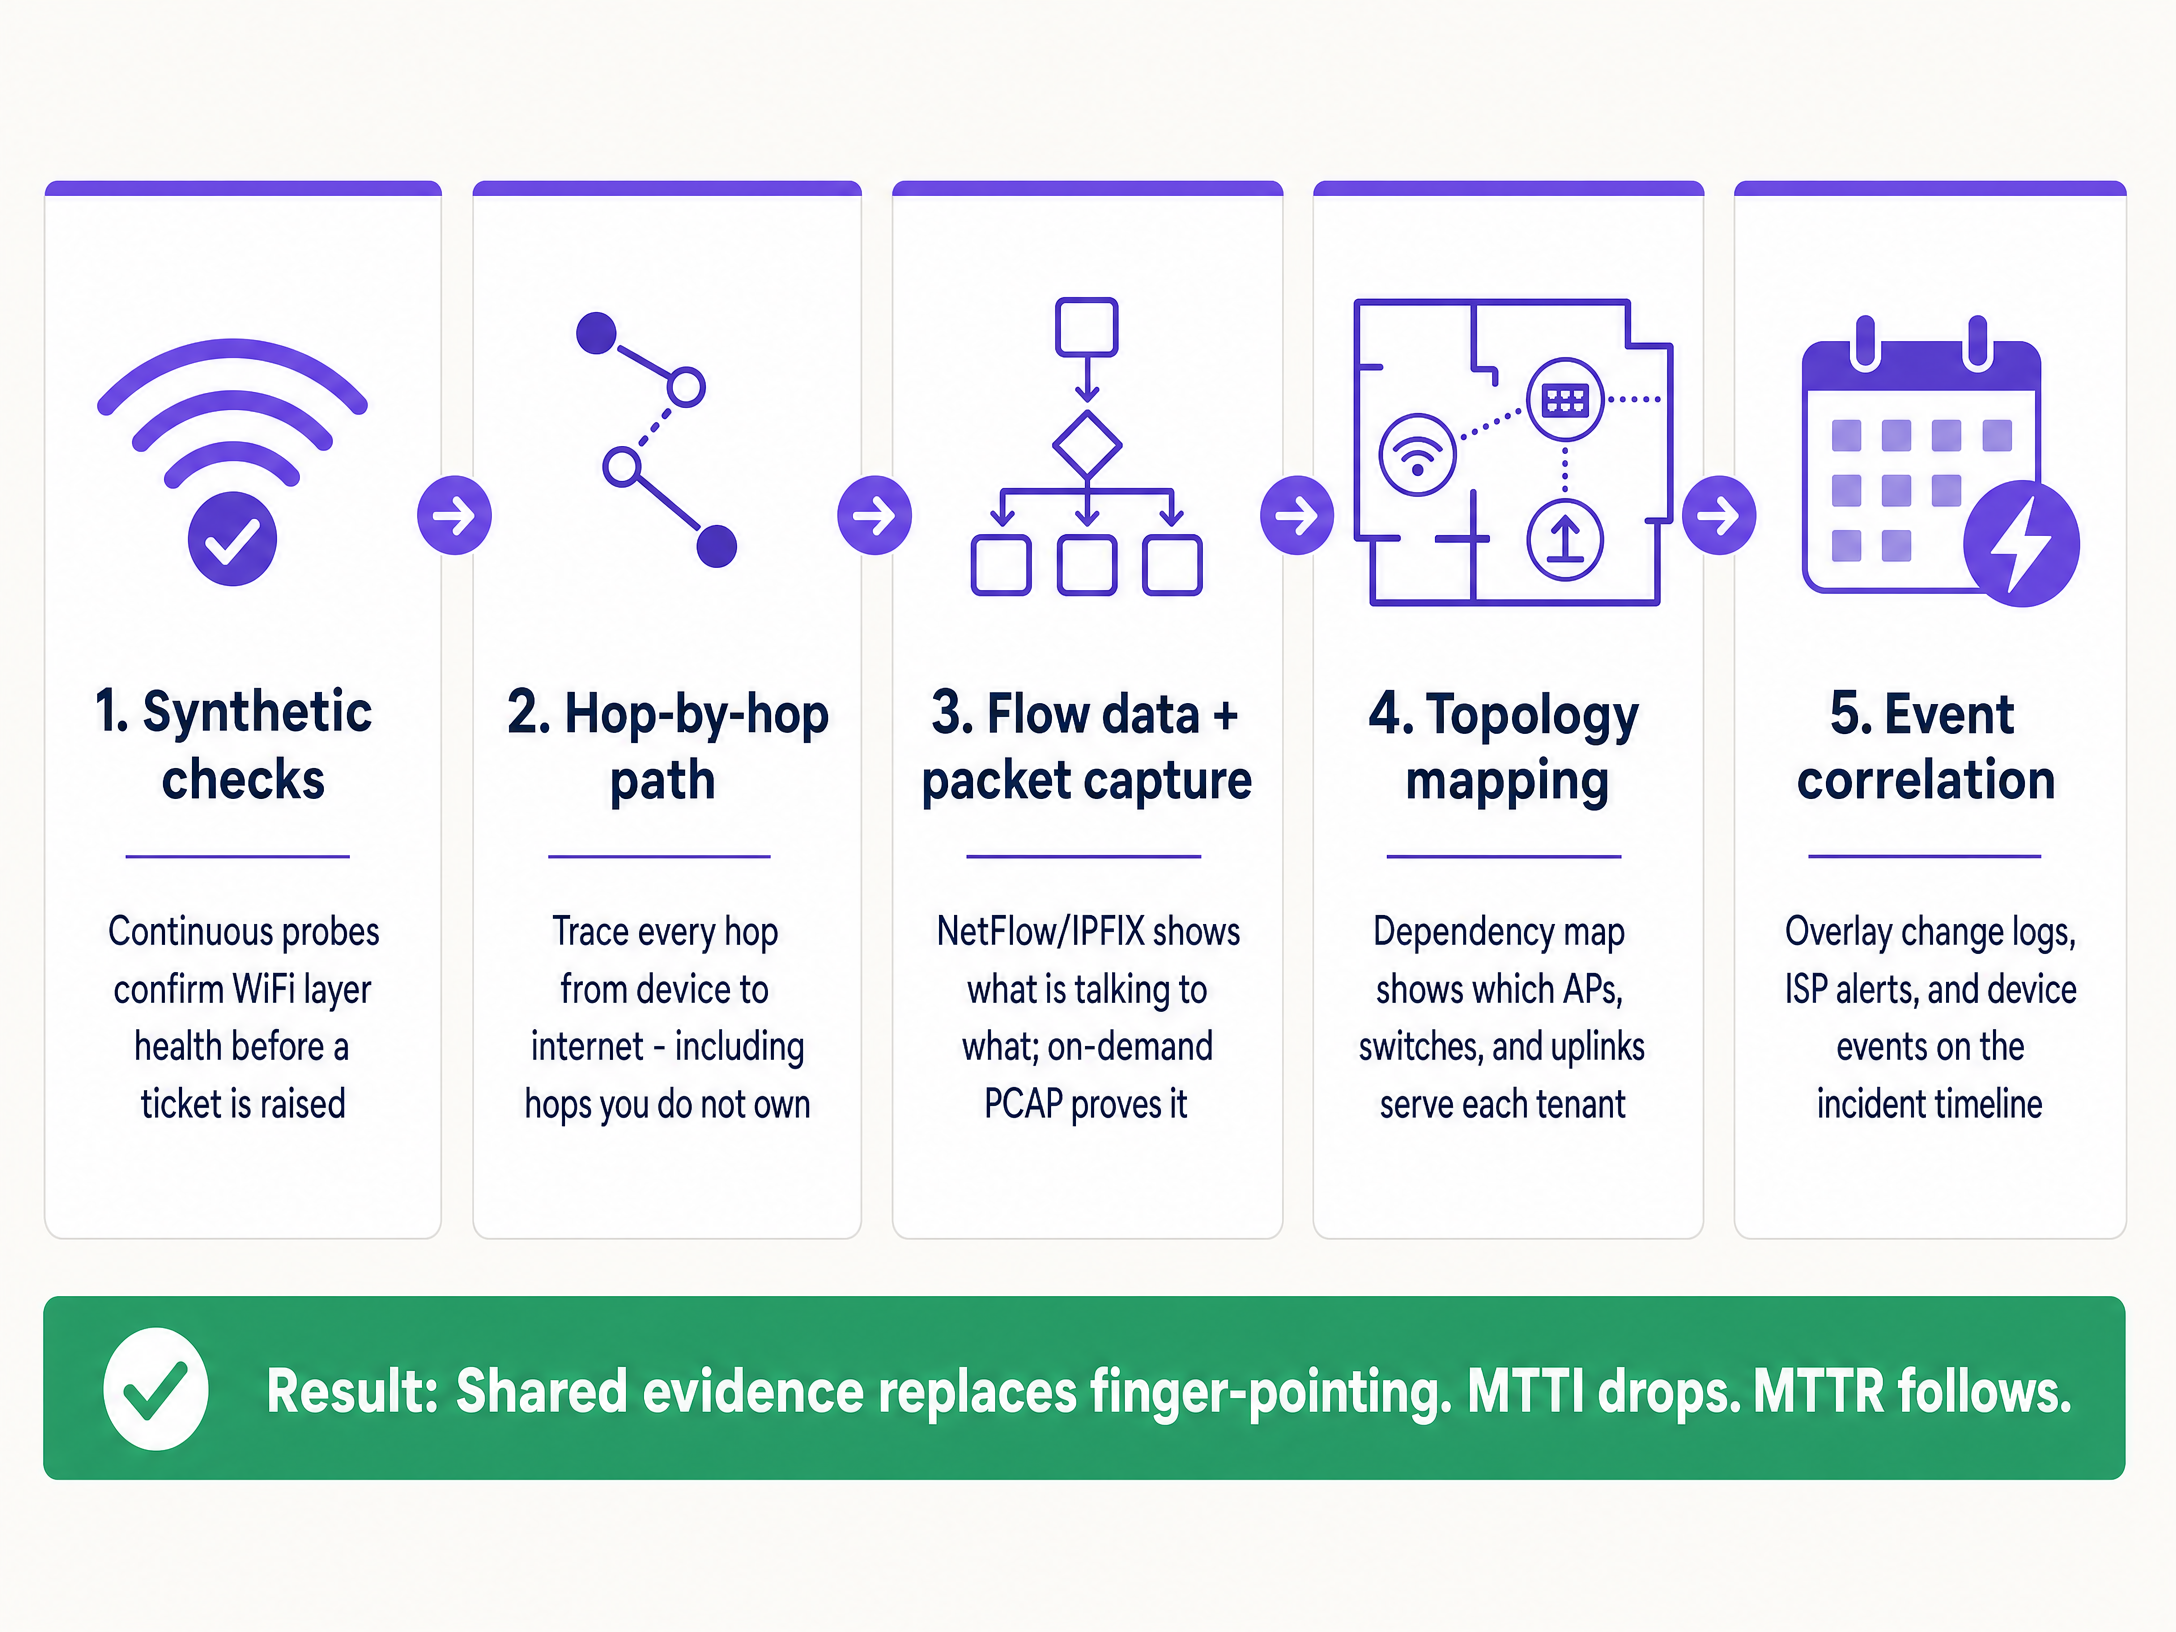
1. Continuous Synthetic Checks
Do not wait for a user to complain. Deploy automated synthetic probes that continuously emulate user behaviour from the network edge.
- Implementation: Configure APs or dedicated sensors to run scheduled tests for DHCP response, DNS resolution, HTTP reachability, and authentication flows (such as 802.1X or captive portal logins).
- Outcome: When a ticket is raised, you check the synthetic dashboard first. If the probes show clean HTTP reachability at the exact time of the complaint, you immediately exonerate the WiFi layer and the WAN circuit, shifting focus to the specific client device or the target application.
2. Hop-by-Hop Path Visibility
Proving your hardware is healthy is insufficient if you cannot prove the path to the internet is clear.
- Implementation: Use path visualisation tools to trace traffic from the access layer across the LAN, through the demarcation point, and into the ISP network.
- Outcome: When latency spikes, a path trace reveals exactly which node introduced the delay. If hops one through four (your domain) show 2ms latency, and hop five (the ISP edge router) shows 150ms latency and 12% packet loss, you have definitive proof to hand to the ISP.
3. Flow Data and On-Demand Packet Capture
When users report application-specific failures, you need conversation-level visibility.
- Implementation: Export NetFlow or IPFIX data from your core switches or firewalls. Ensure your access layer hardware supports remote, on-demand packet capture (PCAP) without requiring an engineer on site.
- Outcome: Flow data proves whether traffic to a specific service is leaving your network cleanly. If it is, the network is innocent. If deeper forensic proof is required, a targeted PCAP on the specific VLAN provides undeniable evidence of TCP retransmissions or server-side resets.
4. Topology and Dependency Mapping
In a multi-tenant environment, isolating the blast radius is the fastest way to categorise a fault.
- Implementation: Maintain a live, dynamically updated dependency map linking every AP to its switch, uplink, and WAN circuit, mapped against tenant VLANs.
- Outcome: If a fault affects APs across multiple floors but only on a single switch, the issue is the switch. If it affects all APs but only one tenant's VLAN, it is a logical configuration issue. Rapid scoping prevents wasted effort investigating healthy infrastructure.
5. Event Correlation
Data without context prolongs investigations.
- Implementation: Feed change logs, ISP maintenance alerts, hardware firmware updates, and user tickets into a single timeline view.
- Outcome: Overlaying a spike in authentication failures with a Microsoft Entra ID certificate expiration event that occurred 10 minutes prior immediately identifies the root cause, bypassing the network hardware entirely.
Best Practices
- Standardise the Hardware Stack: Limit deployments to canonical enterprise vendors (Cisco Meraki, HPE Aruba, Ruckus, Juniper Mist, Ubiquiti UniFi, Cambium, Extreme, Fortinet) that expose APIs for synthetic testing and remote PCAP.
- Automate the Evidence: Configure your monitoring platform to automatically attach synthetic test results and path traces to ITSM tickets the moment they are created.
- Share the Dashboard: Provide property managers with read-only access to a high-level health dashboard. Transparency preempts the blame game.
- Track MTTI Formally: Measure the time between ticket creation and the moment your team provides evidence of innocence. Treat it as a primary KPI alongside MTTR.
Troubleshooting & Risk Mitigation
- Risk: The 'No Fault Found' Loop: Users report issues, but synthetic checks show green.
- Mitigation: The issue is likely device-specific or related to RF interference (co-channel interference or physical obstruction). Use client-side analytics to check the specific device's RSSI and roaming history.
- Risk: ISP Denial: The ISP refuses to accept the fault despite your evidence.
- Mitigation: Provide hop-by-hop path traces showing the exact IP address where packet loss begins. Share PCAPs demonstrating clean egress from your demarcation point. Hard data forces escalation past Level 1 support.
- Risk: Captive Portal Failures: Users blame the WiFi when the portal fails to load.
- Mitigation: Isolate the identity provider. Check the status of the integration (Microsoft Entra ID, Okta, Google Workspace). If the network allows pre-authentication traffic but the IdP times out, the network is innocent.
ROI & Business Impact
Reducing MTTI delivers measurable business value beyond simply saving engineering hours.
- Reduced MTTR: Stripping 40 minutes of finger-pointing from an incident directly reduces downtime, protecting revenue in retail and hospitality environments.
- SLA Compliance: Faster exoneration prevents unfair penalties being levied against the managed WiFi provider when the fault lies with the ISP or the building infrastructure.
- Client Retention: In the Multi-Tenant WiFi sector, property managers renew contracts with providers who offer transparency and rapid answers. Shared evidence builds trust; defensive arguments destroy it.
- Resource Optimisation: Highly paid Level 3 network engineers spend their time engineering solutions, rather than manually proving the network is functioning correctly.
Key Definitions
Mean Time to Innocence (MTTI)
The average time required for a specific IT team to prove, using objective data, that their domain or infrastructure is not the root cause of a reported incident.
Critical for managed WiFi providers who must defend their service against property managers and ISPs.
Mean Time to Identify
The organisation-wide metric tracking the total time elapsed from incident detection to the discovery of the actual root cause.
MTTI is a subset of this metric. Reducing MTTI directly reduces the overall time to identify.
Synthetic Checks
Automated, continuous tests that emulate user traffic (e.g., DNS lookups, HTTP requests) to proactively monitor network health.
Used to prove the WiFi layer was functioning correctly at the exact moment a user complained.
Hop-by-Hop Path Visibility
Telemetry that traces network traffic node-by-node from the client to the destination, measuring latency and loss at each specific router or switch.
Essential for proving a fault lies in an ISP network or a landlord's distribution switch, rather than the managed WiFi hardware.
Flow Data (NetFlow/IPFIX)
Network protocol data that provides a summary of traffic conversations, showing source, destination, protocol, and volume.
Used to prove that specific application traffic is successfully leaving the local network.
On-Demand Packet Capture (PCAP)
The ability to remotely record raw network traffic from an access point or switch for forensic analysis.
The ultimate proof used to demonstrate server-side errors or client device misbehaviour.
Blast Radius
The scope of impact of a specific incident (e.g., one user, one AP, one switch, one tenant, or the entire building).
Determining the blast radius via topology mapping is the fastest way to exclude healthy infrastructure from an investigation.
Event Correlation
The practice of overlaying different data streams (logs, alerts, updates) on a single timeline to identify cause and effect.
Used to prove that a network outage was caused by a third-party change, such as an unannounced ISP maintenance window.
Worked Examples
A 350-room hotel reports that in-room WiFi is slow across the entire property. The front desk blames the managed WiFi provider. How do you exonerate the network and find the root cause?
- Check the synthetic probes: DNS and HTTP reachability tests show the APs have a clean connection to the internet. 2. Review the topology map: The issue affects all APs across all switches, ruling out edge hardware. 3. Execute a path trace: The trace shows 2ms latency within the hotel LAN, but 180ms latency at the third hop (the ISP's aggregation router). 4. Export the evidence: Send the path trace screenshot to the hotel manager and the ISP.
A national retailer reports point-of-sale (POS) terminals in one region are dropping connections to the payment processor. The network team is blamed for a firewall or routing misconfiguration.
- Isolate the blast radius: Confirm only POS terminals (specific VLAN) are affected; guest WiFi and back-office systems are healthy. 2. Analyse flow data: NetFlow confirms traffic destined for the payment processor's IP range is successfully leaving the store routers. 3. Capture packets: An on-demand PCAP on the POS VLAN reveals the payment processor's server is sending TCP resets (RST). 4. Share the PCAP with the payment processor's support team.
Practice Questions
Q1. A tenant in a coworking space complains they cannot access their corporate VPN. Other tenants are browsing the internet without issue. What is the most efficient way to prove the WiFi network is not at fault?
Hint: Consider the blast radius and the specific type of traffic failing.
View model answer
First, use the topology map to confirm the blast radius is limited to one user or one specific service, ruling out a general AP or switch failure. Second, analyse flow data (NetFlow/IPFIX) for that client's IP address. If the flow data shows the VPN traffic (e.g., UDP 500 or TCP 443) is leaving the network cleanly, the WiFi and LAN are innocent. The issue is either the client's VPN configuration or the corporate firewall blocking the connection.
Q2. Your monitoring dashboard shows an AP has gone offline, but the property manager insists the WiFi is broken because the ISP is down. How do you prove the issue is internal power, not the ISP?
Hint: Look for correlation between infrastructure state and external events.
View model answer
Use event correlation and topology mapping. If the topology map shows only one AP is offline while others on the same switch are functioning, the ISP circuit is clearly active. Event correlation might show a PoE (Power over Ethernet) failure log from the switch port connected to that specific AP. This proves the issue is local hardware or cabling, not the WAN circuit.
Q3. A stadium operations director claims the WiFi failed during halftime because ticket scanners stopped working. You need to exonerate the network in under two minutes. What telemetry do you use?
Hint: You need historical proof of health at the exact moment of the reported failure.
View model answer
Pull the historical data from the continuous synthetic checks. Show the operations director the dashboard confirming that during the exact 15-minute halftime window, the APs were successfully resolving DNS and reaching the ticketing server's IP address with low latency. This immediately proves the wireless network was healthy and shifts the investigation to the ticketing application servers, which likely buckled under the sudden load.
Continue reading in this series
Legal and Compliance Requirements for Shared WiFi Infrastructure
This authoritative technical reference guide outlines the critical legal, regulatory, and architectural requirements for deploying and managing shared WiFi infrastructure. It provides IT managers, network architects, and venue operators with actionable frameworks for ensuring robust data protection, strict payment security compliance, and high-performance tenant isolation using enterprise standards.
Bandwidth Management and Quality of Service (QoS) in Co-Working Spaces
An authoritative technical reference guide for IT managers, network architects, and venue operations directors on implementing robust Bandwidth Management and Quality of Service (QoS) frameworks in co-working environments. This guide details network segmentation, traffic prioritization, vendor-neutral configurations, and real-world ROI metrics to deliver enterprise-grade connectivity. It covers IEEE 802.11e/WMM standards, VLAN design, per-user rate limiting, and troubleshooting strategies with measurable business outcomes.
VLAN Segmentation Best Practices for Multi-Tenant Environments
This guide provides IT managers, network architects, CTOs, and venue operations directors with an authoritative, vendor-neutral blueprint for implementing VLAN segmentation in multi-tenant WiFi environments. It covers the IEEE 802.1Q standard, Dynamic VLAN Assignment via 802.1X and RADIUS, and step-by-step deployment guidance for hospitality, retail, stadium, and public-sector venues. Proper VLAN segmentation is the foundational control for PCI DSS and GDPR compliance, lateral movement prevention, and delivering high-performance wireless connectivity across shared physical infrastructure.