平均自證清白時間:如何證明問題不在 WiFi
平均自證清白時間(MTTI)是衡量 IT 團隊花費多少時間來證明網路問題非其責任的關鍵指標。本指南詳述了一套五步驟的觀測方法論,旨在消除多租戶環境中的推諉責任現象,以共享證據取代互相指責,進而降低平均修復時間(MTTR)。
收聽此指南
查看播客逐字稿
📚 核心系列的一部分:Multi-Tenant WiFi Guide →
執行摘要
當多租戶環境中的連線中斷時,WiFi 總是第一個被怪罪。它是網路中肉眼可見的邊緣、裝置前的最後一哩路,也是受挫用戶最容易發洩的對象。對於 IT 經理、網路架構師和場域營運總監而言,這造成了持續性的營運負擔:花費時間來證明自身清白。
平均清白時間 (Mean time to innocence - MTTI) 衡量的是從通報事件到團隊能夠證明其管轄範圍並非根本原因之間的平均流逝時間。在建置出租 (build-to-rent - BTR) 住宅、飯店或會議中心等複雜環境中,網路分布在物業管理者、託管 WiFi 供應商和網際網路服務供應商 (ISP) 之間。在缺乏明確遙測數據的情況下,由於各團隊爭論責任歸屬而非著手修復故障,MTTI 會拉長平均修復時間 (MTTR)。
本指南詳細介紹了系統性降低 MTTI 的五步驟觀測方法。透過部署持續性的合成測試、逐跳路徑可視性、流量數據分析、拓撲映射和事件關聯,您可以將對立的責任推諉轉化為共享的證據。其目標不是更快贏得指責遊戲,而是徹底結束這場爭端。
技術深度剖析:MTTI 的運作機制
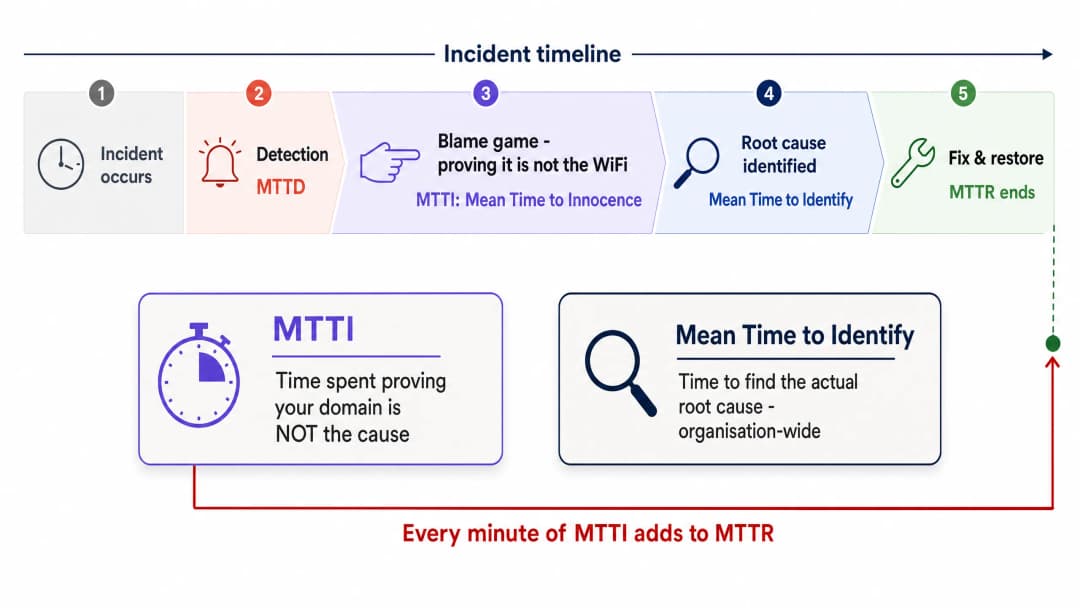
MTTI 與平均識別時間之間的區別
區分 MTTI 與平均識別時間至關重要。平均識別時間是衡量整個組織尋找故障實際根本原因所需時間的指標。而 MTTI 則是針對特定領域、孤立的指標,衡量單一團隊證明自己並非禍首所需的時間。
MTTI 的每一分鐘都會直接增加 MTTR。如果託管 WiFi 供應商花費 40 分鐘手動檢查基地台 (AP) 和交換器記錄,才得出問題出在 ISP 的結論,那麼在實際修復開始之前,MTTR 就已經被強加了 40 分鐘的延遲罰時。
為什麼 WiFi 總是成為代罪羔羊
在為 80,000 多個實體場域、3.5 億不重複用戶提供服務的環境中,Purple 重複看到了相同的模式。由於以下三個結構性現實,WiFi 層預設會被怪罪:
- 可視性偏誤:WiFi 訊號指標是一般場域用戶唯一能取得的網路診斷工具。
- 邊緣鄰近性:作為連接用戶端裝置的最後一哩路,WiFi 承接了所有上游故障的病徵。從用戶的角度來看,ISP 端的 DNS 逾時與 AP 故障看起來完全相同。
- 遙測落差:過去要證明無線網路健康狀況需要人工介入。如果您無法在兩分鐘內出具無線網路層的健康證明,您就會失去話語權。
多租戶環境的複雜性
在單一租戶的企業中,網路團隊擁有從 AP 到防火牆的完整堆疊。而在多租戶 WiFi 環境中,所有權則是破碎的。
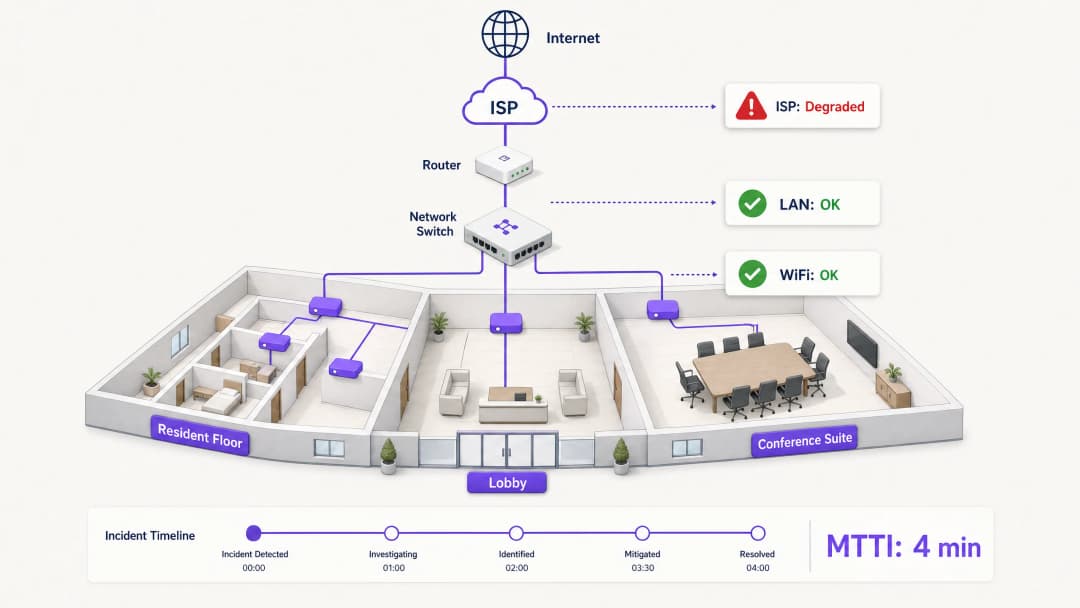
「建屋出租」(BTR)的住戶向物業經理付費。物業經理與託管 WiFi 供應商簽約。託管 WiFi 供應商則依賴第三方 ISP 線路,而且通常還需要依賴房東的大樓內部分配網路。當住戶無法串流播放影片時,供應商必須快速排除 WiFi 硬體(Cisco Meraki, HPE Aruba, Ruckus 或 Juniper Mist)的責任,並將故障定位至用戶端裝置、大樓交換器或 ISP。未能做到這一點將會損害供應商與物業經理之間的商業關係。
實作指南:5 步驟方法論
若要系統化地降低 MTTI,請實作此五層可觀測性架構。
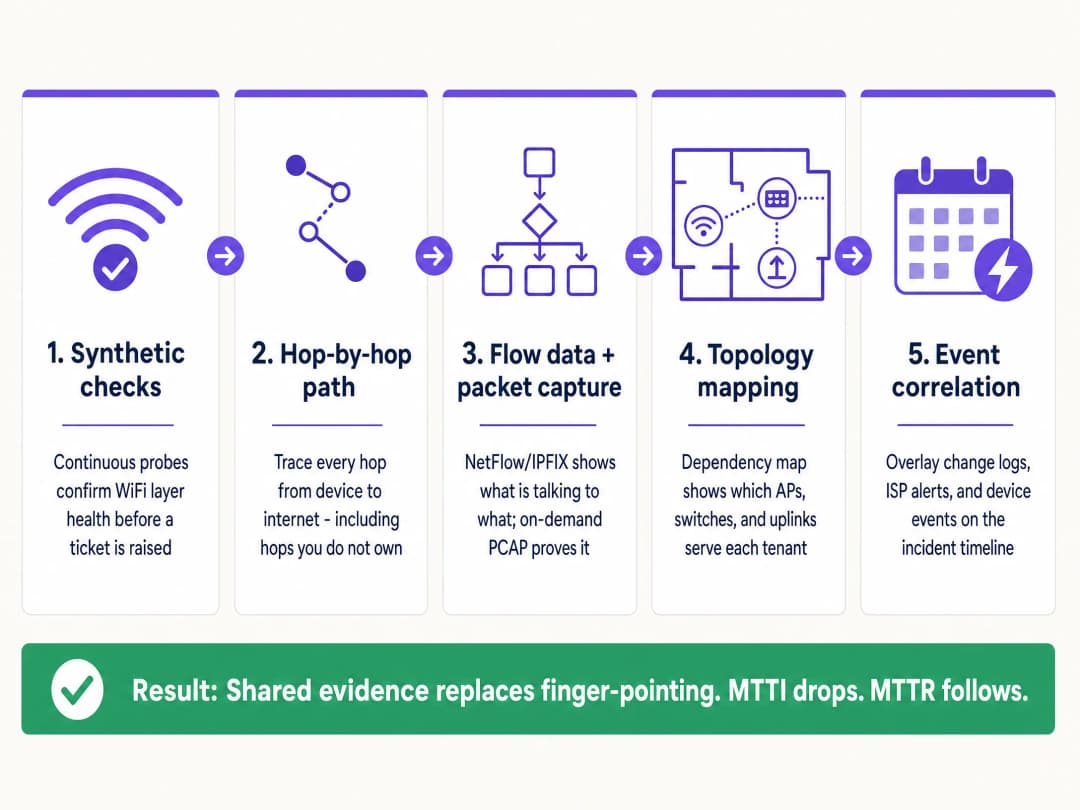
1. 持續的主動模擬測試
不要等待用戶投訴。部署自動化的模擬探針,從網路邊緣持續模擬用戶行為。
- 實作:設定 AP 或專用感測器,針對 DHCP 回應、DNS 解析、HTTP 可達性以及驗證流程(例如 802.1X 或 Captive Portal 登入)執行排程測試。
- 成果:當建立工單時,您先檢查模擬測試儀表板。如果探針在投訴發生的確切時間顯示良好的 HTTP 可達性,您就可以立即排除 WiFi 層和 WAN 線路的責任,將焦點轉移到特定的用戶端裝置或目標應用程式。
2. 逐跳路徑可視性
如果您無法證明通往網際網路的路徑是暢通的,那麼僅證明您的硬體健康是不夠的。
- 實作:使用路徑視覺化工具,追蹤流量從存取層跨越 LAN、通過分界點並進入 ISP 網路的軌跡。
- 成果:當延遲飆升時,路徑追蹤會精確顯示是哪一個節點引入了延遲。如果第一到第四跳(您的網域)顯示 2ms 延遲,而第五跳(ISP 邊緣路由器)顯示 150ms 延遲和 12% 的封包遺失,您就有確鑿的證據可以提供給 ISP。
3. 流量數據與隨選封包擷取
當用戶回報特定應用程式的故障時,您需要交談層級的可視性。
- 實作:從您的核心交換器或防火牆匯出 NetFlow 或 IPFIX 資料。確保您的存取層硬體支援遠端、隨選的封包擷取 (PCAP),而無需工程師親臨現場。
- 成果:流量資料可證明前往特定服務的流量是否已乾淨地離開您的網路。如果是,則表示網路沒有問題。如果需要更深層的鑑識證據,在特定 VLAN 上進行針對性的 PCAP 即可提供無可辯駁的 TCP 重新傳送或伺服器端重設證據。
4. 拓撲與相依性對應
在多租戶環境中,隔離波及範圍是歸類故障最快的方法。
- 實作:維護一份即時、動態更新的相依性對應圖,將每台 AP 連結至其交換器、上行鏈路和 WAN 線路,並對應至租戶 VLAN。
- 成果:如果故障影響了跨多個樓層的 AP,但僅限於單一交換器,則問題在於該交換器。如果影響了所有 AP,但僅限於單一租戶的 VLAN,則為邏輯設定問題。快速評估範圍可避免浪費精力調查健全的基礎設施。
5. 事件關聯
缺乏脈絡的資料會延長調查時間。
- 實作:將變更記錄、ISP 維護警報、硬體韌體更新和使用者工單摘要至單一時間軸檢視中。
- 成果:將驗證失敗次數的急增與 10 分鐘前發生的 Microsoft Entra ID 憑證過期事件重疊比對,即可立即識別根本原因,完全繞過網路硬體。
最佳實踐
- 標準化硬體堆疊:將部署限制在主流企業廠商 (Cisco Meraki, HPE Aruba, Ruckus, Juniper Mist, Ubiquiti UniFi, Cambium, Extreme, Fortinet),這些廠商有提供可用於合成測試和遠端 PCAP 的 API。
- 自動化證據收集:設定您的監控平台,在 ITSM 工單建立時,自動將合成測試結果和路徑追蹤附加至工單中。
- 共享儀表板:為物業管理人員提供高階健康狀態儀表板的唯讀存取權限。透明度可先發制人,避免互相推諉。
- 正式追蹤 MTTI:測量從工單建立到您的團隊提出免責證據之間的時間。將其與 MTTR 一併視為主要的 KPI。
疑難排解與風險緩釋
- 風險:「未發現故障」的死循環:使用者回報問題,但合成檢查顯示綠燈。
- 緩釋措施:問題很可能與特定裝置相關,或與射頻干擾 (同頻道干擾或物理障礙物) 有關。使用用戶端分析來檢查特定裝置的 RSSI 和漫遊歷程記錄。
- 風險:ISP 否認:儘管您提出了證據,ISP 仍拒絕承認故障。
- 緩釋措施:提供逐躍點的路徑追蹤,顯示開始丟包的確切 IP 位址。分享顯示從您的分界點乾淨流出的 PCAP。確鑿的數據能迫使升級至 1 級以上的支援服務。* 風險:Captive Portal 故障:當 Portal 無法載入時,使用者會歸咎於 WiFi。
- 緩解措施:隔離身分識別提供者。檢查整合狀態(Microsoft Entra ID、Okta、Google Workspace)。如果網路允許預先驗證流量,但 IdP 逾時,則與網路無關。
ROI 與企業影響
降低 MTTI 除了能節省工程時間外,還能提供可衡量的商業價值。
關鍵定義
平均自證清白時間 (MTTI)
特定 IT 團隊使用客觀數據,證明其管轄領域或基礎設施並非通報事件根本原因所需的平均時間。
對於必須向物業經理和 ISP 捍衛其服務品質的託管 WiFi 供應商而言至關重要。
平均識別時間
追蹤從偵測到事件到發現實際根本原因所經歷的組織內整體總時間指標。
MTTI 是此指標的子集。縮短 MTTI 可直接縮短整體的識別時間。
主動檢查
模擬使用者流量(例如 DNS 查詢、HTTP 請求)以主動監控網路健康狀況的自動化、持續性測試。
用於證明在使用者抱怨的確切時刻,WiFi 層運作正常。
逐跳路徑可視性
逐個節點追蹤從用戶端到目的地的網路流量,並測量每個特定路由器或交換器上的延遲與遺失的遙測技術。
對於證明故障存在於 ISP 網路或房東的分配交換器,而非託管 WiFi 硬體中至關重要。
流量數據 (NetFlow/IPFIX)
提供流量交談摘要的網路協定數據,顯示來源、目的地、協定與傳輸量。
用於證明特定應用程式流量已成功離開本地網路。
隨選封包擷取 (PCAP)
從存取點或交換器遠端記錄原始網路流量以進行鑑識分析的能力。
用於展示伺服器端錯誤或用戶端裝置異常行為的終極證據。
影響範圍
特定事件的影響範圍(例如:單一使用者、單一 AP、單一交換器、單一租戶或整棟建築)。
透過拓撲對應來確定影響範圍,是從調查中排除健康基礎設施的最快方法。
事件關聯分析 (Event Correlation)
在單一時間線上重疊不同的數據流(日誌、告警、更新),以識別因果關係的做法。
用於證明網路中斷是由第三方變更所引起的,例如未事先通知的 ISP 維護時間。
範例
一家擁有 350 間客房的飯店通報,全館客房內 WiFi 速度極慢。櫃台將責任歸咎於託管 WiFi 供應商。您要如何證明網路運作正常並找出根本原因?
- 檢查主動探測:DNS 與 HTTP 可達性測試顯示 AP 與網際網路的連線狀態良好。2. 審查拓撲圖:此問題影響了所有交換器上的所有 AP,排除了邊緣硬體的可能性。3. 執行路徑追蹤:追蹤顯示飯店區域網路(LAN)內的延遲為 2 毫秒,但在第三跳(ISP 的匯聚路由器)延遲達 180 毫秒。4. 匯出證據:將路徑追蹤螢幕截圖傳送給飯店經理與 ISP。
一家全國連鎖零售商通報,某一區域的銷售點(POS)終端機與付款處理系統的連線中斷。網路團隊被指責是防火牆或路由設定錯誤。
- 隔離影響範圍:確認僅有 POS 終端機(特定 VLAN)受到影響,訪客 WiFi 與後勤系統皆運作正常。2. 分析流量數據:NetFlow 確認目的地為付款處理系統 IP 範圍的流量已成功離開商店路由器。3. 擷取封包:在 POS VLAN 上執行隨選 PCAP,顯示付款處理系統的伺服器正在傳送 TCP 重設(RST)。4. 將 PCAP 共享給付款處理系統的支援團隊。
練習題
Q1. 共享辦公空間的一位租戶抱怨無法存取其企業 VPN。其他租戶則能正常瀏覽網路。要證明 WiFi 網路沒有問題,最有效的方法是什麼?
提示:請考慮爆炸半徑(影響範圍)以及發生故障的特定流量類型。
查看標準答案
首先,使用拓撲圖確認爆炸半徑僅限於單一使用者或單一特定服務,排除一般的 AP 或交換器故障。其次,分析該用戶端 IP 位址的流量數據(NetFlow/IPFIX)。如果流量數據顯示 VPN 流量(例如 UDP 500 或 TCP 443)已正常離開網路,則代表 WiFi 和 LAN 是無辜的。問題在於用戶端的 VPN 設定,或是企業防火牆封鎖了該連線。
Q2. 您的監控儀表板顯示一個 AP 已離線,但物業經理堅持認為 WiFi 壞了是因為 ISP 斷線。您要如何證明問題在於內部電源,而不是 ISP?
提示:尋找基礎設施狀態與外部事件之間的關聯性。
查看標準答案
使用事件關聯分析和拓撲對照。如果拓撲圖顯示只有一個 AP 離線,而同一台交換器上的其他 AP 運作正常,則顯然 ISP 線路是正常的。事件關聯分析可能會顯示與該特定 AP 連接的交換器連接埠發出了 PoE(乙太網路供電)故障日誌。這證明了問題在於本地硬體或佈線,而不是 WAN 線路。
Q3. 體育場營運總監聲稱,由於驗票機停止運作,WiFi 在中場休息期間故障。您需要在兩分鐘內證明網路沒有問題。您會使用什麼遙測數據?
提示:您需要故障發生確切時刻的歷史健康狀況證明。
查看標準答案
從持續的主動模擬測試中調出歷史數據。向營運總監展示儀表板,確認在整整 15 分鐘的中場休息期間,AP 均成功解析了 DNS,並以低延遲連線至票務伺服器的 IP 位址。這立即證明了無線網路狀態良好,並將調查方向轉移到票務應用程式伺服器,後者很可能在瞬間的流量負載下崩潰了。
繼續閱讀本系列
為多租戶辦公大樓設計 WiFi 網路
本指南為 IT 經理、網路架構師和 CTO 提供了一個中立於廠商的藍圖,用於在多租戶辦公大樓中設計可擴展、安全且隔離的 WiFi 網路。內容涵蓋 IEEE 802.1Q 下的 VLAN 劃分、透過 802.1X 和 RADIUS 進行的動態 VLAN 分配、高密度環境的 RF 規劃,以及 GDPR 和 PCI-DSS 下的合規性考量。場地營運商和建築經理將獲得實用的架構指導、真實案例研究,以及在部署前需要避免的配置陷阱。
共用 WiFi 基礎設施的法律與合規性要求
本具權威性的技術參考指南概述了部署和管理共用 WiFi 基礎設施的重要法律、法規和架構要求。它為 IT 經理、網路架構師和場所營運商提供了實用的框架,以確保利用企業標準來實現強大的數據保護、嚴格的付款安全合規性以及高效能的租戶隔離。
共享工作空間中的頻寬管理與服務品質 (QoS)
專為 IT 經理、網路架構師和場地營運總監編寫的權威技術參考指南,旨在於共享工作空間環境中實施強健的頻寬管理與服務品質 (QoS) 框架。本指南詳細介紹了網路分段、流量優先順序設定、品牌中立的配置以及實際的 ROI 指標,以提供企業級的連線服務。內容涵蓋 IEEE 802.11e/WMM 標準、VLAN 設計、單一使用者速率限制,以及具備可衡量業務成果的疑難排解策略。