O que é o WiFi Analytics? Um Guia Completo
This complete technical guide explains how WiFi analytics transforms standard network infrastructure into a business intelligence engine, covering data capture mechanisms (footfall, dwell time, device type, repeat visits), architectural considerations, and measurable ROI. It is designed for IT managers, network architects, and venue operations directors who need to evaluate and deploy WiFi analytics in enterprise environments.
Ouça este guia
Ver transcrição do podcast
📚 Part of our core series: Marketing & Analytics Platform →
Resumo Executivo
Para os espaços empresariais modernos, fornecer Guest WiFi já não é simplesmente um centro de custos ou uma utilidade esperada — é uma camada de infraestrutura crítica para a inteligência de negócio. O WiFi Analytics é o processo de captura, processamento e visualização de dados gerados por dispositivos que se ligam ou sondam uma rede sem fios. Para gestores de TI, arquitetos de redes e diretores de operações de espaços, a implementação de uma solução de análise robusta preenche a lacuna entre as despesas de TI e o valor de negócio mensurável.
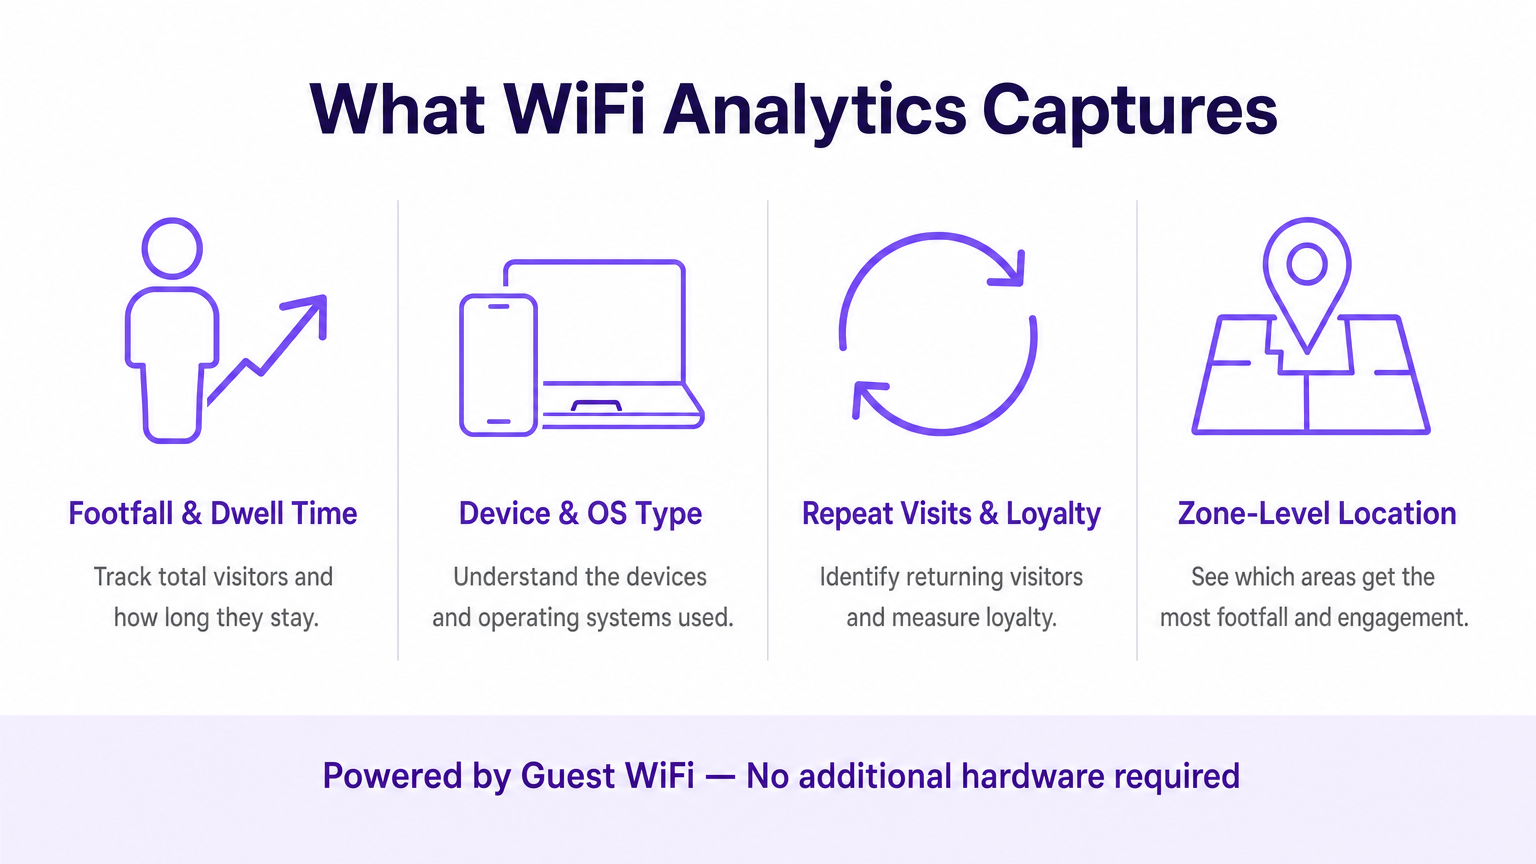
Este guia detalha a arquitetura técnica da recolha de dados WiFi, as métricas específicas capturadas — incluindo tráfego de pessoas (footfall), tempo de permanência, tipo de dispositivo e visitas repetidas — e os pontos de integração necessários para transformar a telemetria de rede bruta em insights acionáveis. Ao tirar partido da infraestrutura existente, quer seja implementada no Retalho , Saúde , Hotelaria ou Transportes , as organizações podem obter uma visibilidade profunda dos espaços físicos sem implementar redes de sensores sobrepostas dispendiosas.
Análise Técnica Aprofundada: Como Funciona o WiFi Analytics
Na sua essência, o WiFi analytics baseia-se no comportamento fundamental dos dispositivos clientes 802.11. Mesmo antes de um utilizador se autenticar numa rede, o seu dispositivo transmite pedidos de sondagem (probe requests) para descobrir pontos de acesso (APs) disponíveis. Estas tramas de gestão, combinadas com os dados gerados durante as sessões autenticadas, formam os dois fluxos de dados principais que uma plataforma de WiFi analytics processa.
Os Mecanismos de Captura de Dados
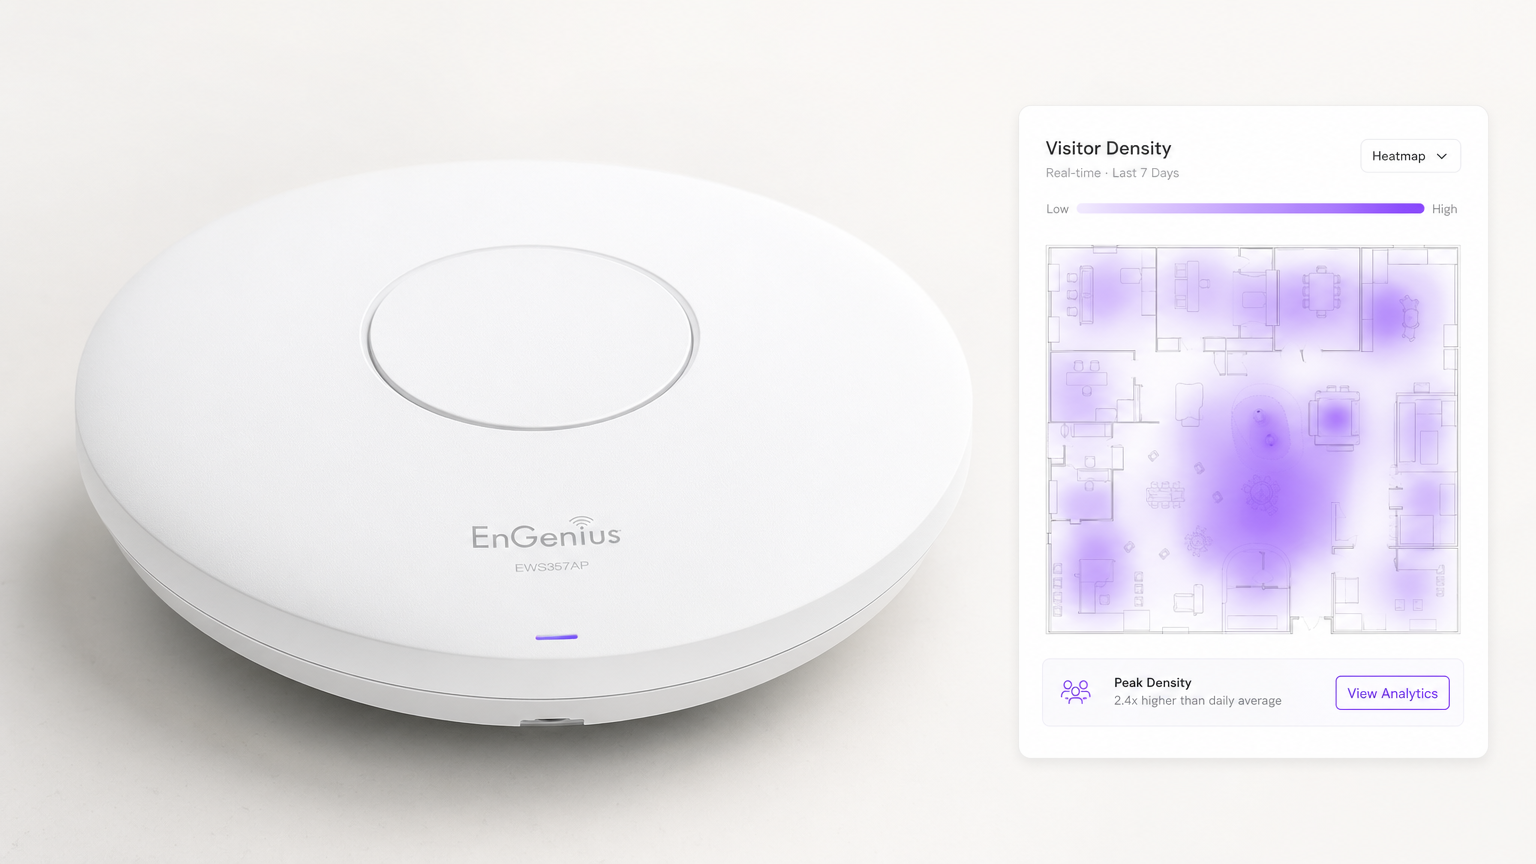
Análise de Presença (Não Autenticada): Quando um smartphone tem o WiFi ativado, envia periodicamente pedidos de sondagem contendo o seu endereço MAC e a força do sinal (RSSI). Os pontos de acesso detetam estas sondagens. Ao triangular o RSSI através de múltiplos APs, o sistema calcula a localização aproximada do dispositivo dentro de um espaço. Isto fornece métricas de base de tráfego e conversão — transeuntes versus visitantes ativos — sem exigir qualquer interação do utilizador.
Análise Autenticada: Quando um utilizador se liga ativamente ao Captive Portal, o motor de análise captura dados primários (first-party data) ricos. Isto inclui tipicamente informações demográficas, detalhes de contacto e identificadores de CRM, preenchendo a lacuna entre um endereço MAC anónimo e um perfil de cliente conhecido e persistente. Esta é a camada de dados que permite o marketing personalizado e os programas de fidelização.
Serviços de Localização (RTLS): As implementações avançadas utilizam técnicas como a Diferença de Tempo de Chegada (TDOA) ou a Medição de Tempo Fino (802.11mc/802.11az) para fornecer um posicionamento interior altamente preciso, frequentemente aumentado por beacons Bluetooth Low Energy (BLE). Para uma análise detalhada destas tecnologias de posicionamento, consulte o nosso Guia de Sistemas de Posicionamento Interior: UWB, BLE e WiFi .
Arquitetura e Integração
A arquitetura envolve tipicamente hardware de edge — controladores LAN sem fios e APs — que reencaminham dados de telemetria via API ou syslog para um motor de análise baseado na cloud. A plataforma ingere este fluxo de dados de alta velocidade, normaliza-o e aplica algoritmos de mapeamento espacial em plantas baixas carregadas para produzir análises ao nível da zona.
Crucialmente, o sistema deve integrar-se de forma perfeita com a stack do fornecedor de rede existente. Quer esteja a avaliar Purple vs Cisco Spaces (DNA Spaces): Quando Escolher Cada Um ou a implementar em Aruba, Ruckus ou Meraki, a plataforma de análise atua como uma sobreposição (overlay) — extraindo valor sem exigir a substituição de hardware. Esta é uma distinção fundamental em relação às soluções proprietárias baseadas em sensores.
O pipeline de dados segue este fluxo: os APs capturam pedidos de sondagem e eventos de ligação → o controlador WLAN agrega e reencaminha a telemetria → o motor de análise normaliza e mapeia os dados → o dashboard apresenta insights às equipas de operações e marketing → os webhooks da API enviam perfis de utilizadores autenticados para plataformas de CRM e automação de marketing.
Considerações sobre Normas e Conformidade
As implementações devem ter em conta várias normas regulamentares e técnicas:
| Norma | Relevância |
|---|---|
| IEEE 802.11ax (Wi-Fi 6/6E) | Fornece as funcionalidades OFDMA e BSS Colouring que melhoram a densidade de APs e a precisão da localização |
| IEEE 802.11mc / 802.11az | A Medição de Tempo Fino (FTM) permite uma precisão de alcance sub-métrica para implementações RTLS |
| WPA3-Enterprise | Obrigatório para implementações que lidam com dados sensíveis; fornece o modo de segurança de 192 bits |
| GDPR / UK GDPR | Exige consentimento explícito e auditável antes de capturar dados pessoais através do Captive Portal |
| PCI DSS | O tráfego de Guest WiFi deve ser isolado das redes de cartões de pagamento através de VLANs dedicadas |
| CCPA | Aplica-se a implementações que servem residentes da Califórnia; exige mecanismos de autoexclusão (opt-out) |
Guia de Implementação
A implementação de uma solução de WiFi analytics requer uma coordenação cuidadosa entre a engenharia de redes e os stakeholders do negócio. Os passos seguintes representam uma framework de implementação neutra em relação ao fornecedor.
Passo 1 — Avaliação da Prontidão da Rede: Avalie a densidade e a colocação atuais dos APs face aos requisitos de análise de localização. O design de cobertura padrão (APs centrados nas salas) é insuficiente para uma triangulação precisa. A colocação perimetral dos APs é essencial. Realize um site survey ativo utilizando ferramentas como o Ekahau ou o iBwave para identificar zonas mortas de RF e fontes de interferência.
Passo 2 — Mapeamento da Planta Baixa: Carregue plantas baixas precisas e à escala para a plataforma de análise. Defina zonas que se alinhem com os objetivos de negócio — por exemplo, 'Área de Checkout', 'Zona de Topo de Gôndola Promocional' ou 'Lobby'. O dimensionamento impreciso da planta baixa é uma das causas mais comuns de má qualidade dos dados de localização.
Passo 3 — Configuração do Captive Portal: Desenhe o fluxo de autenticação para equilibrar a experiência do utilizador com a aquisição de dados. Implemente opções de login social (Google, Apple ID) para reduzir a fricção. Garanta que o portal é totalmente responsivo em todos os tipos de dispositivos. A Purple pode atuar como um fornecedor de identidade para o OpenRoaming sob a licença Connect, permitindo um onboarding contínuo para utilizadores recorrentes sem interações repetidas com o portal.
Passo 4 — Framework de Consentimento e Privacidade: Implemente a captura de consentimento em conformidade com o GDPR. O consentimento deve ser granular (opt-ins separados para análise, marketing e partilha com terceiros), explícito (sem caixas pré-selecionadas) e auditável (registos com carimbo de data/hora armazenados por perfil de utilizador).
Passo 5 — Integração de Dados: Configure webhooks e integrações de REST API para enviar dados de utilizadores autenticados para plataformas de CRM (Salesforce, HubSpot) e ferramentas de automação de marketing (Marketo, Klaviyo). Este passo é onde a implementação de TI permite diretamente o ROI de marketing e é frequentemente despriorizado — não permita que isso aconteça.
Passo 6 — Alertas e Relatórios: Configure alertas operacionais (por exemplo, limites de tempo de permanência que acionam notificações para o staff) e relatórios automatizados para stakeholders não técnicos. Dados que permanecem num dashboard de TI não geram valor de negócio.
Melhores Práticas
Mitigação da Aleatorização de MAC: Os sistemas operativos modernos (iOS 14+, Android 10+) utilizam endereços MAC aleatórios por rede. As plataformas de análise devem basear-se em sessões autenticadas e algoritmos de costura comportamental (behavioural stitching) em vez de endereços de hardware persistentes para o rastreio de visitantes recorrentes. Priorize as taxas de autenticação do Captive Portal como um KPI.
Densidade de APs para Precisão de Localização: É necessário um mínimo de três APs com cobertura sobreposta para uma triangulação básica. Para uma precisão inferior a 3 metros, implemente APs em intervalos de 8 a 10 metros em zonas de alto valor. Para RTLS sub-métrico, complemente com beacons BLE ou implemente hardware compatível com 802.11az.
Segmentação de Rede: Isole o tráfego de Guest WiFi das redes corporativas e de pagamento utilizando VLANs dedicadas, ACLs de firewall e filtragem de DNS. Isto é inegociável para a conformidade com o PCI DSS e reduz significativamente a superfície de ataque.
Governança de Dados: Estabeleça uma política clara de retenção de dados. A maioria dos casos de uso de análise é bem servida por 13 meses de dados (permitindo a comparação ano a ano). Períodos de retenção mais longos aumentam o risco de conformidade e os custos de armazenamento sem um benefício analítico proporcional.
Resolução de Problemas e Mitigação de Riscos
Dados de Localização Imprecisos: Mais frequentemente causados por densidade insuficiente de APs, dimensionamento incorreto da planta baixa ou interferência de RF de redes adjacentes. Valide a colocação dos APs face ao site survey, verifique a escala da planta baixa na plataforma de análise e utilize as ferramentas de análise de espetro no seu controlador WLAN para identificar fontes de interferência.
Baixas Taxas de Autenticação: Se os visitantes não estiverem a concluir o Captive Portal, audite a jornada do utilizador. Meça a desistência em cada passo. As causas comuns incluem tempos de carregamento lentos do portal (otimize para mobile em ligações de fallback 3G/4G), campos de dados excessivos e propostas de valor pouco claras. Faça testes A/B ao design do portal.
Silos de Dados: O modo de falha mais prejudicial a nível comercial. Crie proativamente relatórios automatizados para as equipas de operações e marketing. Estabeleça um grupo de trabalho multifuncional de 'Dados WiFi' com representantes de TI, marketing e operações para rever os insights mensalmente.
Dependência do Fornecedor (Vendor Lock-In): Evite plataformas de análise que exijam hardware proprietário. Certifique-se de que a plataforma suporta o seu fornecedor de AP existente através de APIs padrão e pode exportar dados em formatos abertos (CSV, JSON) para evitar a dependência do ecossistema de um único fornecedor.
ROI e Impacto no Negócio
A medida final de uma implementação de WiFi analytics é a sua contribuição para os resultados do negócio. A framework seguinte mapeia as capacidades de análise para KPIs mensuráveis.
| Capacidade de Análise | KPI de Negócio | Melhoria Típica |
|---|---|---|
| Contagem de tráfego (Footfall) | Rastreio do volume de visitantes | Substitui a contagem manual; precisão superior a 99% |
| Tempo de permanência por zona | Gestão de filas, alocação de staff | Redução de 15–25% nos tempos de espera em horas de ponta |
| Taxa de visitas repetidas | Medição da fidelização de clientes | Linha de base para o ROI do programa de fidelização |
| Taxa de conversão espacial | Conversão de montra para porta | Informa o investimento em expositores exteriores |
| Perfis autenticados | Enriquecimento de CRM, segmentação de campanhas | Melhoria de 3–5x na relevância das campanhas de email |
| Análise de fluxo de zonas | Otimização do layout | Aumento mensurável nos gastos secundários |
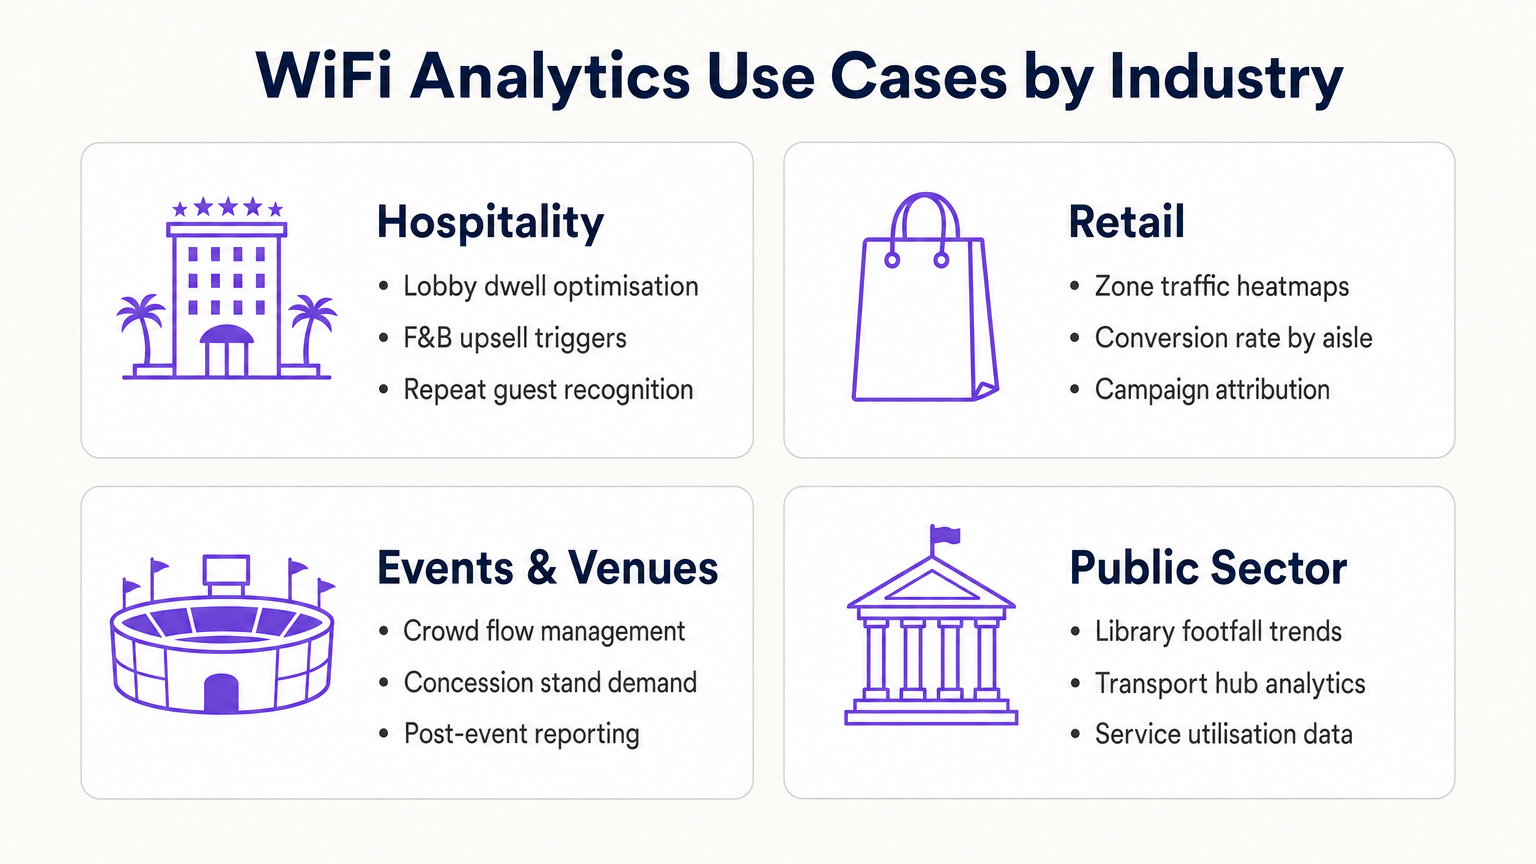
Para os operadores de Hotelaria , o WiFi analytics permite o reconhecimento de hóspedes recorrentes, a gestão do congestionamento do lobby e gatilhos de upsell de F&B (Alimentação e Bebidas). Para as cadeias de Retalho , fornece otimização de layout baseada em mapas de calor (heatmaps) e atribuição de campanhas. Para centros de transportes e espaços do setor público, fornece dados de utilização de serviços e gestão do fluxo de multidões. Para uma visão detalhada das aplicações em espaços conectados, consulte o nosso Guia Completo de Arquitetura da Internet das Coisas .
Ao tratar a rede WiFi como um ativo de dados estratégico em vez de uma utilidade, os líderes de TI transitam de gestores de centros de custos para facilitadores de negócios — entregando um ROI concreto através de uma maior eficiência operacional, melhor envolvimento do cliente e tomada de decisões baseada em evidências.
Definições Principais
Probe Request
An 802.11 management frame broadcast by a client device to discover available wireless networks in its vicinity, containing the device's MAC address and supported data rates.
The foundational mechanism for unauthenticated presence analytics. Access points capture these frames to detect and locate devices before any user interaction occurs.
RSSI (Received Signal Strength Indicator)
A measurement of the power level of a received radio signal, expressed in dBm (typically ranging from 0 to -100 dBm).
Analytics platforms use RSSI readings from multiple APs simultaneously to triangulate a device's physical location. Lower (more negative) values indicate greater distance from the AP.
MAC Address Randomisation
A privacy feature in modern operating systems (iOS 14+, Android 10+) that assigns a randomised hardware address to a device on a per-network basis, replacing the device's permanent MAC address.
Significantly limits the reliability of unauthenticated presence analytics for repeat visitor tracking, making captive portal authentication essential for building persistent customer profiles.
Captive Portal
A web-based authentication interface that intercepts a user's HTTP/HTTPS traffic and redirects them to a login or registration page before granting network access.
The primary mechanism for capturing first-party customer data and securing GDPR-compliant consent. Portal design and friction level directly determine data capture rates.
Dwell Time
The duration a specific authenticated or detected device remains within a defined physical zone, measured from first detection to last detection within that zone.
A critical operational metric used to identify queue congestion, measure engagement with promotional displays, and trigger time-based marketing automations.
Footfall
The total count of unique devices detected within a defined venue or zone over a specified time period.
Provides the baseline traffic metric analogous to website sessions. Used to measure overall venue performance, compare locations, and calculate spatial conversion rates.
Spatial Conversion Rate
The percentage of devices detected in an outer zone (e.g., a street or main walkway) that subsequently enter an inner zone (e.g., a store or aisle).
Used by retail operators to evaluate the effectiveness of exterior displays and entrance signage. A low conversion rate despite high footfall indicates an attraction problem at the threshold.
OpenRoaming
A Wireless Broadband Alliance (WBA) federation standard that enables seamless, secure Wi-Fi onboarding across participating networks without requiring repeated captive portal interactions.
Purple can act as an identity provider for OpenRoaming under the Connect licence, enabling venues to offer seamless connectivity while retaining the ability to capture analytics data from returning users.
RTLS (Real-Time Location System)
A system that uses radio frequency technologies (WiFi, BLE, UWB, or RFID) to determine and track the real-time location of objects or people within a defined space.
Relevant when sub-3-metre location accuracy is required — for example, asset tracking in healthcare or turn-by-turn indoor navigation in large venues. Standard WiFi RSSI triangulation is typically insufficient for these use cases.
TDOA (Time Difference of Arrival)
A location technique that calculates position by measuring the difference in the time a signal arrives at multiple reference points (APs or anchors).
Provides significantly higher location accuracy than RSSI-based triangulation, but requires hardware support and precise clock synchronisation across APs.
Exemplos Práticos
A 400-room resort hotel wants to reduce congestion at check-in desks during peak hours (15:00–17:00) and increase revenue at the lobby bar. The IT team has a Cisco Meraki deployment with 24 APs across the ground floor.
- Map the lobby floor plan in the analytics platform with three distinct zones: 'Check-In Queue', 'Lobby Seating', and 'Bar Area'. Verify that at least three APs provide overlapping coverage in each zone for accurate triangulation.
- Configure a real-time operational alert: if the device count in the 'Check-In Queue' zone exceeds 20 simultaneously AND average dwell time exceeds 15 minutes, trigger an automated SMS to the Duty Manager via the platform's webhook integration.
- Configure a marketing trigger: if a device dwells in the 'Lobby Seating' zone for more than 10 minutes, push a personalised notification (via the captive portal session or email if authenticated) offering a 10% discount at the bar, valid for 30 minutes.
- Integrate the authenticated user profiles with the hotel PMS (Property Management System) to automatically recognise returning guests and suppress the captive portal for them, surfacing a personalised welcome message instead.
- Review weekly dwell time reports to identify whether the check-in queue alert is triggering at consistent times, enabling proactive staffing adjustments rather than reactive responses.
A 50-store retail chain has deployed WiFi analytics across all locations. The Head of Merchandising reports that a specific promotional aisle in their flagship Manchester store generates high footfall but below-average sales per square foot. They want to understand why before rolling out the same layout to 15 other stores.
- Define two zones in the analytics platform for the Manchester store: 'Main Walkway' (the primary traffic artery adjacent to the aisle) and 'Promotional Aisle' (the target zone).
- Pull a 30-day report comparing: (a) the spatial conversion rate — the percentage of devices in the Main Walkway that subsequently enter the Promotional Aisle — and (b) the average dwell time within the Promotional Aisle for devices that do enter.
- Scenario A — High conversion, low dwell time: Visitors are entering the aisle but leaving quickly. This indicates the product placement or signage within the aisle is confusing or unappealing once inside. Recommendation: redesign the aisle layout and test with a 14-day A/B comparison.
- Scenario B — Low conversion despite high walkway traffic: Visitors are not being drawn into the aisle from the walkway. This indicates the end-cap display or entrance signage is ineffective. Recommendation: redesign the entrance display and measure conversion rate change over the following 14 days.
- Correlate the WiFi analytics data with POS transaction data by time-of-day to identify whether dwell time correlates with purchase probability, establishing a venue-specific 'engagement threshold' for future campaign design.
Perguntas de Prática
Q1. A retail client reports that their 'Repeat Visitor' metric has dropped by 40% over the past eight months, despite sales remaining steady and no significant change in marketing activity. Their analytics deployment relies entirely on unauthenticated presence tracking. What is the most likely technical cause, and what is the recommended remediation?
Dica: Consider the timeline of major mobile OS updates and their privacy features.
Ver resposta modelo
The most likely cause is the progressive adoption of MAC address randomisation across the client's customer base. iOS 14 (released September 2020) and Android 10+ introduced per-network MAC randomisation, causing returning devices to appear as new, unique visitors to presence analytics engines. As the proportion of customers running these OS versions has increased, the repeat visitor metric has degraded. The remediation is to implement a captive portal authentication layer. When users authenticate with a persistent identifier (email address, social login), the analytics platform can build a customer profile tied to that identifier rather than the rotating MAC address. This restores repeat visitor tracking accuracy and simultaneously generates first-party marketing data.
Q2. You are the network architect for a new 80,000-seat stadium. The venue operations team wants WiFi analytics to manage crowd flow through concourse areas and identify concession stand congestion in real time. The IT budget allows for 400 APs. How should you prioritise AP placement to maximise analytics accuracy, and what accuracy level can you realistically expect?
Dica: Think about the geometric requirements of triangulation and the difference between coverage and analytics design principles.
Ver resposta modelo
Prioritise perimeter placement over central coverage. For each concourse zone, ensure APs are placed at the zone boundaries rather than the centre. This enables the analytics engine to accurately determine when a device crosses from one zone to another. Aim for a minimum of three APs with overlapping coverage in each defined zone, with AP spacing of 8–10 metres in high-priority areas (concession stands, entry/exit gates). With standard RSSI triangulation on 802.11ax hardware, expect 3–5 metre location accuracy in open concourse areas. For sub-3-metre accuracy at specific chokepoints (e.g., individual concession windows), supplement with BLE beacons or deploy 802.11az-capable APs at those locations.
Q3. A hospital IT director wants to use the existing WiFi network to track the location of 200 high-value mobile medical assets (infusion pumps, portable ECG monitors). They do not want to deploy any additional hardware. The analytics platform currently provides 5-metre RSSI triangulation accuracy. Is this deployment viable, and what are the key risks?
Dica: Consider both the technical accuracy requirements and the behaviour of the devices being tracked.
Ver resposta modelo
This deployment is not reliably viable for two reasons. First, medical equipment frequently enters low-power or sleep states, causing the device to stop broadcasting WiFi probe requests. When a device is not actively probing, it is invisible to the presence analytics engine. This creates gaps in tracking that are unacceptable for asset management. Second, 5-metre RSSI accuracy is insufficient to determine whether an asset is in Room 4A or Room 4B in a typical hospital ward layout. The recommended alternative is a dedicated RTLS solution using active RFID tags or BLE beacons attached to the assets, which actively broadcast at regular intervals regardless of the asset's power state, and which can achieve sub-2-metre accuracy. The existing WiFi infrastructure can serve as the receiver network for BLE beacons, avoiding the need for a completely separate sensor network.
Continue a ler esta série
Privacidade por Design: Anonimização de Dados WiFi para Conformidade com o GDPR
Este guia autorizado detalha a arquitetura técnica e as estratégias de implementação para anonimizar dados WiFi para garantir a conformidade com o GDPR. Fornece a líderes de TI e arquitetos de rede estruturas acionáveis para equilibrar análises robustas de locais com requisitos rigorosos de privacidade de dados.
Heatmapping vs. Análise de Presença: Diferenças Técnicas
Este guia técnico e autoritário detalha as diferenças arquitetónicas e operacionais críticas entre o heatmapping WiFi e a análise de presença para operadores de espaços empresariais. Fornece a líderes de TI, arquitetos de rede e diretores de operações estruturas de implementação acionáveis, cenários de implementação reais e melhores práticas neutras em relação a fornecedores para extrair o máximo ROI da sua infraestrutura sem fios existente.
Como Calcular o Tempo de Permanência Usando Análise de Localização WiFi
Este guia fornece uma referência técnica abrangente para o cálculo do tempo de permanência wifi usando análise de localização WiFi, cobrindo a arquitetura completa desde a captura de pedidos de sonda 802.11, passando pela trilateração baseada em RSSI, até à análise de zonas georreferenciadas. É concebido para gestores de IT, arquitetos de rede e diretores de operações de espaços que necessitam de implementar inteligência de localização precisa e escalável em ambientes de retalho, hotelaria, saúde e setor público. Os leitores obterão orientações de implementação acionáveis, estudos de caso reais e uma estrutura clara para traduzir dados espaciais brutos em resultados de negócio mensuráveis.