Passagier-WiFi: Wie Transportunternehmen WiFi-Daten nutzen, um Reisen zu verstehen
Dieser technische Leitfaden erklärt, wie Transportunternehmen die Passagier-WiFi-Infrastruktur nutzen, um Betriebsanalysen zu erfassen. Er behandelt die technische Architektur, Best Practices für die Bereitstellung und reale Anwendungen zur Messung von Besucherfrequenz, Verweildauer und Reisemustern.
Diesen Leitfaden anhören
Podcast-Transkript ansehen

Executive Summary
Für Transportunternehmen – ob sie Intercity-Bahnnetze, städtische Busflotten oder maritime Fährdienste verwalten – wird Passagier-WiFi oft ausschließlich als Betriebskosten oder als Annehmlichkeit für Passagiere betrachtet. Wenn diese bestehende Infrastruktur jedoch mit einer Analyseebene auf Unternehmensniveau integriert wird, verwandelt sie sich in ein leistungsstarkes Tool für operative Intelligenz. Durch die Erfassung von Geräteverbindungsmetadaten können Betreiber die Besucherfrequenz von Passagieren abbilden, Verweildauern in Bahnhofsbereichen messen und Reisemuster verfolgen, ohne sich ausschließlich auf Ticketdaten verlassen zu müssen.
Dieser Leitfaden bietet IT-Managern, Netzwerkarchitekten und Betriebsleitern einen praktischen Rahmen für die Bereitstellung und Nutzung von Passagier-WiFi-Analysen. Wir untersuchen die zugrunde liegende technische Architektur, die zur sicheren Erfassung von Gerätesignalen erforderlich ist, die operativen Anwendungsfälle, die einen messbaren ROI liefern, und die Compliance-Anforderungen, die für die Verarbeitung dieser Daten innerhalb von GDPR- und Datenschutzrahmenwerken notwendig sind.
Hören Sie sich unser Briefing des Senior Consultants zu diesem Thema an:
Technical Deep-Dive: Architektur und Datenfluss
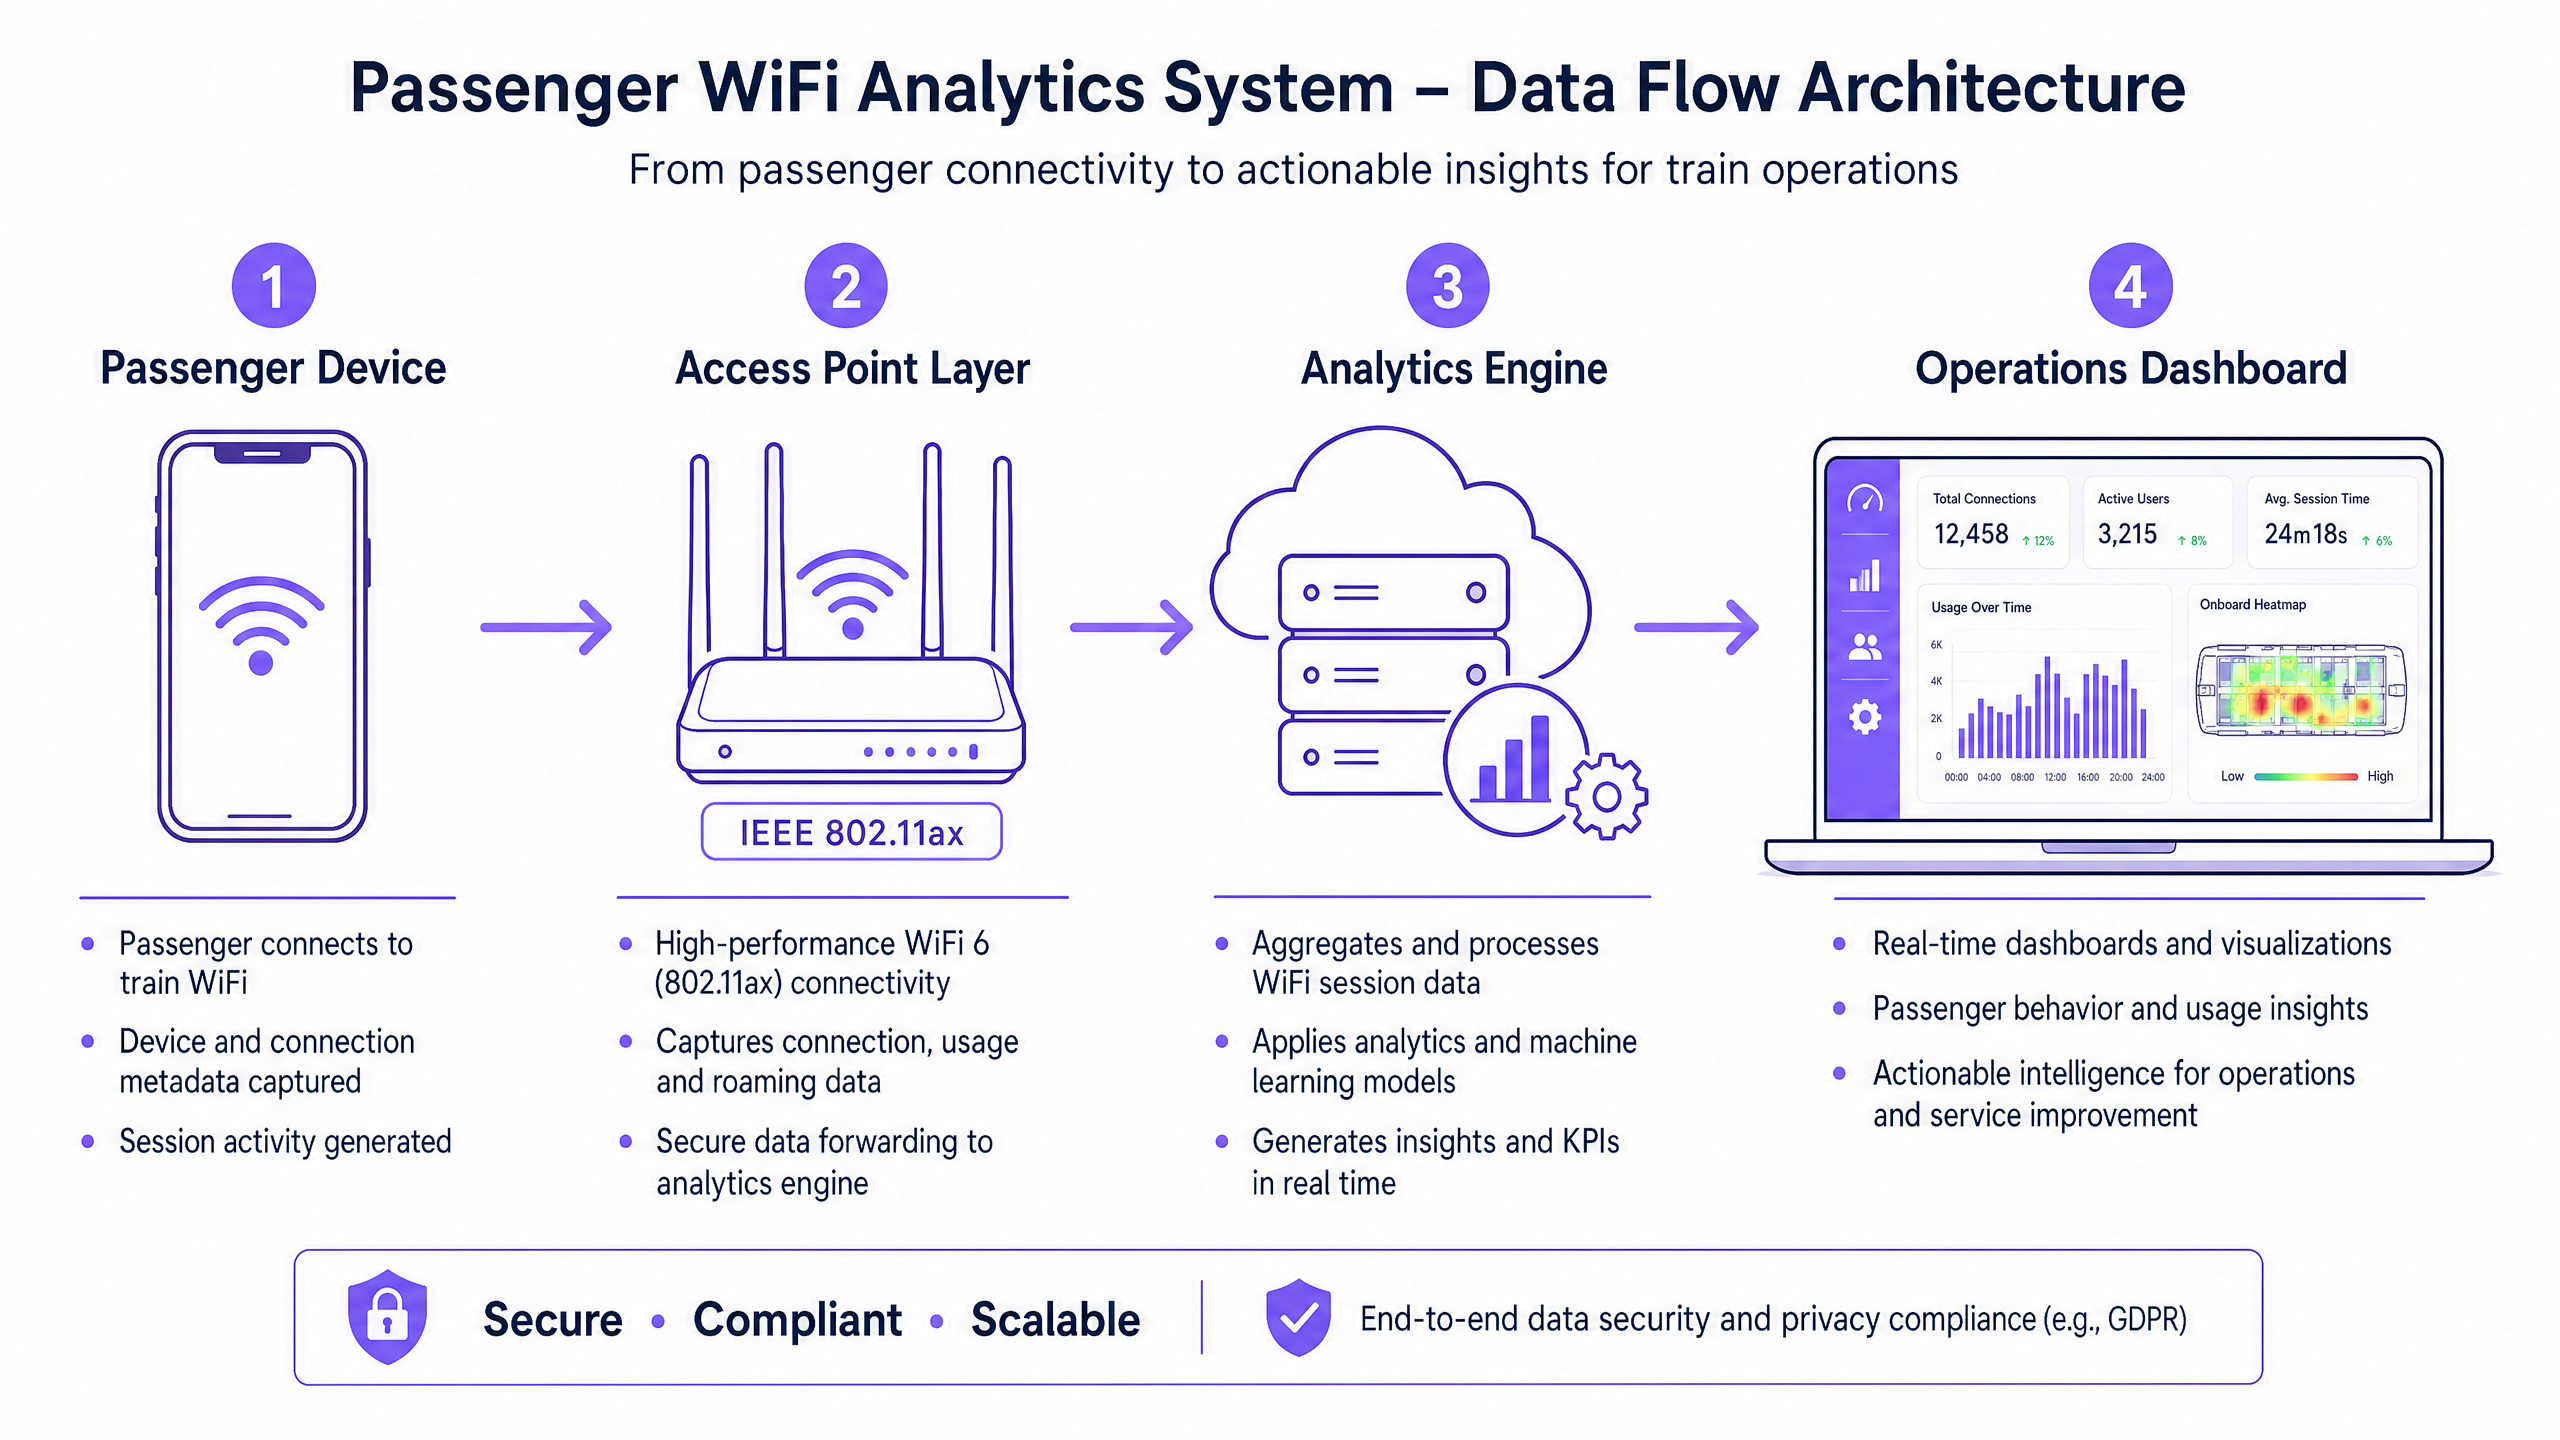
Die Grundlage jeder Passagier-WiFi-Analysefähigkeit ist die Fähigkeit des Netzwerks, Gerätemetadaten sicher zu erfassen und zu verarbeiten. Die Architektur besteht typischerweise aus vier Kernschichten:
- Access Point Layer (Edge): Physische Hardware, die in Bahnhöfen und auf Rollmaterial eingesetzt wird. Moderne Implementierungen, die IEEE 802.11ax (WiFi 6) nutzen, bieten eine hohe Client-Dichte und erfassen wesentliche Metadaten, einschließlich MAC addresses, Signalstärke (RSSI) und Verbindungszeitstempel.
- Data Collection Layer (Controller): Ein zentralisierter, Cloud-verwalteter Controller aggregiert Roh-Sitzungsprotokolle und Roaming-Übergaben von der Access Point Layer.
- Analytics Engine: Plattformen wie Purple's WiFi Analytics verarbeiten die Rohprotokolle, wenden Machine-Learning-Modelle an, um Mitarbeitergeräte und transiente Signale herauszufiltern, und wandeln Rohdaten in aussagekräftige Metriken (z. B. Verweildauer, Besucherfrequenz) um.
- Operations Dashboard: Die Visualisierungsebene, auf der Netzwerkplaner und Bahnhofsmanager Erkenntnisse über Echtzeit-Dashboards und Heatmaps konsumieren.
Überwindung der MAC Randomisation
Eine kritische technische Herausforderung in der modernen WiFi-Analyse ist die MAC address randomisation. Seit iOS 14 und Android 10 randomisieren Geräte ihre MAC addresses pro Netzwerk, um den Datenschutz zu verbessern. Dies hat zwar keine Auswirkungen auf aggregierte Besucherfrequenz- oder Verweildauermetriken (da die Sitzung während eines einzelnen Besuchs konsistent bleibt), schränkt jedoch die Möglichkeit ein, wiederkehrende Besucher anonym über die Zeit zu verfolgen.
Die architektonische Lösung ist authentifiziertes Guest WiFi . Indem Benutzer durch ein captive portal geleitet werden, das eine Authentifizierung (z. B. E-Mail oder Social Login) erfordert, erstellt das System ein persistentes, zugestimmtes Benutzerprofil. Dieses Profil verankert die Sitzungsdaten an einem bekannten Benutzer, um die Einschränkungen der MAC randomisation zu umgehen und gleichzeitig die strikte Einhaltung der Datenschutzbestimmungen zu gewährleisten.
Implementation Guide: Von der Infrastruktur zu den Erkenntnissen
Die Bereitstellung von Passagier-WiFi-Analysen erfordert einen strukturierten Ansatz, um Datengenauigkeit und Netzwerksicherheit zu gewährleisten.
- Umfassende RF Audits durchführen: Die Genauigkeit der Analysen hängt vollständig von der Netzabdeckung ab. Funklöcher in Bahnhofshallen oder auf Bahnsteigen führen zu abgebrochenen Sitzungen und fragmentierten Reisedaten. Führen Sie gründliche RF site surveys durch, um eine durchgehende Abdeckung in allen Passagierbereichen sicherzustellen.
- Datenintegration standardisieren: Transportnetze weisen oft heterogene Hardware auf (z. B. Cisco Meraki in Bahnhöfen, verschiedene Anbieter auf Rollmaterial). Implementieren Sie eine herstellerunabhängige API-Schicht, um Sitzungsprotokolle zu normalisieren, bevor sie die Analyse-Engine erreichen.
- Robuste Sicherheitskontrollen implementieren: Passagierorientierte Netzwerke sind Hochrisiko-Angriffsflächen. Erzwingen Sie WPA3, wo die Client-Kompatibilität dies zulässt, implementieren Sie eine strikte Client-Isolation (Layer 2 isolation), um seitliche Bewegungen zwischen Passagiergeräten zu verhindern, und setzen Sie DNS filtering ein, um bösartige Domains zu blockieren. Weitere Informationen zur Sicherung dieser Umgebungen finden Sie in unserem Leitfaden Protect Your Network with Strong DNS and Security .
- Zonale Architektur definieren: Segmentieren Sie Ihre physischen Standorte in logische Zonen (z. B. Halle, Einzelhandelsbereich, Bahnsteig). Dies ermöglicht eine granulare Verweildaueranalyse, die es Betreibern erlaubt, zwischen einem Passagier, der in einem Einzelhandelsbereich stöbert, und einem, der auf einem Bahnsteig während einer Dienstverzögerung wartet, zu unterscheiden.
Best Practices und operative Anwendungsfälle
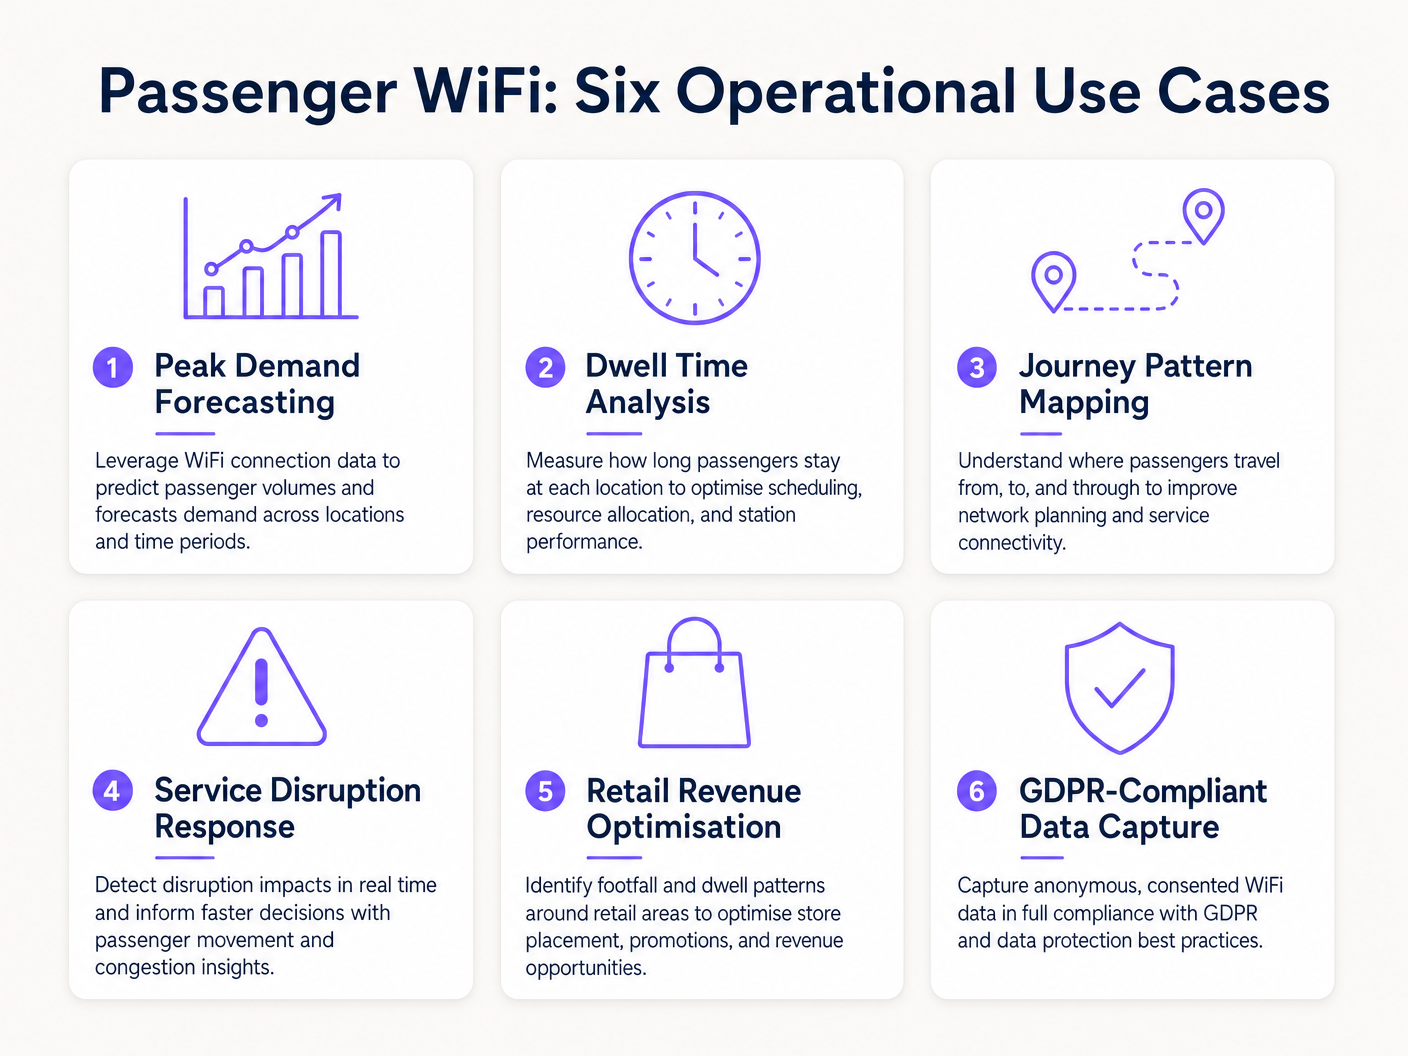
Transportunternehmen nutzen WiFi analytics, um die Effizienz in verschiedenen operativen Bereichen zu steigern. Ähnlich wie Veranstaltungsorte im Retail und Hospitality Besucherfrequenzdaten zur Personaloptimierung nutzen, verwenden Transportunternehmen diese Erkenntnisse zur Bewältigung von Spitzenlasten.
Real-World Case Study: Intercity Rail Network
Ein großer britischer Intercity-Bahnnetzbetreiber implementierte WiFi analytics an zwölf Endbahnhöfen, um die Bahnsteigüberlastung zu beheben. Durch die Korrelation von WiFi-Verbindungsspitzen mit den Abfahrtszeiten der Züge stellte das Betriebsteam fest, dass bestimmte Bahnsteige 40 Minuten vor der Abfahrt gefährliche Überfüllung erlebtenDie Daten zeigten, dass Passagiere aufgrund unklarer digitaler Beschilderung in der Haupthalle früher als erwartet ankamen. Durch die Anpassung des Zeitpunkts der Bahnsteigansagen auf den Abfahrtstafeln glättete der Betreiber den Passagierfluss, reduzierte die Spitzenbelegung der Bahnsteige um 22 % und verbesserte die allgemeine Sicherheit.
Praxisbeispiel: Fährterminal-Betrieb
Ein regionaler Fährbetreiber, der hohes Sommerverkehrsaufkommen bewältigt, nutzte WiFi Dwell Time Analytics, um seine Einzelhandelsstrategie im Terminal zu optimieren. Das Analyse-Dashboard zeigte, dass Passagiere, die auf verspätete Überfahrten warteten, eine durchschnittliche Verweildauer von 45 Minuten im Terminal hatten, aber nur 12 % die sekundäre Einzelhandelszone betraten. Durch die Neupositionierung digitaler Beschilderung und das Auslösen automatischer Push-Benachrichtigungen über das captive portal, die einen Kaffeerabatt bei Verspätungen anboten, erhöhte der Betreiber die Einzelhandelskonversion bei Störungen um 18 %.
Fehlerbehebung & Risikominderung
Bei der Implementierung von Passagier-WiFi-Analysen müssen IT-Teams mehrere häufige Fehlerquellen mindern:
- Datenverwässerung durch Mitarbeitergeräte: Das Versäumnis, Mitarbeitergeräte (z. B. Reinigungspersonal, Verkaufspersonal) herauszufiltern, verzerrt die Verweildauer-Metriken erheblich. Implementieren Sie eine strikte MAC-Adressfilterung oder dedizierte SSIDs für Mitarbeiter, um sicherzustellen, dass die Passagierdaten sauber bleiben.
- Compliance-Verstöße: Das Erfassen von Gerätedaten ohne ausdrückliche Zustimmung oder eine dokumentierte Rechtsgrundlage verstößt gegen die GDPR. Stellen Sie sicher, dass Ihr captive portal die Datenverarbeitungsrichtlinie klar darlegt und bei Bedarf eine ausdrückliche Zustimmung einholt.
- Backhaul-Engpässe: Bordsysteme, die auf zellulares Backhaul (LTE/5G) angewiesen sind, leiden oft unter Bandbreitenbeschränkungen. Stellen Sie sicher, dass Ihre Architektur Analysedaten bei Verbindungsabbrüchen lokal puffert und asynchron synchronisiert, um Datenverlust zu vermeiden, ohne die Browsing-Geschwindigkeit der Passagiere zu beeinträchtigen.
ROI & Geschäftsauswirkungen
Der Return on Investment für Passagier-WiFi-Analysen reicht weit über die IT-Abteilung hinaus. Indem Betreiber das Netzwerk als Intelligenz-Asset behandeln, können sie:
- Ressourcenallokation optimieren: Personalbesetzung, Reinigungspläne und Sicherheitspatrouillen an Bahnhöfen an empirische Besucherdaten anpassen, anstatt an statische Fahrpläne.
- Einzelhandelsumsatz steigern: Einzelhandelsmietern genaue Besucher- und Konversionsmetriken bereitstellen, um Premium-Mietpreise in hochfrequentierten Zonen zu rechtfertigen.
- Passagiererlebnis verbessern: Reibungspunkte auf der Reise im Bahnhof identifizieren und Überfüllung proaktiv managen, ähnlich wie der Healthcare -Sektor ähnliche Technologie nutzt, um den Patientenfluss zu verstehen. Für den Kontext branchenübergreifender Anwendungen siehe How WiFi Can Improve Patient Experience in Hospitals .
Durch die Integration von WiFi-Analysen in die zentrale Betriebsstrategie können Transportbetreiber im Transport -Sektor von einem reaktiven Management zu einer proaktiven, datengesteuerten Servicebereitstellung übergehen.
Schlüsseldefinitionen
MAC Address Randomisation
A privacy feature in modern operating systems (iOS, Android) that generates a temporary, random MAC address for each WiFi network the device connects to.
IT teams must account for this as it prevents the tracking of repeat visitors using only hardware identifiers, necessitating captive portal authentication.
Dwell Time
The total duration a device remains connected or visible to the WiFi network within a specific physical zone.
Used by operations directors to measure how long passengers wait on platforms or spend in retail areas, directly impacting commercial and safety planning.
Captive Portal
A web page that users must view and interact with before being granted access to a public WiFi network.
The primary mechanism for capturing user consent, enforcing terms of service, and collecting first-party marketing data.
IEEE 802.11ax (WiFi 6)
The current standard for wireless networks, designed to improve performance in high-density environments.
Essential for transport hubs like stadiums and train stations where thousands of devices attempt to connect simultaneously.
RSSI (Received Signal Strength Indicator)
A measurement of the power present in a received radio signal.
Analytics engines use RSSI values from multiple access points to triangulate a device's physical location within a venue.
Client Isolation
A security feature that prevents devices connected to the same WiFi network from communicating directly with each other.
Critical for public passenger WiFi to prevent malicious actors from scanning or attacking other users' devices on the network.
Footfall
The total number of unique devices detected by the WiFi network within a specific timeframe.
Provides station managers with an accurate proxy for total passenger volume, independent of ticket sales.
Cellular Backhaul
The use of cellular networks (LTE/5G) to connect a local WiFi network (like on a bus or train) back to the internet.
The primary ongoing operational cost (OPEX) for onboard WiFi deployments, requiring careful bandwidth management.
Ausgearbeitete Beispiele
A major train station operator is experiencing severe congestion on Platform 4 during the evening peak. They need to understand where these passengers are originating from within the station (e.g., main concourse vs. retail zone) to improve flow.
- Deploy high-density IEEE 802.11ax access points across the concourse, retail zones, and Platform 4 to ensure contiguous coverage.
- Configure the analytics platform to define logical 'Zones' for each area.
- Analyse the 'Zone-to-Zone Transition' reports in the analytics dashboard during the 16:00-19:00 window.
- Identify the primary origin zones for devices arriving at Platform 4.
- If the data shows a bottleneck originating from the retail zone corridor, operations can deploy staff to redirect flow or update digital signage to route passengers through a secondary concourse entrance.
A regional bus operator wants to offer free onboard WiFi but needs to justify the cellular backhaul costs to the commercial director by capturing marketing data.
- Implement a cloud-managed captive portal for the onboard WiFi network.
- Configure the portal to require authentication via email or social login (e.g., Facebook, Google).
- Ensure the portal includes a clear, GDPR-compliant privacy notice and opt-in checkboxes for marketing communications.
- Integrate the captive portal data capture directly with the operator's CRM or email marketing platform via API.
- Track the volume of new marketing opt-ins generated per route and calculate the equivalent cost-per-acquisition (CPA) to justify the backhaul OPEX.
Übungsfragen
Q1. Your ferry terminal has deployed WiFi analytics, but the average dwell time in the main waiting lounge is reporting as 8.5 hours, which is impossible given your sailing schedule. What is the most likely cause and how do you fix it?
Hinweis: Consider what other devices might be permanently located in or near the waiting lounge.
Musterlösung anzeigen
The analytics engine is likely capturing static devices (e.g., smart TVs, digital signage, point-of-sale systems) or staff devices that remain in the lounge all day. The solution is to identify the MAC addresses of these known devices and configure the analytics platform to filter them out of the dataset.
Q2. A bus operator wants to track how many passengers travel the full length of a specific route versus hopping off early. They are relying purely on anonymous MAC address tracking from the onboard access point. Why might this data be inaccurate?
Hinweis: Think about how modern smartphones handle network connections to protect privacy.
Musterlösung anzeigen
Modern smartphones use MAC address randomisation. While connected to the bus WiFi, the session is tracked accurately. However, if a device disconnects (e.g., goes to sleep) and reconnects later on the route, it may present a new MAC address, making it appear as a new passenger rather than a continuing journey. Implementing a captive portal for authentication is required to track persistent journeys accurately.
Q3. You are deploying WiFi across a large train station with a high-density concourse. To ensure secure data capture and protect passengers, what two critical network security configurations must be enabled on the public SSID?
Hinweis: One prevents devices from talking to each other; the other prevents access to malicious sites.
Musterlösung anzeigen
- Client Isolation (Layer 2 isolation) must be enabled to prevent passenger devices from communicating with or attacking each other on the local network. 2. DNS Filtering should be deployed to block access to known malicious domains, phishing sites, and inappropriate content.
Weiterlesen in dieser Reihe
Privacy by Design: Anonymisierung von WiFi-Daten für die GDPR-Konformität
Dieser maßgebliche Leitfaden beschreibt die technische Architektur und Implementierungsstrategien zur Anonymisierung von WiFi-Daten, um die GDPR-Konformität sicherzustellen. Er bietet IT-Führungskräften und Netzwerkarchitekten umsetzbare Frameworks, um robuste Standortanalysen mit strengen Datenschutzanforderungen in Einklang zu bringen.
Heatmapping vs. Presence Analytics: Technische Unterschiede
Dieser maßgebliche technische Leitfaden beschreibt die entscheidenden architektonischen und operativen Unterschiede zwischen WiFi Heatmapping und Presence Analytics für Betreiber von Unternehmensstandorten. Er bietet IT-Führungskräften, Netzwerkarchitekten und Betriebsleitern umsetzbare Bereitstellungs-Frameworks, reale Implementierungsszenarien und herstellerneutrale Best Practices, um den maximalen ROI aus ihrer bestehenden drahtlosen Infrastruktur zu erzielen.
Wie man die Verweildauer mit WiFi Location Analytics berechnet
Dieser Leitfaden bietet eine umfassende technische Referenz zur Berechnung der WiFi-Verweildauer mittels WiFi Location Analytics. Er deckt die gesamte Architektur ab, von der Erfassung von 802.11 Probe Requests über die RSSI-basierte Trilateration bis zur Analyse von Geofence-Zonen. Er richtet sich an IT-Manager, Netzwerkarchitekten und Betriebsleiter von Veranstaltungsorten, die präzise, skalierbare Standortinformationen in Einzelhandel, Gastgewerbe, Gesundheitswesen und im öffentlichen Sektor implementieren müssen. Die Leser erhalten umsetzbare Implementierungsanleitungen, Fallstudien aus der Praxis und einen klaren Rahmen für die Umwandlung von Rohdaten in messbare Geschäftsergebnisse.