So erstellen Sie eine Customer Experience Strategie
Dieser technische Leitfaden bietet IT-Führungskräften, Netzwerkarchitekten und Direktoren für Veranstaltungsortbetrieb einen praktischen Rahmen, wie eine datengesteuerte Customer Experience Strategie aufgebaut werden kann. Er deckt die gesamte Architektur ab, von der Guest WiFi Authentifizierung und dem Captive Portal Design bis hin zu räumlichen Analysen, CRM-Integration und messbarem ROI – mit konkreten Implementierungsszenarien aus dem Gastgewerbe, Einzelhandel und öffentlichen Sektor. Die Guest WiFi- und Analyseplattform von Purple wird durchweg als die ermöglichende Infrastrukturschicht positioniert.
Diesen Leitfaden anhören
Podcast-Transkript ansehen
Zusammenfassung für Führungskräfte
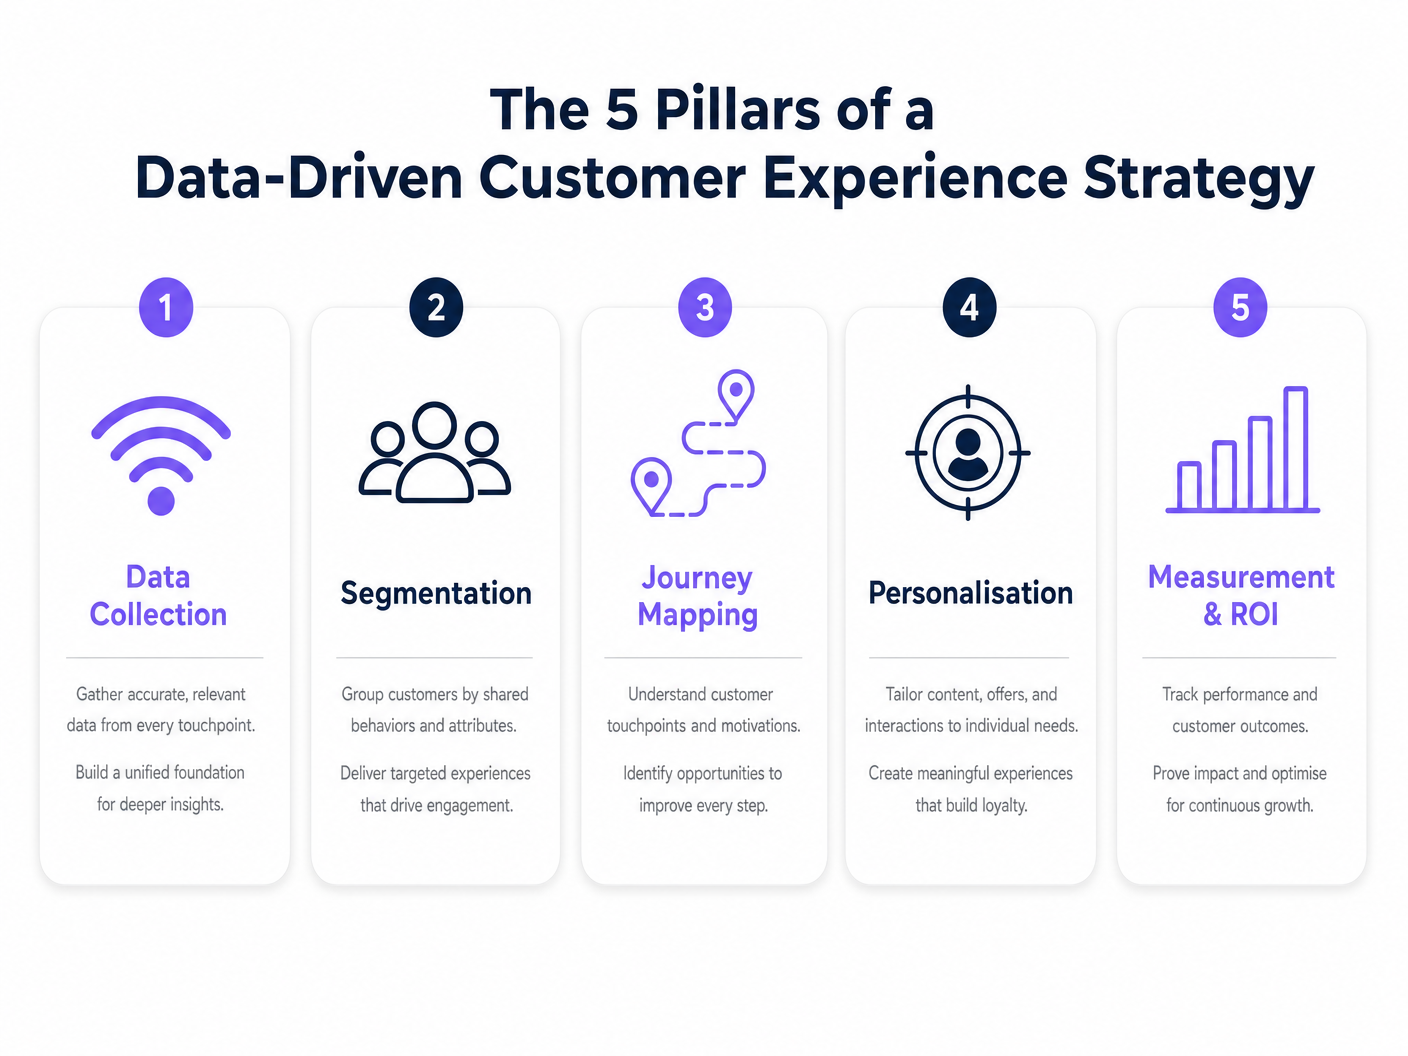
Für IT-Führungskräfte in Unternehmen und Direktoren für Veranstaltungsortbetrieb ist der Aufbau einer Customer Experience (CX) Strategie nicht länger allein die Domäne des Marketings. Da physische Veranstaltungsorte – von Einzelhandelsketten bis hin zu großen Stadien – zunehmend digitalisiert werden, ist die zugrunde liegende Netzwerkinfrastruktur der primäre Motor für die Kundendatenakquise. Dieser Leitfaden beschreibt, wie eine CX-Strategie architektonisch gestaltet wird, die die bestehende drahtlose Infrastruktur nutzt, um umsetzbare Erkenntnisse zu gewinnen, die Interaktion zu automatisieren und einen messbaren Return on Investment zu liefern.
Durch den Einsatz einer robusten Guest WiFi -Lösung können Unternehmen ein operatives Kosten-Center in ein strategisches Asset verwandeln. Eine erfolgreiche CX-Strategie basiert auf nahtloser Datenerfassung, strenger Compliance (einschließlich GDPR und PCI DSS) und der Integration mit bestehenden CRM- und Marketing-Automatisierungsplattformen. Dieses Dokument bietet einen herstellerneutralen, technischen Rahmen für die Gestaltung, Implementierung und Skalierung einer datengesteuerten Customer Experience Architektur in den Bereichen Gastgewerbe , Einzelhandel , Gesundheitswesen und Transport .
Technischer Deep-Dive: Architektur der CX-Datengrundlage
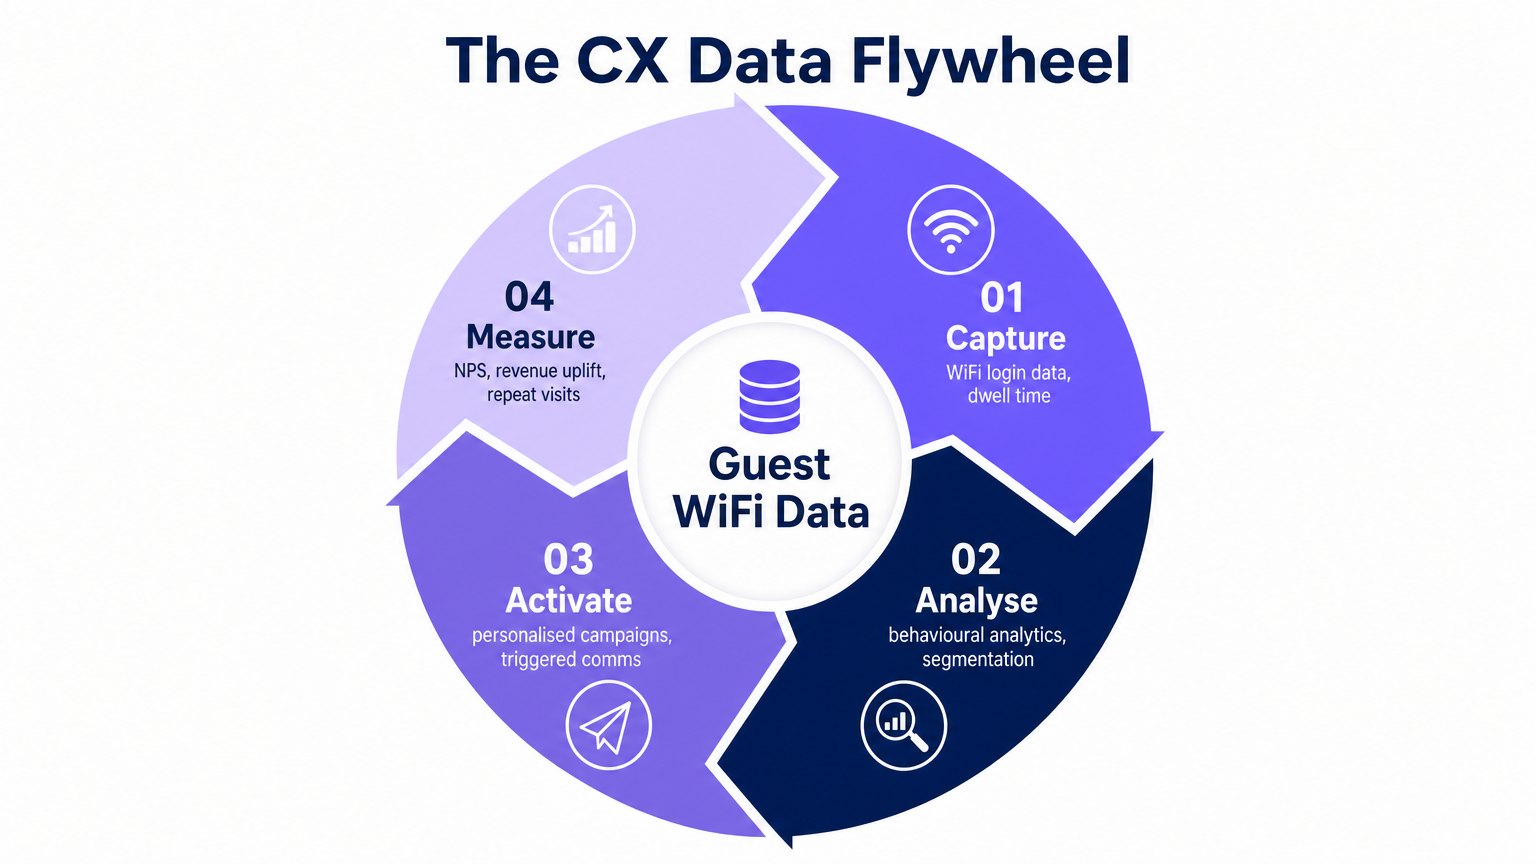
Die Grundlage jeder modernen CX-Strategie an einem physischen Veranstaltungsort ist die Fähigkeit, Benutzer während ihres gesamten Besuchszyklus zuverlässig zu identifizieren und zu verfolgen. Dies erfordert eine robuste Netzwerkarchitektur, die hohe gleichzeitige Geräteanzahlen verarbeiten kann, während der Authentifizierungsverkehr nahtlos an ein Captive Portal oder einen Identitätsanbieter weitergeleitet wird.
Authentifizierungs- und Datenerfassungsmechanismen
Wenn sich ein Benutzer mit der Gast-SSID verbindet, fängt der Access Point (AP) oder Wireless LAN Controller (WLC) die HTTP/HTTPS-Anfrage ab und leitet sie an ein Captive Portal weiter. Dieses Portal dient als primärer Datenerfassungspunkt – die digitale Schwelle zwischen anonymem Besucher und identifiziertem Kunden.
Standard-Bereitstellungsmodelle nutzen RADIUS (Remote Authentication Dial-In User Service) für Authentifizierung, Autorisierung und Abrechnung (AAA). Bei der Integration mit Plattformen wie Purple's WiFi Analytics fordert das Captive Portal spezifische Benutzerattribute – E-Mail-Adresse, demografische Daten oder Social-Login-Tokens – an, bevor der Netzwerkzugriff über eine RADIUS Access-Accept-Nachricht gewährt wird. Die Daten werden gleichzeitig in die Kundendatenbank der Analyseplattform und, über API-Webhook, in das verbundene CRM geschrieben.
Für fortgeschrittene Bereitstellungen ermöglichen Technologien wie Passpoint (Hotspot 2.0) und OpenRoaming ein nahtloses, sicheres Onboarding mittels IEEE 802.1X und WPA3 Enterprise-Verschlüsselung. Purple fungiert als kostenloser Identitätsanbieter für OpenRoaming unter der Connect-Lizenz, was eine automatische Authentifizierung ohne wiederholte Captive Portal Interaktionen ermöglicht – dies reduziert die Reibung erheblich, während eine sichere Datenzuordnung für wiederkehrende Besucher aufrechterhalten wird.
Standortanalysen und Verhaltensverfolgung
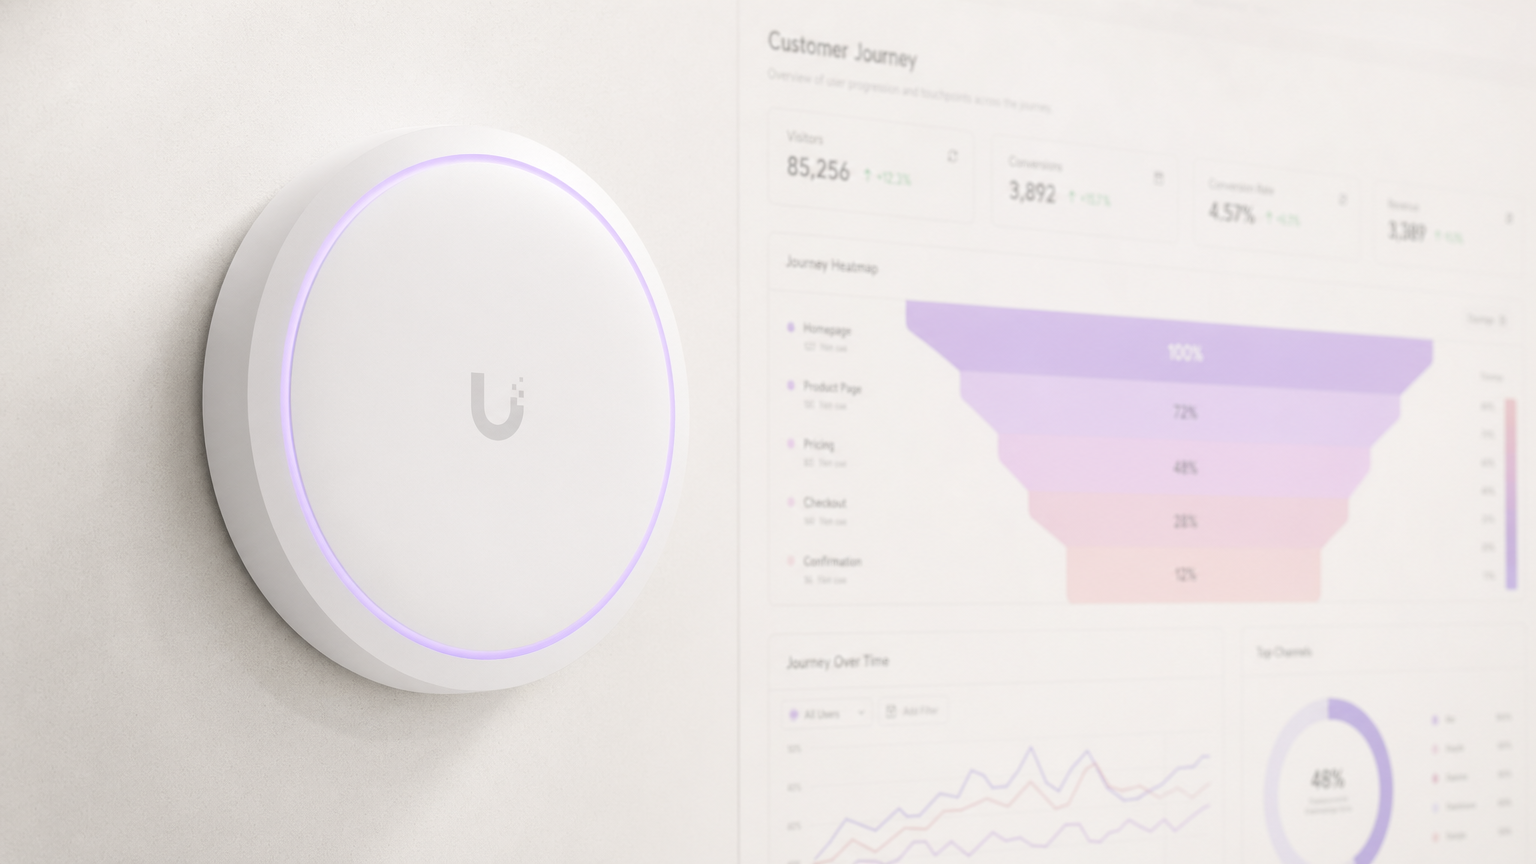
Über die anfängliche Authentifizierung hinaus sind kontinuierliche räumliche Analysen entscheidend, um die gesamte Kundenreise innerhalb des Veranstaltungsortes zu verstehen. Dies wird durch die Verfolgung des Received Signal Strength Indicator (RSSI) sowohl von nicht-assoziierten Probe-Anfragen als auch von assoziiertem Client-Verkehr über mehrere APs hinweg erreicht.
Durch die Triangulation dieser Signale berechnet das Netzwerk Verweildauern, identifiziert stark frequentierte Zonen und kartiert typische Besucherflussmuster. Für eine granularere Genauigkeit können Bereitstellungen Bluetooth Low Energy (BLE) Beacons oder Ultra-Wideband (UWB) Sensoren neben der WiFi-Schicht integrieren, wie im Indoor Positioning System: UWB, BLE, & WiFi Guide detailliert beschrieben. Diese räumlichen Daten werden dann aggregiert und durch Heatmaps und Journey Flows visualisiert, was die empirischen Beweise liefert, die zur Optimierung von physischen Layouts, Personalmodellen und der Marketingplatzierung am Veranstaltungsort erforderlich sind.
Implementierungsleitfaden: Die Strategie bereitstellen
Die Implementierung einer WiFi-gesteuerten CX-Strategie erfordert eine funktionsübergreifende Abstimmung zwischen IT, Marketing und Betrieb. Die Bereitstellung sollte einem phasenweisen Ansatz folgen, um Infrastrukturstabilität, Datenintegrität und messbare Ergebnisse in jeder Phase zu gewährleisten.
Phase 1: Infrastrukturbewertung und RF-Design
Vor der Bereitstellung von Analyse-Overlays muss die zugrunde liegende RF (Radiofrequenz)-Umgebung hohe Client-Dichten unterstützen. Führen Sie sowohl prädiktive als auch aktive Standortbegehungen durch, um eine ausreichende Signalabdeckung – typischerweise -65 dBm oder besser am Client-Gerät – und ausreichende AP-Kapazität zu gewährleisten. Für komplexe oder spezialisierte Umgebungen wie Automobil-Showrooms, beachten Sie den Wi Fi in Auto: The Complete 2026 Enterprise Guide für bereitstellungsspezifische Anleitungen.
Wichtige Infrastrukturparameter, die vor dem Fortfahren zu validieren sind:
| Parameter | Minimum Threshold | Notes |
|---|---|---|
| Signalabdeckung | -65 dBm | Auf Höhe des Client-Geräts |
| AP-zu-Client-Verhältnis | 1:25 (dicht) | Anpassen für Veranstaltungsorte |
| Kanalnutzung | <60% | Pro AP, 2.4 GHz und 5 GHz |
| Captive Portal Latenz | <500ms | Umleitungs-Antwortzeit |
| RADIUS Round-Trip | <100ms | Authentifizierungsantwort |
Phase 2: Captive Portal Konfiguration und CRM-Integration
Das Captive Portal muss die Datenerfassung mit der Benutzererfahrung in Einklang bringen. Implementieren Sie progressives Profiling – fordern Sie minimale Daten beim ersten Besuch an und sammeln Sie schrittweise zusätzliche Attribute bei nachfolgenden Anmeldungen. Ein gut optimiertes Portal sollte eine Login-Konversionsrate von 40-60% der gesamten Veranstaltungsbesucher erreichen.
Sorgen Sie für eine nahtlose API-Integration zwischen der WiFi-Analyseplattform und dem Unternehmens-CRM (Salesforce, HubSpot, Microsoft Dynamics oder gleicivalent). Dies ermöglicht Echtzeit-Datensynchronisation und automatisierte Marketing-Trigger basierend auf physischer Präsenz – zum Beispiel das Versenden einer personalisierten Willkommensnachricht, wenn ein Mitglied eines Treueprogramms einen Einzelhandelsbereich betritt, oder das Auslösen einer Zufriedenheitsumfrage nach dem Besuch 30 Minuten nach dem Verlassen.
Für einzelhandelsspezifische Datenerfassungsstrategien bietet der Leitfaden für Einzelhändler: Kundendaten im Geschäft sammeln einen detaillierten operativen Rahmen.
Phase 3: Analyse-Baseline und Zielgruppensegmentierung
Sobald Daten fließen, legen Sie über einen Zeitraum von mindestens 30 Tagen Basis-Metriken für Besucher-Erfassungsraten, durchschnittliche Verweildauern und Wiederholungsbesuchsfrequenzen fest. Nutzen Sie diese Daten, um segmentierte Zielgruppenprofile zu erstellen. Im Gastgewerbe könnten Sie beispielsweise Benutzer in Geschäftsreisende (kurze Verweildauer, hohe Besuchsfrequenz, wochentagsdominant) und Freizeitreisende (längere Verweildauer, geringe Besuchsfrequenz, wochenenddominant) segmentieren und digitale Kommunikation sowie Erlebnisse vor Ort entsprechend anpassen.
Phase 4: Aktivierung und Personalisierung
Mit etablierten segmentierten Profilen aktivieren Sie die Daten durch gezielte Kommunikation und Personalisierung vor Ort. Ausgelöste E-Mail-Sequenzen, SMS-Kampagnen und App-Push-Benachrichtigungen können alle durch physische Präsenzereignisse gesteuert werden, die von der WiFi-Infrastruktur erkannt werden. Die IoT-Integrationsschicht, die diese Aktivierung untermauert, wird ausführlich im Internet of Things Architecture: A Complete Guide behandelt.
Best Practices für Unternehmensimplementierungen
Priorisieren Sie Datenschutz und Compliance by Design. Alle Datenerfassungsmechanismen müssen die ausdrückliche Zustimmung des Benutzers gemäß GDPR, CCPA und den anwendbaren lokalen Datenschutzbestimmungen einholen. Implementieren Sie die MAC-Adressen-Anonymisierung für nicht authentifizierte Probe-Anfragen am Netzwerkrand – auf dem AP oder WLC – bevor Daten die Analyseplattform erreichen. Zustimmungsnachweise müssen mit Zeitstempeln und Versionsreferenzen zum spezifischen präsentierten Datenschutzhinweis gespeichert werden.
Optimieren Sie für Mobile-First-Authentifizierung. Der Captive Portal und alle nachfolgenden digitalen Interaktionen müssen auf iOS und Android einwandfrei responsiv sein. Latenz während des Authentifizierungsprozesses korreliert direkt mit den Abbruchraten. Streben Sie eine Ladezeit des Portals von unter zwei Sekunden bei einer 4G-Verbindung an.
Abstimmung von IT- und Marketing-KPIs. Die IT ist verantwortlich für Netzwerkverfügbarkeit, Durchsatz und Authentifizierungslatenz. Das Marketing ist verantwortlich für Datenerfassungsraten und Kampagnenleistung. Eine erfolgreiche CX-Strategie erfordert gemeinsame Ziele – Metriken wie die WiFi Capture Rate (Prozentsatz der Besucher, die sich authentifizieren), Kosten pro identifiziertem Besucher und Wiederholungsbesuchsrate verbinden die beiden Funktionen.
Segmentieren Sie Ihre Netzwerkarchitektur korrekt. Das Gast-WiFi-Netzwerk muss mithilfe von VLANs und strengen Stateful-Firewall-Regeln logisch vom Unternehmens-LAN isoliert werden. Dies ist eine PCI DSS-Anforderung in Einzelhandels- und Gastgewerbeumgebungen, in denen Zahlungskartendaten am selben Standort verarbeitet werden. Regelmäßige Penetrationstests der Netzwerkgrenze sind unerlässlich.
Fehlerbehebung & Risikominderung
Die Bereitstellung einer umfassenden CX-Analyseplattform führt zu spezifischen Fehlerursachen, die IT-Teams proaktiv antizipieren und mindern müssen.
Niedrige Erfassungsraten (unter 20%). Wenn der Prozentsatz der Besucher, die sich mit dem WiFi verbinden, niedrig ist, liegt die Hauptursache fast immer in der Captive Portal-Reibung. Überprüfen Sie die Portal-UX: Reduzieren Sie die Anzahl der erforderlichen Felder beim ersten Besuch auf eines, fügen Sie Social-Login-Optionen (Google, Apple, Facebook) hinzu und stellen Sie sicher, dass der Wertetausch – schneller, zuverlässiger Internetzugang im Austausch für eine E-Mail-Adresse – auf der Splash-Seite klar kommuniziert wird.
Ungenauigkeit der Standortdaten. RSSI-basierte Standortverfolgung ist anfällig für HF-Dämpfung durch physische Hindernisse (Betonwände, Metallregale, Glastrennwände) und Mehrwegeinterferenzen in komplexen Innenräumen. Kalibrieren Sie das HF-Modell regelmäßig und erwägen Sie, die WiFi-Positionierung mit BLE-Beacons in hochwertigen Analysezonen wie Produktauslagen oder Serviceschaltern zu ergänzen.
Ausfälle der Integrationspipeline. API-Ratenbegrenzungen oder Schema-Diskrepanzen zwischen der WiFi-Analyseplattform und dem CRM sind eine häufige Ursache für Datenverlust. Implementieren Sie idempotente Webhook-Verarbeitung, Dead-Letter-Queues für fehlgeschlagene Ereignisse und automatisierte Warnmeldungen, wenn die Ereignispipeline unter die erwarteten Durchsatzschwellen fällt.
Verletzungen der Sicherheitsgrenzen. Fehlkonfigurierte VLANs oder Firewall-Regeln können das Unternehmensnetzwerk unbeabsichtigt dem Gastverkehr aussetzen. Führen Sie vierteljährliche Audits der Netzwerksegmentierung durch und stellen Sie sicher, dass das gesamte Inter-VLAN-Routing standardmäßig an der Firewall explizit verweigert wird, wobei nur der erforderliche ausgehende Internetzugang für die Gast-SSID zugelassen ist.
ROI & Geschäftsauswirkungen
Das ultimative Maß einer CX-Strategie ist ihr Einfluss auf die kommerziellen Ergebnisse. Durch die Digitalisierung des physischen Raums können Unternehmen die analytische Strenge des E-Commerce auf den stationären Handel anwenden.
| Metrik | Typische Baseline | Ziel nach der Implementierung | Messmethode |
|---|---|---|---|
| WiFi Capture Rate | 10-15% | 40-60% | Analyseplattform |
| Wiederholungsbesuchsrate | Ungemessen | +15-25% Steigerung | CRM-Attribution |
| E-Mail-Öffnungsrate | Branchendurchschnitt 20% | 35-45% (standortbasiert) | Marketingplattform |
| Zusätzlicher Umsatz pro Besuch | Baseline | +8-12% Steigerung | POS-Integration |
| Effizienz der Personalplanung | Manuelle Planung | Nachfragegesteuert (Verweildaten) | Operations-Dashboard |
Customer Lifetime Value (CLV) Umsatzsteigerung. Personalisierte Interaktionen, die auf Standort- und Verhaltensdaten basieren, erhöhen die Wiederbesuchsraten und den durchschnittlichen Transaktionswert. Organisationen, die ausgelöste, präsenzbasierte Kommunikationen einsetzen, berichten durchweg von einer CLV-Steigerung von 10-20% innerhalb des ersten Einsatzjahres.
Steigerung der Betriebseffizienz. Heatmaps und Verweildaten ermöglichen eine bedarfsgesteuerte Personalplanung, wodurch Arbeitskosten in Nebenzeiten gesenkt und die Servicequalität bei Spitzennachfrage verbessert werden. Im Stadionkontext führt dies direkt zu kürzeren Warteschlangen und höheren Pro-Kopf-Ausgaben an Konzessionsständen.
Genauigkeit der Marketing-Attribution. Durch die Korrelation physischer Besuchsereignisse mit der Exposition gegenüber digitalen Kampagnen können Marketingteams die Offline-Auswirkungen von Online-Ausgaben mit einer Präzision messen, die zuvor nur reinen E-Commerce-Betreibern vorbehalten war. Dies verlagert die Diskussion von Proxy-Metriken (Impressionen, Klicks) zu konkreten Geschäftsergebnissen (Filialbesuche, Transaktionssteigerung).
Schlüsseldefinitionen
Captive Portal
A web page that a user of a public-access network is required to interact with before internet access is granted. It serves as the primary data ingestion point in a guest WiFi deployment.
IT teams encounter this as the first digital touchpoint in the physical venue. Portal design directly determines WiFi capture rates and data quality.
RSSI (Received Signal Strength Indicator)
A measurement of the power level of a received radio signal, expressed in dBm. Used by analytics platforms to estimate the distance between a client device and an access point.
The foundational input for location analytics and zone-based dwell time measurement. Accuracy is typically 3-10 metres in a well-designed RF environment.
OpenRoaming
A global roaming federation service, built on Passpoint (IEEE 802.11u/Hotspot 2.0), that enables automatic and secure WiFi onboarding without captive portal interactions.
Critical for reducing login friction for returning visitors while maintaining secure identity attribution. Purple provides a free identity provider service for OpenRoaming under the Connect licence.
MAC Address Anonymisation
The process of cryptographically hashing a device's Media Access Control address before storage, preventing the identification of individual devices from the stored data.
A mandatory GDPR compliance step when tracking unauthenticated devices via probe requests. Must be implemented at the network edge, not in the analytics database.
Dwell Time
The duration of time a device remains within a specific defined zone or venue, measured from first detection to last detection within that zone.
A primary operational metric for measuring engagement, identifying queue bottlenecks, and optimising staff deployment. Typically measured in minutes.
Progressive Profiling
A data collection methodology that gathers customer attributes incrementally across multiple interactions, rather than requesting all information at a single point.
The standard best practice for captive portal design. Reduces initial login friction while building comprehensive customer profiles over time.
Passpoint (Hotspot 2.0)
A Wi-Fi Alliance certification programme based on IEEE 802.11u that enables seamless, secure roaming between Wi-Fi networks using WPA2/WPA3 Enterprise authentication.
Provides enterprise-grade security for guest networks and automates the authentication process for returning users, eliminating repetitive captive portal interactions.
WiFi Capture Rate
The percentage of total venue visitors who successfully authenticate to the guest WiFi network, providing a consented identity record.
The primary KPI for measuring the effectiveness of the captive portal and the health of the first-party data pipeline. Industry benchmarks range from 15% (poor) to 60%+ (optimised).
Spatial Analytics
The analysis of location-based data to understand movement patterns, zone utilisation, and spatial relationships within a physical environment.
Enables venue operators to visualise customer journeys, measure zone conversion rates, and make evidence-based decisions about physical layout and resource allocation.
Ausgearbeitete Beispiele
A 200-room hotel is experiencing low guest WiFi adoption rates — under 15% of guests are logging in — and is failing to capture sufficient first-party data to support a new loyalty programme initiative. The hotel uses a legacy captive portal with a six-field registration form.
Step 1 — Diagnose the Friction Point: Pull the captive portal analytics to identify the drop-off rate at each form field. In most cases, the majority of abandonment occurs after the second or third required field. Step 2 — Streamline Authentication: Replace the six-field form with a single-click social login (Google, Apple, or Facebook OAuth) as the primary option, with email-only as a secondary option. This reduces the time-to-internet from 45-60 seconds to under 10 seconds. Step 3 — Implement Progressive Profiling: Configure the analytics platform to request only the email address on the first visit. On the second visit, display a prompt offering 500 loyalty points in exchange for a phone number. On the third visit, request a date of birth for a birthday reward. Step 4 — Deploy OpenRoaming for Returning Guests: For guests who have previously authenticated, configure Passpoint/OpenRoaming so their device reconnects automatically on future visits without seeing the captive portal, while still attributing the visit to their profile. Step 5 — Measure and Iterate: Track the WiFi Capture Rate weekly. Target 40% within 60 days of deployment.
A large retail chain wants to measure the commercial effectiveness of a new store layout in driving traffic to a high-margin accessories display area, and needs to justify the capital expenditure on the refit to the board.
Step 1 — Define the Analytics Zone: Within the WiFi analytics platform, draw a geofence around the accessories display area. Ensure AP coverage within the zone is sufficient for accurate RSSI triangulation (minimum two APs with clear line of sight). Step 2 — Establish a Pre-Refit Baseline: Over a 30-day period before the layout change, measure: Zone Conversion Rate (percentage of total store visitors who enter the accessories zone), Average Dwell Time within the zone, and Bounce Rate (visitors who enter and leave within under 30 seconds). Step 3 — Implement the Layout Change. Step 4 — Measure Post-Refit Performance: Over the equivalent 30-day period post-refit, collect the same metrics. Step 5 — Correlate with POS Data: Integrate the WiFi analytics platform with the POS system to correlate zone dwell time with accessories transaction volume. Calculate the incremental revenue attributable to the layout change. Step 6 — Calculate ROI: Divide the incremental annual revenue by the refit capital cost to produce a payback period for the board presentation.
Übungsfragen
Q1. A stadium IT director wants to track queue times at concession stands in real time to dynamically deploy additional staff during peak periods. The venue has standard WiFi coverage across the concourse. What is the most appropriate technological approach, and what are the limitations of relying solely on WiFi RSSI data for this use case?
Hinweis: Consider the accuracy requirements for measuring a dense, slow-moving queue versus general concourse crowd flow. What is the typical RSSI accuracy range, and is it sufficient for distinguishing a 2-metre queue from a 5-metre queue?
Musterlösung anzeigen
Standard WiFi RSSI tracking provides positional accuracy of approximately 3-10 metres in a well-calibrated indoor environment, which is insufficient for precise queue length measurement at a concession stand. The recommended approach is to supplement the WiFi infrastructure with either: (a) BLE beacons mounted directly above each concession counter, providing sub-2-metre accuracy for devices within the queue zone; or (b) overhead stereoscopic cameras with computer vision analytics for people-counting independent of device presence. The WiFi layer remains valuable for macro-level concourse crowd density and flow direction, while the supplementary technology handles the precision queue measurement use case. The integration point is the analytics platform, which should aggregate both data streams into a unified operational dashboard.
Q2. The marketing team at a retail chain wants to send a personalised push notification to a high-value loyalty member the moment they enter the store, before they have interacted with any staff. The current deployment uses a standard captive portal that takes approximately 45 seconds to complete. How should the IT team architect a solution that delivers a sub-10-second entry notification?
Hinweis: The captive portal authentication flow is too slow for an immediate entry notification. What authentication mechanism eliminates the portal interaction for returning users while still attributing the visit to their identity?
Musterlösung anzeigen
The solution requires implementing Passpoint/OpenRoaming for returning loyalty members. The workflow is: (1) On the member's first visit, they complete the standard captive portal and their device credentials are provisioned for Passpoint. (2) On all subsequent visits, the device automatically authenticates via 802.1X/WPA3 Enterprise without displaying the captive portal, completing the authentication handshake in under 2 seconds. (3) The WiFi analytics platform detects the association event and identifies the user via their provisioned identity token. (4) A real-time webhook fires to the marketing automation platform, which dispatches the push notification within 5-8 seconds of the device entering the RF coverage zone. The key architectural requirement is that the loyalty app must have push notification permissions enabled, and the member's device must have the Passpoint profile installed — typically achieved via the loyalty app onboarding flow.
Q3. During a routine network audit at a multi-site retail operator, it is discovered that the guest WiFi analytics platform has been storing raw, unhashed MAC addresses from unauthenticated probe requests for the past 18 months across all 47 stores. What is the primary regulatory risk, what is the immediate remediation action, and what architectural change is required to prevent recurrence?
Hinweis: Consider the GDPR classification of MAC addresses and the territorial scope of the regulation. What constitutes a 'personal data breach' under Article 33?
Musterlösung anzeigen
The primary risk is a material GDPR violation under Article 5(1)(b) (purpose limitation) and Article 5(1)(e) (storage limitation), as raw MAC addresses are classified as personal data under Recital 30 of the GDPR. The 18-month retention of unauthenticated probe data without a lawful basis or consent constitutes unlawful processing. Immediate remediation: (1) Notify the Data Protection Officer and conduct a Data Protection Impact Assessment (DPIA). (2) Assess whether the breach meets the Article 33 threshold for supervisory authority notification (within 72 hours if there is a risk to individuals' rights). (3) Purge all stored raw MAC addresses from the analytics database immediately. Architectural remediation: Configure the analytics platform or WLC to apply a SHA-256 hash with a rotating salt to all MAC addresses at the point of capture — on the AP or controller — before any data is transmitted to the analytics platform. This ensures that no raw MAC address ever enters the data pipeline, making the stored data non-personal by design. Implement a 90-day maximum retention policy for anonymised probe data, enforced by automated database purge jobs.
Weiterlesen in dieser Reihe
Privacy by Design: Anonymisierung von WiFi-Daten für die GDPR-Konformität
Dieser maßgebliche Leitfaden beschreibt die technische Architektur und Implementierungsstrategien zur Anonymisierung von WiFi-Daten, um die GDPR-Konformität sicherzustellen. Er bietet IT-Führungskräften und Netzwerkarchitekten umsetzbare Frameworks, um robuste Standortanalysen mit strengen Datenschutzanforderungen in Einklang zu bringen.
Heatmapping vs. Presence Analytics: Technische Unterschiede
Dieser maßgebliche technische Leitfaden beschreibt die entscheidenden architektonischen und operativen Unterschiede zwischen WiFi Heatmapping und Presence Analytics für Betreiber von Unternehmensstandorten. Er bietet IT-Führungskräften, Netzwerkarchitekten und Betriebsleitern umsetzbare Bereitstellungs-Frameworks, reale Implementierungsszenarien und herstellerneutrale Best Practices, um den maximalen ROI aus ihrer bestehenden drahtlosen Infrastruktur zu erzielen.
Wie man die Verweildauer mit WiFi Location Analytics berechnet
Dieser Leitfaden bietet eine umfassende technische Referenz zur Berechnung der WiFi-Verweildauer mittels WiFi Location Analytics. Er deckt die gesamte Architektur ab, von der Erfassung von 802.11 Probe Requests über die RSSI-basierte Trilateration bis zur Analyse von Geofence-Zonen. Er richtet sich an IT-Manager, Netzwerkarchitekten und Betriebsleiter von Veranstaltungsorten, die präzise, skalierbare Standortinformationen in Einzelhandel, Gastgewerbe, Gesundheitswesen und im öffentlichen Sektor implementieren müssen. Die Leser erhalten umsetzbare Implementierungsanleitungen, Fallstudien aus der Praxis und einen klaren Rahmen für die Umwandlung von Rohdaten in messbare Geschäftsergebnisse.