WiFi Footfall Analytics: Besucherdaten messen und nutzen
Dieser Leitfaden bietet IT-Managern, Netzwerkarchitekten und Betriebsleitern von Veranstaltungsorten eine praktische, technische Referenz für die Implementierung von WiFi Footfall Analytics in den Bereichen Gastgewerbe, Einzelhandel, Veranstaltungen und im öffentlichen Sektor. Er deckt die gesamte Datenpipeline ab – von der Erfassung von 802.11 Probe Requests und der RSSI-basierten Positionierung bis hin zur GDPR-konformen Datenverarbeitung und umsetzbaren Business Intelligence Dashboards. Leser erhalten ein klares Implementierungs-Framework, Fallstudien aus der Praxis und die Entscheidungskriterien, die für die Auswahl, Bereitstellung und Optimierung einer WiFi-Analyseplattform in diesem Quartal erforderlich sind.
Diesen Leitfaden anhören
Podcast-Transkript ansehen
📚 Part of our core series: Marketing & Analytics Platform →
Zusammenfassung für Führungskräfte
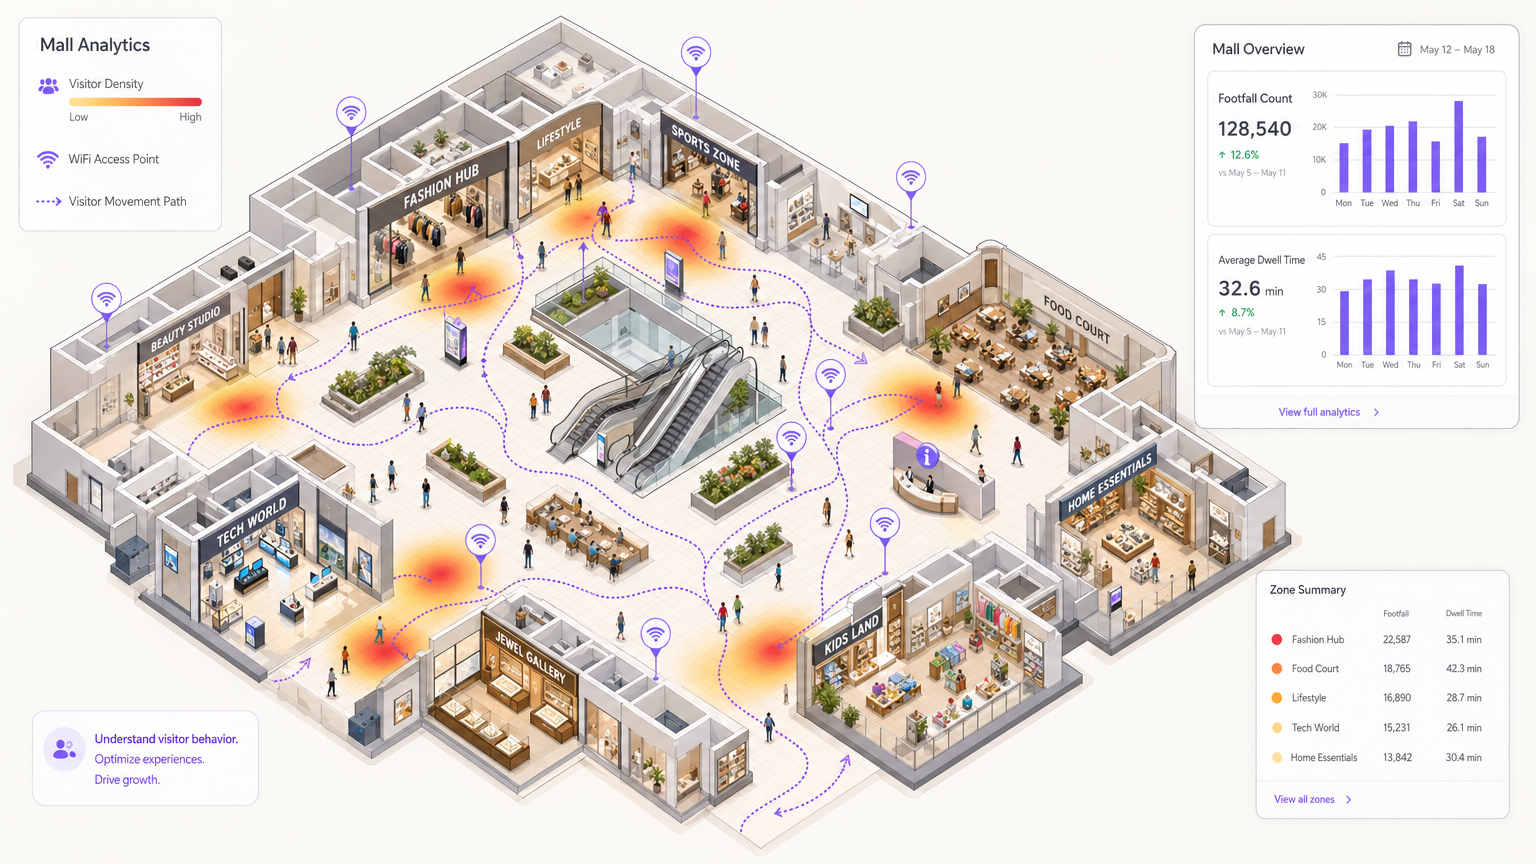
WiFi Footfall Analytics verwandelt Ihre bestehende drahtlose Infrastruktur in ein kontinuierliches, standortweites Messsystem. Durch die passive Erfassung von 802.11 Probe Requests von Besuchergeräten, die Verarbeitung von RSSI-Signalen über mehrere Access Points hinweg und die Anwendung von Anonymisierung und Aggregation auf der Analyseebene erhalten Betreiber genaue Zählungen eindeutiger Besucher, Verweildauer pro Zone, Spitzenstundenverteilungen und Wiederbesuchsraten – all dies, ohne dass Besucher sich aktiv mit dem Netzwerk verbinden müssen.
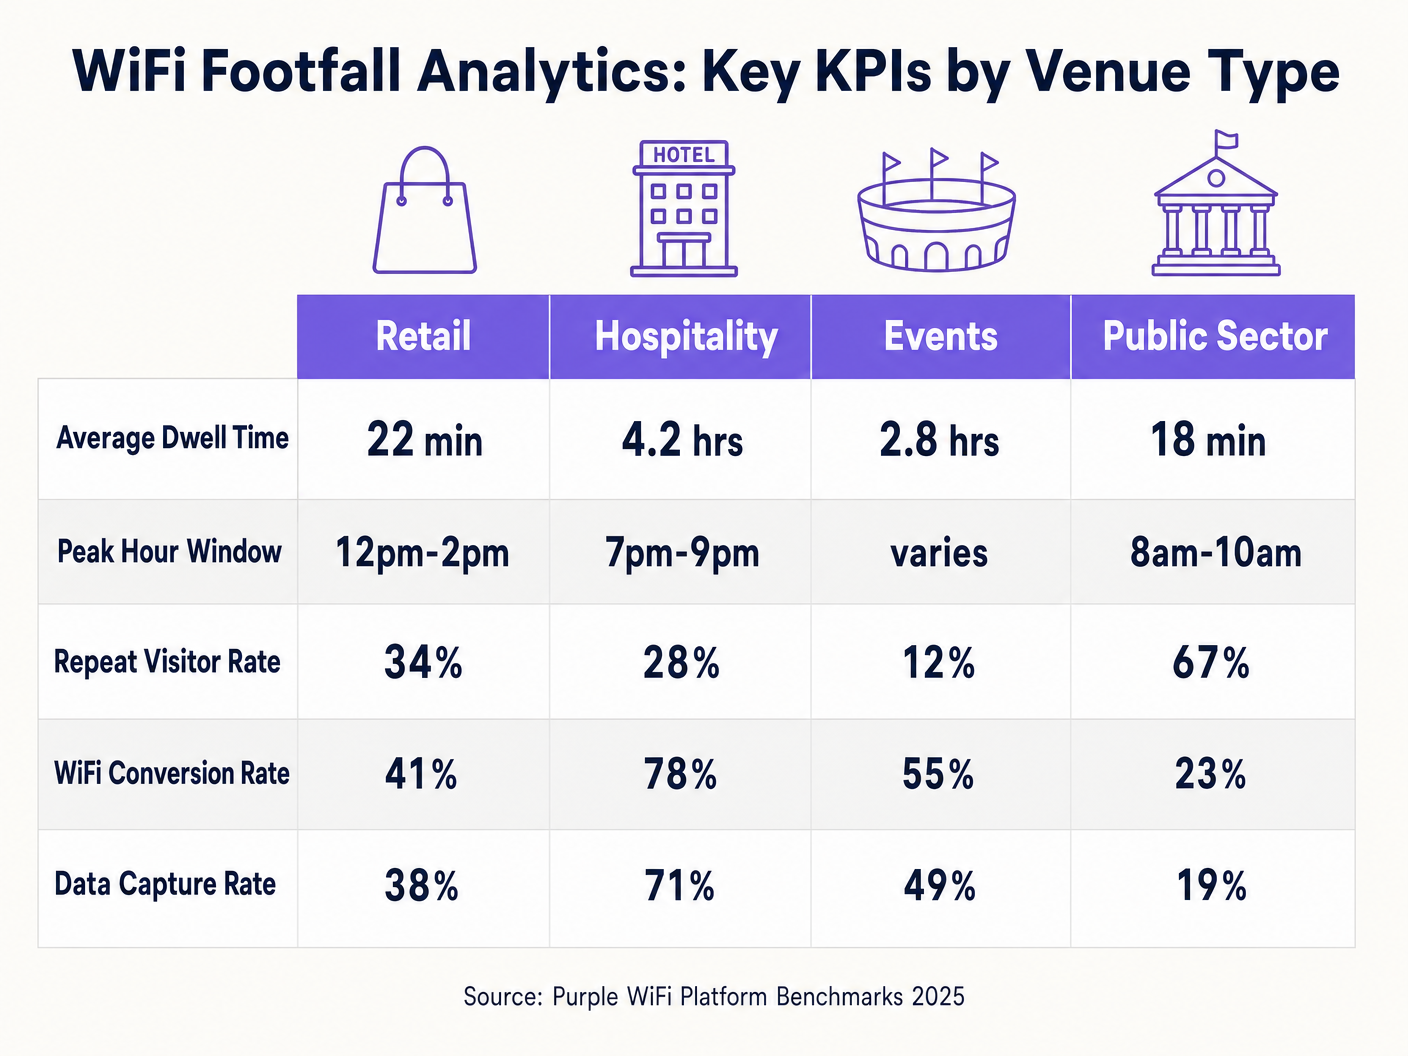
Für einen CTO, der diese Funktion evaluiert, sind die wichtigsten Entscheidungspunkte: Genauigkeitsanforderungen (Standard-WiFi liefert eine Präzision von 5–10 m; für Sub-Meter-Anwendungsfälle ist eine BLE- oder UWB-Erweiterung erforderlich), Haltung zur Einhaltung des Datenschutzes (GDPR schreibt Anonymisierung am Edge und transparente Zustimmungsflüsse vor) und Integrationstiefe (der höchste ROI ergibt sich aus der Verknüpfung anonymer Footfall-Daten mit authentifizierten Benutzerprofilen über eine Guest WiFi -Plattform). Die WiFi Analytics -Plattform von Purple deckt alle drei Ebenen sofort ab und unterstützt Implementierungen in den Bereichen Einzelhandel , Gastgewerbe , Gesundheitswesen und Transport . Eine umfassendere Einführung in die Analysedisziplin finden Sie unter Was ist WiFi Analytics? Ein vollständiger Leitfaden .
Technischer Einblick
Wie WiFi Footfall Analytics funktioniert
Die Grundlage von WiFi Footfall Analytics ist der IEEE 802.11 Probe Request Mechanismus. Wenn das WiFi-Radio eines Geräts aktiv ist – unabhängig davon, ob der Benutzer mit einem Netzwerk verbunden ist oder nicht – sendet das Gerät Probe Requests, um verfügbare SSIDs zu entdecken. Diese Frames enthalten die MAC-Adresse des Geräts, einen Zeitstempel und unterstützte Datenraten. Access Points an Ihrem gesamten Standort empfangen diese Frames passiv und leiten sie zusammen mit dem gemessenen RSSI-Wert an eine zentrale Analyse-Engine weiter.
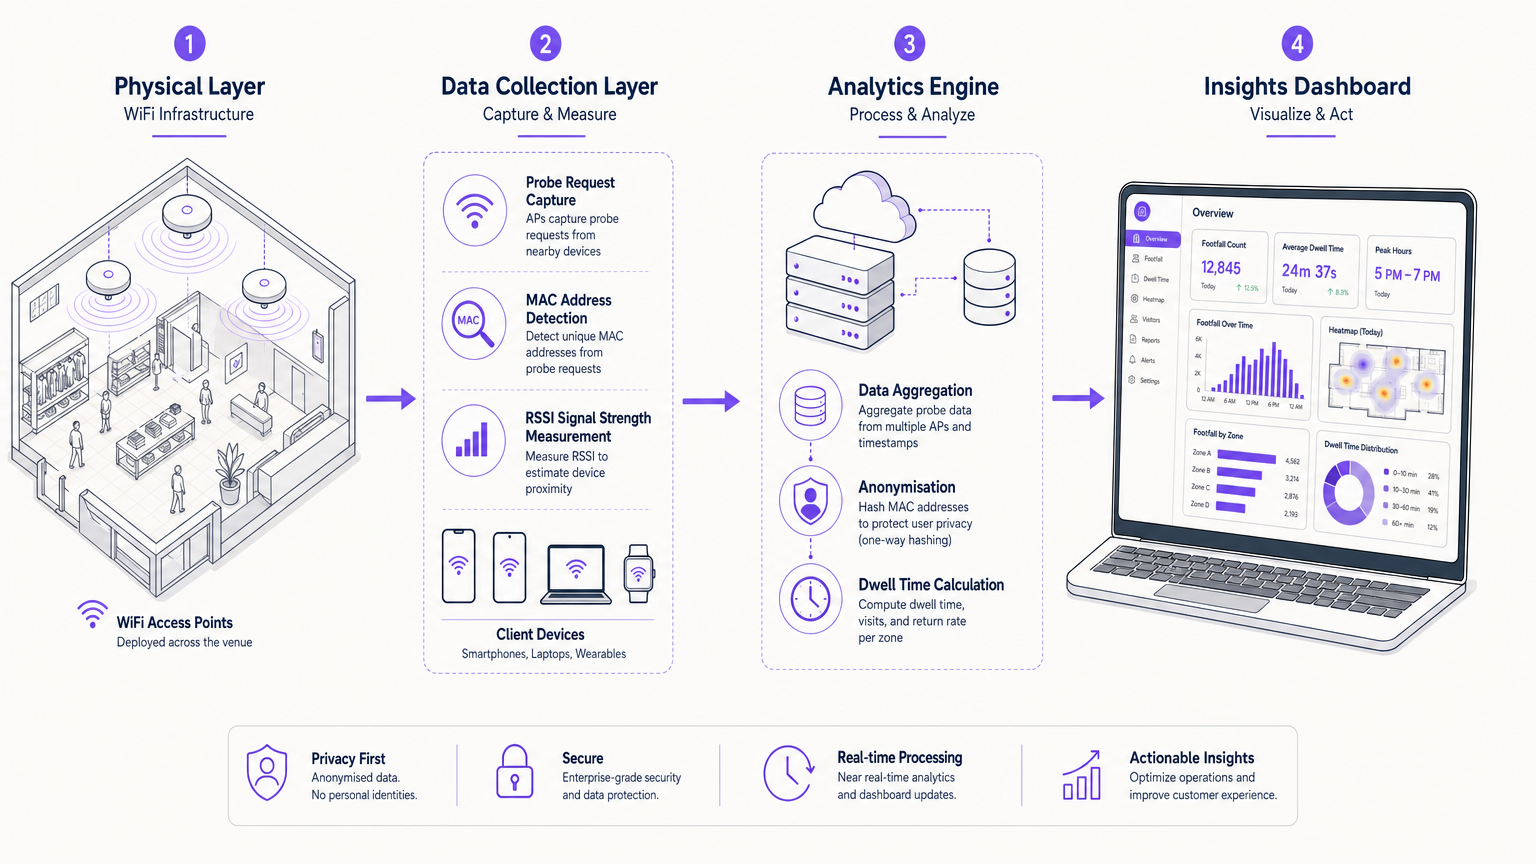
Die Analyse-Engine führt vier Kernoperationen aus. Erstens, Geräteerkennung: Jede innerhalb eines konfigurierbaren Zeitfensters beobachtete eindeutige MAC-Adresse wird als separate Besucherpräsenz gezählt. Zweitens, Positionierung: Durch den Vergleich von RSSI-Werten mehrerer APs, die dieselbe Probe gehört haben, wendet die Engine Trilaterations- oder Fingerprinting-Algorithmen an, um den Standort des Geräts auf dem Grundriss zu schätzen, typischerweise innerhalb von 5–10 Metern für Standard-802.11ac/ax-Implementierungen. Drittens, Berechnung der Verweildauer: Die Engine verfolgt die erste und letzte Probe-Beobachtung für jedes Gerät innerhalb einer Sitzung und berechnet die Dauer der Anwesenheit pro Zone. Viertens, Anonymisierung: MAC-Adressen werden vor dem Verlassen des Edge-Bereichs mittels SHA-256 oder Ähnlichem unidirektional gehasht, um sicherzustellen, dass keine persönlich identifizierbaren Informationen an die Cloud-Analyseebene übertragen oder dort gespeichert werden.
MAC-Randomisierung und ihre Auswirkungen
Eine kritische technische Herausforderung für jede WiFi-Analyse-Implementierung ist die MAC-Adressen-Randomisierung. Seit iOS 14 (2020) und Android 10 (2019) randomisieren mobile Betriebssysteme die in Probe Requests verwendete MAC-Adresse netzwerk- oder sitzungsbasiert. Dies bedeutet, dass ein einzelnes physisches Gerät im Laufe der Zeit als mehrere unterschiedliche MAC-Adressen erscheinen kann, was die Roh-Besucherzahlen um 20–40 % künstlich aufbläht, wenn dies nicht korrigiert wird.
Ausgereifte Analyseplattformen begegnen diesem Problem durch verschiedene Mechanismen: zeitliche Clusterbildung (Gruppierung von Probe-Bursts vom selben physischen Standort innerhalb eines kurzen Zeitfensters), Signal-Fingerprinting (Abgleich von RSSI-Profilen über APs hinweg, um eine wahrscheinliche Gerätekontinuität zu identifizieren) und authentifizierte Sitzungsbindung (wenn ein Benutzer sich über ein Guest WiFi Captive Portal verbindet, wird die MAC der authentifizierten Sitzung mit der Probe-Historie verknüpft, was einen Ground-Truth-Deduplizierungsanker liefert). Einen tieferen Einblick, wie Positionierungstechnologien mit diesen Herausforderungen interagieren, finden Sie im Leitfaden für Indoor-Positionierungssysteme: UWB, BLE & WiFi .
Datenarchitektur und Standardkonformität
Eine produktionsreife WiFi Footfall Analytics Architektur umfasst drei Ebenen. Die Edge-Ebene besteht aus den Access Points selbst, die Firmware ausführen, die zur Erfassung von Probe-Frames und lokalem Hashing fähig ist. Die Aggregations-Ebene ist eine Cloud- oder On-Premise-Analyse-Engine, die gehashte Probe-Ereignisse aufnimmt, Deduplizierung anwendet und Metriken berechnet. Die Präsentations-Ebene ist das BI-Dashboard und die API-Schicht, die KPIs für Betriebsteams bereitstellt und nachgelagerte Systeme wie CRM, Workforce Management und Digital Signage speist.
Aus Standardsicht muss die Implementierung Folgendes berücksichtigen: IEEE 802.1X für authentifizierten Netzwerkzugriff (relevant bei der Verknüpfung von Footfall-Daten mit bekannten Benutzersitzungen), WPA3 für die Over-the-Air-Verschlüsselung authentifizierter Sitzungen, GDPR Artikel 5 (Datenminimierung und Zweckbindung – nur das sammeln, was Sie für den angegebenen Zweck benötigen) und PCI DSS, wenn das Netzwerk Zahlungskartendaten neben dem Analyse-Traffic transportiert (Netzwerksegmentierung über VLANs ist in diesem Fall obligatorisch).
Implementierungsleitfaden
Schritt 1: RF-Standortbegehung und AP-Platzierung
Genaue Footfall-Analysen beginnen mit einer professionellen RF-Standortbegehung. Das Ziel ist nicht nur Abdeckung – es ist die Standortauflösung. Damit die Trilateration funktioniert, muss jeder Punkt auf dem Grundriss in Reichweite von mindestens drei Access Points mit unterschiedlichen RSSI-Messwerten liegen. Als Faustregel gilt: Setzen Sie APs in offenen Umgebungen mit einer Dichte von einem pro 150–200 Quadratmetern ein, reduziert auf einen pro 80–100 QuadratmeterMeter in Bereichen mit erheblichen HF-Störungen (Küchen, Serverräume, dichte Regale). Verwenden Sie prädiktive HF-Planungstools, um die Signalausbreitung vor der physischen Installation zu modellieren.
Schritt 2: Firmware- und Probe-Capture-Konfiguration
Aktivieren Sie die Erfassung von Probe-Anfragen auf Ihrer AP-Firmware. Die meisten Enterprise-Anbieter (Cisco, Aruba, Ruckus, Meraki) unterstützen dies nativ über ihre Location Services APIs. Konfigurieren Sie das Erfassungsintervall – typischerweise gleichen 30-Sekunden-Aggregationsfenster die Granularität mit dem Datenvolumen aus. Stellen Sie sicher, dass das MAC-Hashing auf dem Gerät oder am lokalen Controller durchgeführt wird, bevor Daten die Standortgrenze verlassen. Dies ist eine zwingende Anforderung für die GDPR-Konformität.
Schritt 3: Bereitstellung der Analytics Engine
Verbinden Sie Ihre APs oder den Controller über einen sicheren HTTPS/TLS 1.3 API-Endpunkt mit der Analyseplattform. Konfigurieren Sie die Grundrisszuordnung, indem Sie die CAD- oder Architekturzeichnungen Ihres Veranstaltungsortes hochladen und das Koordinatensystem anhand bekannter AP-Positionen kalibrieren. Definieren Sie Zonen – logische Bereiche des Grundrisses (Eingangshalle, Food Court, Einzelhandel Zone A usw.) –, die als Analyseeinheit für Verweildauer- und Besucherfrequenzberichte verwendet werden.
Schritt 4: Guest WiFi-Integration
Stellen Sie ein Guest WiFi Captive Portal bereit, um den Übergang von anonymen Probe-Daten zu authentifizierten Besucherprofilen zu ermöglichen. Die Splash Page sollte eine klare, GDPR-konforme Einverständniserklärung anzeigen, die erklärt, welche Daten gesammelt und wie sie verwendet werden. Bieten Sie Social Login, E-Mail-Registrierung oder OpenRoaming-basierte Authentifizierung an. Jede authentifizierte Sitzung liefert einen stabilen Identifikator, den die Analytics Engine zur Verankerung der Deduplizierung und zur Anreicherung von Besucherfrequenzdaten mit demografischen und Präferenzdaten verwendet.
Schritt 5: Dashboard-Konfiguration und Alarmierung
Konfigurieren Sie Ihr WiFi Analytics Dashboard mit den für Ihren Veranstaltungsort relevanten KPIs. Richten Sie automatisierte Alarme für Schwellenwertüberschreitungen ein – zum Beispiel einen Echtzeit-Alarm, wenn die Besucherfrequenz in einer bestimmten Zone 80 % der historischen Spitzenkapazität überschreitet, was eine Reaktion des Personaleinsatzes auslöst. Planen Sie wöchentliche und monatliche Berichte zur Verteilung an Veranstaltungsortmanager und den Betriebsrat.
Best Practices
Die folgenden Praktiken spiegeln die Bereitstellungserfahrung an Tausenden von Standorten wider und stimmen mit den Richtlinien von IEEE, GDPR und PCI DSS überein.
Privacy by Design: Anonymisieren Sie MAC-Adressen am Edge, nicht in der Cloud. Dies ist sowohl eine GDPR-Anforderung als auch eine praktische Maßnahme zur Datenminimierung. Speichern Sie niemals Roh-MAC-Adressen in Ihrer Analytics-Datenbank.
Baseline vor der Optimierung: Betreiben Sie die Analytics-Plattform mindestens vier Wochen lang im passiven Beobachtungsmodus, bevor Sie operative Änderungen vornehmen. Sie benötigen eine statistisch valide Baseline – unter Berücksichtigung von Wochentagsschwankungen, saisonalen Mustern und ereignisbedingten Anomalien –, bevor eine Metrik handlungsrelevant wird.
Zonengranularität: Definieren Sie Zonen auf der Ebene der operativen Entscheidungsfindung, nicht auf der Ebene der technischen Leistungsfähigkeit. Wenn Ihr Betriebsteam nicht auf Subzonen-Daten reagieren kann, erhöht die Erstellung von 50 Mikrozonen die Komplexität ohne Mehrwert. Beginnen Sie mit 5–10 sinnvollen Zonen und erweitern Sie diese, wenn die analytische Reife des Teams wächst.
Multi-Site-Normalisierung: Beim Vergleich der Besucherfrequenz über mehrere Standorte hinweg normalisieren Sie nach Veranstaltungsortgröße (Besucher pro 100 m²) und Betriebszeiten. Rohe Besucherzahlen sind irreführend, wenn man einen 500 m² großen Convenience Store mit einem 5.000 m² großen Kaufhaus vergleicht.
Integration mit externen Daten: WiFi-Besucherfrequenzdaten gewinnen erheblich an analytischer Aussagekraft, wenn sie mit externen Datensätzen korreliert werden – Wetter, lokale Veranstaltungskalender, Störungen im öffentlichen Nahverkehr und Zeitpläne von Werbekampagnen. Diese Korrelation unterscheidet ein Zählsystem von einer echten Business Intelligence-Fähigkeit.
Fehlerbehebung und Risikominderung
| Fehlermodus | Grundursache | Abhilfemaßnahme |
|---|---|---|
| Besucherfrequenz 30–50 % höher als manuelle Zählungen | MAC-Randomisierung nicht berücksichtigt | Temporales Clustering implementieren und authentifizierte WiFi-Sitzungen fördern |
| Geringe Standortgenauigkeit (>15 m Fehler) | Unzureichende AP-Dichte oder schlechte Platzierung | HF-Standortanalyse durchführen; AP-Dichte in Problemzonen erhöhen |
| Fehlende Daten aus bestimmten Zonen | AP-Firmware nicht für Probe-Erfassung konfiguriert | AP-Firmware-Versionen prüfen; Location Services auf allen APs aktivieren |
| GDPR-Audit-Fehler | Roh-MAC-Adressen in der Cloud gespeichert | Edge-Hashing durchsetzen; vierteljährliche Datenfluss-Audits durchführen |
| Dashboard-Latenz >5 Minuten | Analytics Engine unterversorgt | Compute-Tier skalieren; Edge-Voraggregation implementieren |
| Geringe WiFi-Authentifizierungsrate (<20 %) | Schlechte Splash Page UX oder langsames Captive Portal | A/B-Tests von Splash Page-Designs; Portal-Ladezeit auf <2 Sekunden optimieren |
ROI und Geschäftsauswirkungen
Der ROI von WiFi-Besucherfrequenzanalysen manifestiert sich in drei Kategorien: operative Effizienz, Umsatzoptimierung und Kapitalplanung.
Auf der operativen Seite ermöglichen Spitzenstundendaten eine präzise Personalplanung. Eine regionale Einzelhandelskette, die von festen Dienstplänen auf eine nachfrageorientierte Planung basierend auf WiFi-Besucherfrequenzdaten umstellt, erzielt typischerweise eine Reduzierung der Arbeitskosten pro bedientem Besucher um 12–18 %, während gleichzeitig die Kundenzufriedenheitswerte durch die Reduzierung von Wartezeiten während Spitzenzeiten verbessert werden.
Auf der Umsatzseite sind Verweildauerdaten ein direkter Indikator für die Kaufabsicht. Zonen mit hoher Besucherfrequenz, aber geringer Verweildauer weisen auf ein Navigations- oder Merchandising-Problem hin – Besucher gehen durch, anstatt anzuhalten. Eine Korrektur durch Layoutänderungen oder gezielte digitale Beschilderung kann die Konversionsraten in den betroffenen Zonen um 8–15 % steigern. Darüber hinaus ermöglichen die über Guest WiFi generierten authentifizierten Besucherprofile die Monetarisierung von Retail Media auf dem Captive Portal-Splashpage, wodurch ein neuer Umsatzstrom aus Werbeinventar entsteht.
Im Bereich der Investitionsplanung bietet das standortübergreifende Frequenz-Benchmarking die Datengrundlage für Immobilienportfolio-Entscheidungen. Welche Standorte schneiden im Verhältnis zu ihrem Einzugsgebietspotenzial unterdurchschnittlich ab? Welche Standorte rechtfertigen eine Sanierungsinvestition? WiFi-Analysen liefern die kontinuierliche, objektive Messung, die manuelle Frequenzzähler und periodische Umfragen nicht leisten können.
Für den Kontext, wie sich diese Prinzipien auf vernetzte Fahrzeug- und Transportumgebungen übertragen lassen, siehe Wi-Fi in Auto: The Complete 2026 Enterprise Guide und die Internet of Things Architecture: A Complete Guide .
Schlüsseldefinitionen
Probe Request
A management frame broadcast by any 802.11 WiFi-enabled device to discover available networks. Contains the device MAC address, supported data rates, and optionally a target SSID. The primary raw data source for passive WiFi footfall analytics.
IT teams encounter this when configuring AP firmware for location services. Understanding probe request behaviour — including the impact of MAC randomisation on probe frame MAC addresses — is essential for accurate footfall counting.
RSSI (Received Signal Strength Indicator)
A measurement of the power level of a received radio signal, expressed in dBm (typically ranging from -30 dBm at close range to -90 dBm at the edge of coverage). Used in WiFi footfall analytics to estimate the distance between a device and each access point, enabling trilateration-based positioning.
RSSI-based positioning is inherently noisy due to multipath interference, building materials, and human body absorption. IT teams should understand that RSSI accuracy degrades in environments with dense RF interference, and plan AP density accordingly.
MAC Address Randomisation
A privacy feature implemented in iOS 14+, Android 10+, and Windows 10+ that causes devices to use a randomly generated MAC address in probe requests rather than the device's permanent hardware MAC address. Designed to prevent passive tracking of individuals across venues.
The single biggest technical challenge for WiFi footfall analytics deployments post-2020. IT teams must ensure their chosen analytics platform implements deduplication heuristics to correct for randomised MACs, or footfall counts will be significantly overstated.
Dwell Time
The duration of a visitor's presence within a defined zone or venue, calculated as the time elapsed between the first and last probe request observation for a given device identifier within a session. Typically expressed as an average across all visitors in a reporting period.
Dwell time is one of the highest-value metrics in WiFi analytics. In retail, it correlates strongly with purchase probability. In hospitality, it measures guest engagement with F&B and leisure facilities. Operations teams use it to evaluate the effectiveness of layout changes and promotional activations.
Trilateration
A positioning technique that estimates a device's location by measuring its distance from three or more known reference points (access points), using signal strength (RSSI) or time-of-flight measurements. Distinct from triangulation, which uses angles rather than distances.
The positioning algorithm underpinning zone-level WiFi footfall analytics. IT teams should understand that trilateration accuracy is constrained by AP density, RF environment quality, and the precision of RSSI measurements. For higher accuracy, consider augmenting with BLE beacons or UWB anchors.
Captive Portal
A web page presented to users before they are granted access to a WiFi network, typically requiring authentication (social login, email registration, or voucher code) and consent to terms of service. In WiFi analytics, the captive portal is the mechanism that transitions anonymous probe data to authenticated user profiles.
The captive portal is the primary data collection point for GDPR-compliant first-party data capture. IT teams must ensure the portal presents a clear, granular consent notice and that the consent record is stored with a timestamp and linked to the user's profile.
Footfall Capture Rate
The percentage of pedestrians passing a venue's entrance who actually enter, calculated by dividing authenticated or detected in-venue visitors by the external pedestrian count from a street-level sensor or camera system. A key retail performance metric.
Capture rate requires an external pedestrian count data source in addition to WiFi analytics. IT teams deploying in retail environments should plan for integration between the WiFi analytics platform and entrance camera or infrared counter systems to enable capture rate calculation.
Return Visit Rate
The percentage of unique visitors who return to the venue within a defined time window (commonly 7, 30, or 90 days), calculated by matching device identifiers across sessions. Requires either stable MAC addresses (increasingly rare) or authenticated user session matching.
Return visit rate is a loyalty metric that WiFi analytics platforms can calculate at scale without requiring a formal loyalty programme. However, MAC randomisation significantly impacts accuracy for unauthenticated visitors. Authenticated Guest WiFi sessions provide the most reliable return rate data.
Zone
A named, bounded area of a venue floor plan defined within the analytics platform, used as the unit of analysis for footfall and dwell time reporting. Zones are mapped to physical coordinates on the floor plan and assigned to one or more access points.
Zone design is an operational decision, not a technical one. IT teams should work with venue operations managers to define zones that map to actionable business decisions — not the maximum granularity the technology supports. Over-granular zone definitions create analytical noise without operational value.
Ausgearbeitete Beispiele
A 120-property hotel group wants to use WiFi footfall analytics to optimise lobby staffing and F&B outlet opening hours. Their existing Cisco Meraki infrastructure covers all public areas. How should they approach the deployment?
The deployment should proceed in four phases. Phase 1 (Weeks 1–2): Enable Cisco Meraki location services API on all MR series APs across the estate. Configure probe capture with a 30-second aggregation interval. Map all public-area floor plans into the analytics platform, defining zones for: main lobby, check-in desk area, restaurant entrance, bar, gym, and pool. Phase 2 (Weeks 3–6): Run in passive observation mode to establish baseline footfall patterns by hour, day, and property. Identify the peak check-in window (typically 14:00–18:00) and the F&B peak (19:00–21:00) with statistical confidence. Phase 3 (Week 7): Deploy the Guest WiFi captive portal with GDPR-compliant consent, offering social login and email registration. This transitions anonymous probe data to authenticated profiles, enabling return-visit tracking and guest preference capture. Phase 4 (Week 8 onwards): Configure automated staffing alerts — when lobby footfall exceeds 85% of the 90th-percentile historical peak, trigger a notification to the duty manager to deploy additional check-in staff. Set F&B outlet opening hours dynamically based on the previous four weeks' footfall data for that day of week. Integrate the analytics API with the property management system to correlate footfall with RevPAR and F&B revenue per cover.
A 12-store fashion retail chain is evaluating WiFi footfall analytics to benchmark store performance and identify which locations are candidates for lease renegotiation. Their stores use a mix of Aruba and Ruckus APs. What is the recommended implementation approach, and what metrics should they prioritise?
Given the mixed-vendor environment, the recommended approach is to use a vendor-neutral analytics platform that ingests probe data via a standardised API from both Aruba Central and Ruckus SmartZone controllers. Step 1: Audit AP firmware versions across all 12 stores and ensure location services are enabled. Step 2: Define a consistent zone taxonomy across all stores — entrance zone, front-of-store, mid-store, fitting rooms, till area — to enable like-for-like comparison. Step 3: Establish a normalised footfall metric: unique visitors per 100 m² of trading floor per operating hour. This removes the distortion caused by different store sizes and opening hours. Step 4: Track four primary KPIs: (a) Capture Rate — the percentage of pedestrians passing the store entrance who enter (requires an external pedestrian count feed or entrance-zone WiFi data); (b) Dwell Time — average minutes per visit, segmented by zone; (c) Conversion Proximity — the percentage of visitors who reach the till area (a proxy for purchase intent); (d) Return Rate — the percentage of visitors who return within 30 days. Step 5: After 90 days of data, rank stores by normalised footfall and dwell time. Stores in the bottom quartile on both metrics, in locations with strong external pedestrian counts, are candidates for lease renegotiation or format change rather than closure.
Übungsfragen
Q1. You are the IT Director for a 25-site quick-service restaurant chain. The operations team wants to use WiFi data to optimise kitchen staffing in real time. Your current AP estate is a mix of consumer-grade routers installed by individual franchisees. What are the three most critical infrastructure decisions you need to make before the analytics project can proceed?
Hinweis: Consider the gap between consumer-grade and enterprise-grade AP capabilities, the need for centralised management, and the data privacy implications of collecting location data in a food service environment.
Musterlösung anzeigen
The three critical decisions are: (1) AP estate standardisation — consumer-grade routers do not support probe request capture APIs or centralised location services. You must mandate a migration to enterprise-grade APs (e.g., Cisco Meraki, Aruba Instant-On, or equivalent) across all 25 sites before analytics deployment is feasible. Budget for this as a prerequisite capital project. (2) Centralised controller or cloud management — with 25 sites and multiple franchisees, you need a single cloud management platform that aggregates probe data from all sites into one analytics engine. Decentralised management makes cross-site benchmarking impossible. (3) GDPR and data governance framework — collecting location data in a public food service environment requires a clear legal basis (legitimate interests assessment is the most appropriate basis for anonymous footfall analytics), a privacy notice update, and a data retention policy. Franchisees are likely joint data controllers, which requires a formal data sharing agreement. Without this framework, the project carries regulatory risk that outweighs the operational benefit.
Q2. A stadium operator has deployed WiFi footfall analytics across a 60,000-capacity venue. After three months, the analytics platform reports an average of 85,000 unique devices per event — significantly higher than the ticket sales figure. The vendor claims the data is accurate. What is the most likely technical explanation, and how would you validate it?
Hinweis: Think about the multiple sources of device signals in a dense stadium environment and the specific challenges of MAC randomisation in high-density settings.
Musterlösung anzeigen
The most likely explanation is a combination of three factors: (1) MAC randomisation inflation — in a dense environment with 60,000 people, each person's device may generate multiple distinct randomised MAC addresses over a 3-hour event, each counted as a unique device. Without robust temporal clustering and session stitching, this alone can inflate counts by 30–50%. (2) Multiple devices per person — stadium attendees frequently carry smartphones, smartwatches, and tablets simultaneously, each generating independent probe streams. (3) External device bleed — in an urban stadium, probe requests from devices in adjacent streets, car parks, and public transport may be captured by perimeter APs. To validate, run a controlled calibration event: sell exactly 1,000 tickets to a section of the venue, count the physical attendees manually, and compare against the WiFi count for that section's APs only. If the WiFi count exceeds 1,000 by more than 20%, the deduplication algorithm requires tuning. The vendor should be able to demonstrate their MAC randomisation handling methodology and provide calibration data from comparable dense-venue deployments.
Q3. A regional shopping centre operator wants to use WiFi footfall analytics to provide tenant retailers with monthly performance reports, benchmarking each store's dwell time and footfall against the centre average. The legal team has raised concerns about sharing this data with third-party tenants. How do you structure the data sharing to address these concerns while still delivering value to tenants?
Hinweis: Consider the difference between sharing raw data and sharing aggregated, anonymised benchmarks, and the contractual framework needed for legitimate data sharing with tenants.
Musterlösung anzeigen
The legal concern is valid but manageable with the right data architecture. The solution has three components: (1) Aggregation threshold — never share data for any reporting period where the visitor count for a specific zone falls below 50 unique devices. This prevents re-identification of individuals from small-sample datasets and is consistent with GDPR anonymisation guidance from the ICO and EDPB. (2) Relative benchmarking only — share each tenant's metrics as an index relative to the centre average (e.g., 'your dwell time is 18% above the centre average for comparable retail categories'), not as absolute counts. This prevents tenants from inferring competitor performance from the benchmark data. (3) Contractual framework — include a data sharing clause in the tenant lease agreement that specifies: the legal basis for sharing (legitimate interests of the centre operator and tenant for performance management), the data categories shared (aggregated, anonymised footfall and dwell time indices), the retention period, and the prohibition on tenants attempting to re-identify individuals. With this structure, the data sharing is both legally defensible and commercially valuable.
Weiterlesen in dieser Reihe
Privacy by Design: Anonymisierung von WiFi-Daten für die GDPR-Konformität
Dieser maßgebliche Leitfaden beschreibt die technische Architektur und Implementierungsstrategien zur Anonymisierung von WiFi-Daten, um die GDPR-Konformität sicherzustellen. Er bietet IT-Führungskräften und Netzwerkarchitekten umsetzbare Frameworks, um robuste Standortanalysen mit strengen Datenschutzanforderungen in Einklang zu bringen.
Heatmapping vs. Presence Analytics: Technische Unterschiede
Dieser maßgebliche technische Leitfaden beschreibt die entscheidenden architektonischen und operativen Unterschiede zwischen WiFi Heatmapping und Presence Analytics für Betreiber von Unternehmensstandorten. Er bietet IT-Führungskräften, Netzwerkarchitekten und Betriebsleitern umsetzbare Bereitstellungs-Frameworks, reale Implementierungsszenarien und herstellerneutrale Best Practices, um den maximalen ROI aus ihrer bestehenden drahtlosen Infrastruktur zu erzielen.
Wie man die Verweildauer mit WiFi Location Analytics berechnet
Dieser Leitfaden bietet eine umfassende technische Referenz zur Berechnung der WiFi-Verweildauer mittels WiFi Location Analytics. Er deckt die gesamte Architektur ab, von der Erfassung von 802.11 Probe Requests über die RSSI-basierte Trilateration bis zur Analyse von Geofence-Zonen. Er richtet sich an IT-Manager, Netzwerkarchitekten und Betriebsleiter von Veranstaltungsorten, die präzise, skalierbare Standortinformationen in Einzelhandel, Gastgewerbe, Gesundheitswesen und im öffentlichen Sektor implementieren müssen. Die Leser erhalten umsetzbare Implementierungsanleitungen, Fallstudien aus der Praxis und einen klaren Rahmen für die Umwandlung von Rohdaten in messbare Geschäftsergebnisse.