WiFi im Einzelhandel: Kundenprofile aus Besucherdaten erstellen
Dieser maßgebliche Leitfaden beschreibt, wie IT-Teams im Unternehmenseinzelhandel bestehende WiFi-Infrastruktur in eine robuste Engine zur Erfassung von Erstanbieterdaten umwandeln können. Er behandelt technische Architekturen, Compliance-Standards und umsetzbare Bereitstellungsstrategien zum Aufbau von Kundenprofilen aus Besucheranalysen.
Diesen Leitfaden anhören
Podcast-Transkript ansehen
Zusammenfassung für die Geschäftsleitung
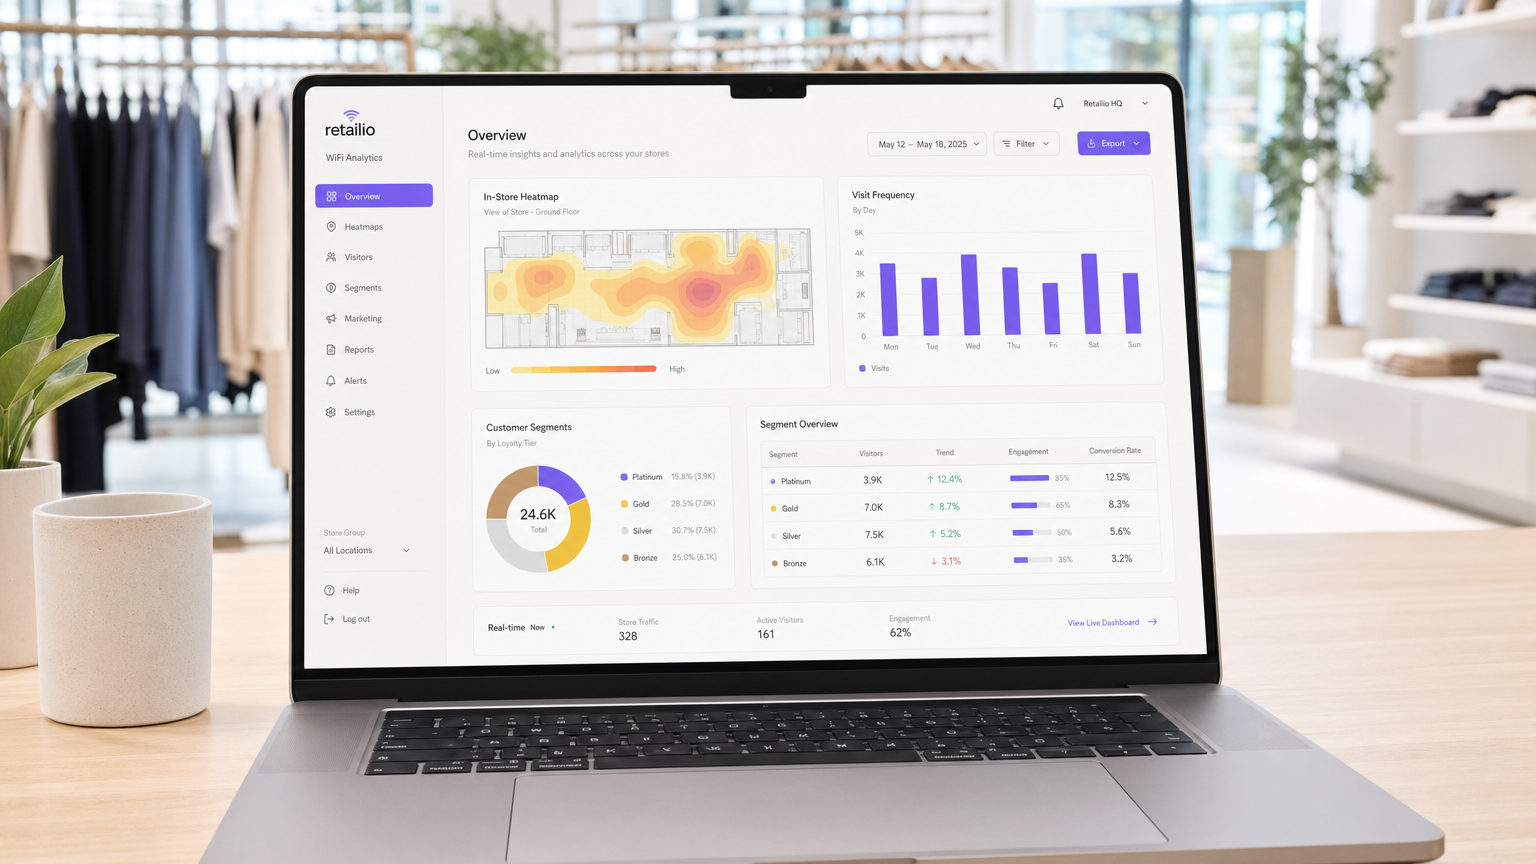
Für moderne Einzelhandelsunternehmen bleibt das physische Ladengeschäft ein entscheidender Berührungspunkt, dem jedoch oft die detaillierten Analysen fehlen, die im E-Commerce selbstverständlich sind. Dieser Leitfaden bietet einen umfassenden technischen Rahmen, um Standard-Wireless-Infrastruktur in eine Analyse-Engine der Unternehmensklasse zu verwandeln. Durch die Nutzung authentifizierter Guest WiFi -Verbindungen können IT-Leiter und Direktoren für Veranstaltungsorte passiv hochpräzise Erstanbieterdaten sammeln – einschließlich Besuchsfrequenz, Verweildauer und Pfadanalyse.
Die Bereitstellung von WiFi Analytics wandelt das Netzwerk von einem reinen Kostenfaktor in einen strategischen Geschäftswert um. Dieses Dokument beschreibt die notwendige technische Architektur, die Umstellung von passiver MAC-Erkennung auf authentifizierte Sitzungen und die kritischen Compliance-Standards (GDPR, PCI DSS, WPA3), die für eine sichere Implementierung in Einzelhandels- und Gastgewerbeumgebungen erforderlich sind.
Technischer Einblick
Die Mechanik der Datenerfassung
Wenn das Gerät eines Kunden einen Einzelhandelsbereich betritt, sendet es Probe-Anfragen, die eine Media Access Control (MAC)-Adresse enthalten. Historisch gesehen ermöglichte dies eine passive Verfolgung. Moderne Betriebssysteme erzwingen jedoch die Randomisierung von MAC-Adressen, um die Privatsphäre der Benutzer zu schützen. Um diese Einschränkung zu überwinden und eine hohe Datentreue zu gewährleisten, müssen Unternehmensbereitstellungen auf authentifizierte Verbindungen setzen.
Wenn ein Benutzer sich über ein Captive Portal verbindet, erfasst das System eine verifizierte, zugestimmte Identität. Diese Identität wird einem persistenten Geräte-Identifikator zugeordnet und bildet die Grundlage für eine robuste Kundenprofilierung.
Kern-Datenströme
- Besuchsfrequenz: Durch die Verfolgung von Wiederverbindungsereignissen erstellt das System ein longitudinales Profil der Kundenbindung.
- Verweildauer: Die Messung der Dauer aktiver Sitzungen liefert Einblicke in die Kundenbindung und korreliert stark mit der Konversionswahrscheinlichkeit.
- Pfadanalyse: Die Nutzung der Trilateration über mehrere Access Points (APs) ermöglicht die Abbildung physischer Kundenwege durch das Geschäft.
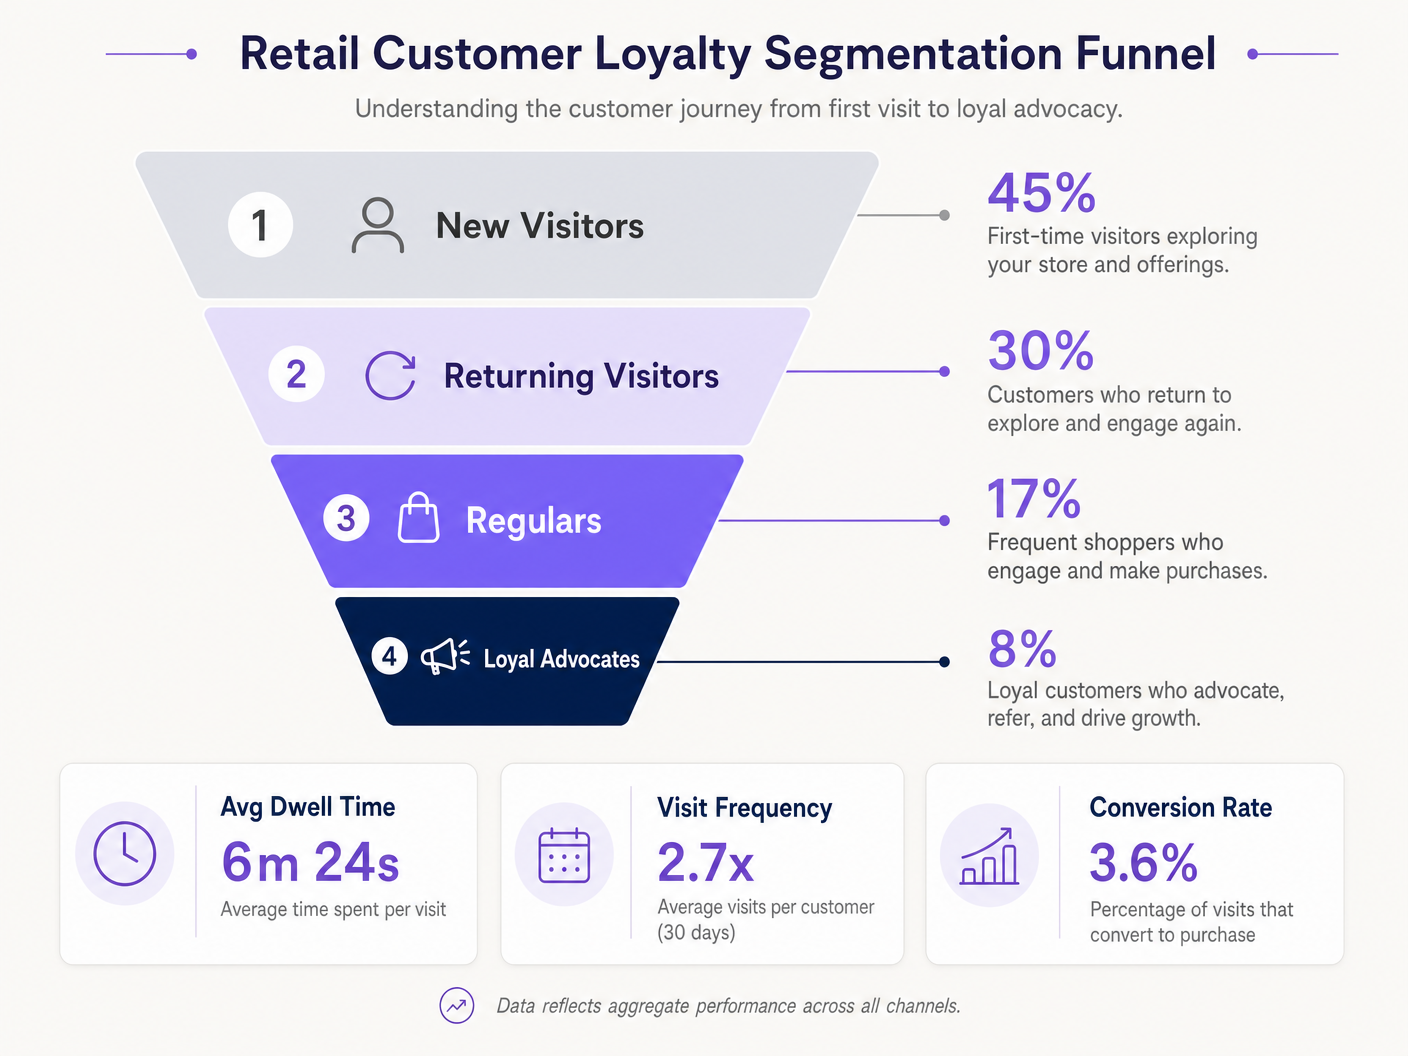
- Loyalitätssegmentierung: Die Aggregation von Frequenz und Verweildauer ermöglicht eine automatisierte Segmentierung (z. B. neue Besucher vs. loyale Fürsprecher).
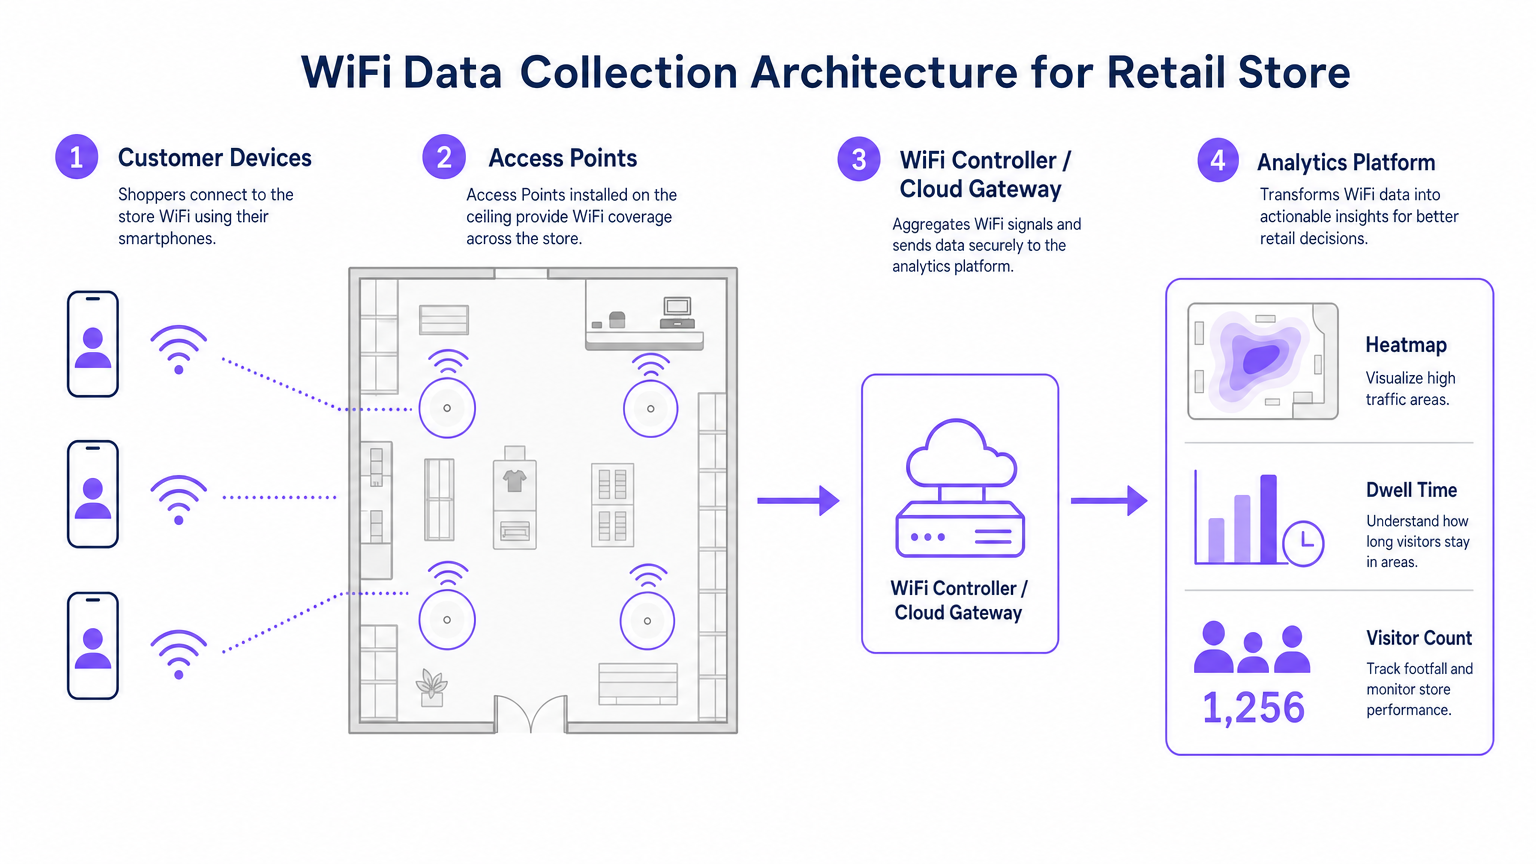
Unternehmensarchitektur
Eine robuste WiFi-Analyse-Bereitstellung im Einzelhandel besteht aus vier primären Schichten:
- Funkfrequenzinfrastruktur: Bereitstellungen mit hoher Dichte erfordern 802.11ac Wave 2 oder 802.11ax (WiFi 6) Access Points. Die Standardempfehlung ist ein AP pro 1.500–2.000 Quadratfuß, angepasst an Zonen mit hohem Verkehrsaufkommen.
- Controller/Cloud-Management-Ebene: Aggregiert Telemetriedaten von der RF-Schicht und verwaltet das Client-Roaming.
- Analyseplattform: Erfasst rohe Netzwerktelemetriedaten (Assoziationsereignisse, Signalstärke) und wandelt sie in umsetzbare Informationen um.
- Engagement-Schicht: Integriert sich über APIs oder Webhooks mit CRM-Systemen, um automatisierte Marketing-Workflows basierend auf Echtzeit-Raumdaten auszulösen.
Hören Sie unser vollständiges technisches Briefing zur Bereitstellung dieser Architekturen:
Implementierungsleitfaden
Eine erfolgreiche Bereitstellung erfordert eine Abstimmung zwischen Netzwerktechnik und Geschäftsbetrieb.
- Authentifizierungsfluss optimieren: Implementieren Sie ein reibungsloses Captive Portal. Minimieren Sie Eingabefelder, um die Opt-in-Raten zu maximieren, und stellen Sie gleichzeitig klare Zustimmungsmechanismen sicher. Erwägen Sie die Integration bestehender Anmeldeinformationen von Treueprogrammen.
- Design für Triangulation: Standard-Abdeckungsdesigns sind für die Pfadanalyse unzureichend. Stellen Sie sicher, dass mindestens drei Access Points eine überlappende Abdeckung in wichtigen Tracking-Zonen bieten, um eine genaue Trilateration zu ermöglichen.
- Key Performance Indicators (KPIs) definieren: Legen Sie vor dem Start Basis-Metriken fest. Gängige KPIs umfassen die durchschnittliche Verweildauer pro Zone, das Verhältnis von neuen zu wiederkehrenden Besuchern und die Spitzenzeiten der Besucherfrequenz.
Best Practices
- Hardware standardisieren: Sorgen Sie für konsistente AP-Hardware an allen Standorten, um eine einheitliche Signaltelemetrie aufrechtzuerhalten und die Datennormalisierung auf der Analyseebene zu vereinfachen.
- Netzwerke isolieren: Trennen Sie den Gastverkehr strikt von Unternehmens- und Point-of-Sale (POS)-Netzwerken mithilfe dedizierter VLANs und SSIDs, um die PCI DSS-Konformität zu gewährleisten.
- Datenaufbewahrung automatisieren: Konfigurieren Sie die Analyseplattform so, dass Rohsitzungsdaten nach einem definierten Zeitraum (z. B. 12 Monate) automatisch gelöscht werden, um das Compliance-Risiko unter GDPR zu minimieren.
Für einen breiteren Implementierungskontext in verschiedenen Sektoren siehe unsere Leitfäden zu Hospitality WiFi Solutions: Was bei einem Anbieter zu beachten ist und Wi Fi in Auto: Der vollständige Unternehmensleitfaden 2026 .
Fehlerbehebung & Risikominderung
| Fehlermodus | Symptom | Minderungsstrategie |
|---|---|---|
| Geringe Triangulationsgenauigkeit | Standortdaten springen unregelmäßig über den Grundriss. | Führen Sie eine vorausschauende RF-Standortuntersuchung durch; erhöhen Sie die AP-Dichte in kritischen Zonen; stellen Sie sicher, dass APs in einheitlichen Höhen montiert sind. |
| Niedrige Authentifizierungsraten | Hohe passive Besucherfrequenz, aber geringe Anzahl registrierter Benutzer. | Vereinfachen Sie die Captive Portal UI; bieten Sie Social-Login-Optionen an; stellen Sie sicher, dass die Splash-Seite vollständig responsiv ist. |
| Datensilos | Analysedaten erreichen das CR"M. | Überprüfen Sie die Konnektivität des API-Endpunkts; überprüfen Sie die Webhook-Zustellungsprotokolle; stellen Sie sicher, dass die Daten-Payload-Formate den CRM-Schemaanforderungen entsprechen. |
ROI & Geschäftsauswirkungen
Der Übergang zu einer analysegesteuerten WiFi-Bereitstellung führt zu messbaren Geschäftsergebnissen. Einzelhändler berichten durchweg von:
- Erhöhte Konversionsraten: Direkt korreliert mit gezielten Engagement-Strategien, basierend auf der Verweildauer.
- Optimierte Ladenlayouts: Datengestützte Entscheidungen zur Produktplatzierung, abgeleitet aus der Pfadanalyse.
- Verbesserte Kundenbindung: Automatisierte Re-Engagement-Kampagnen, ausgelöst durch Schwellenwerte für inaktive Besucher.
Durch die Überbrückung der Lücke zwischen physischen Abläufen und digitaler Intelligenz bieten Enterprise WiFi-Analysen einen entscheidenden Wettbewerbsvorteil in der modernen Einzelhandelslandschaft.
Schlüsseldefinitionen
MAC Address Randomisation
A privacy feature in modern operating systems that broadcasts a fake MAC address during network probing, preventing passive tracking.
Forces IT teams to rely on authenticated connections rather than passive listening for accurate footfall analytics.
Trilateration
The process of determining absolute or relative locations of points by measurement of distances, using the geometry of circles, spheres or triangles.
Used by the analytics platform to calculate a device's physical location based on signal strength received by multiple APs.
Captive Portal
A web page that the user of a public-access network is obliged to view and interact with before access is granted.
The primary mechanism for capturing user consent and identity to build first-party data profiles.
Dwell Time
The total duration a customer's device remains continuously associated with the WiFi network during a single visit.
A critical metric for marketing teams to gauge customer engagement and intent.
802.11ax (WiFi 6)
The latest standard for wireless networks, offering higher throughput, better performance in dense environments, and improved power efficiency.
The recommended hardware standard for enterprise retail environments requiring high-density analytics.
PCI DSS
Payment Card Industry Data Security Standard; a set of security standards designed to ensure that all companies that accept, process, store or transmit credit card information maintain a secure environment.
Mandates strict network segregation between guest WiFi and point-of-sale systems.
VLAN (Virtual Local Area Network)
A logical subnetwork that groups a collection of devices from different physical LANs.
Used to securely isolate guest WiFi traffic from internal corporate networks.
First-Party Data
Information a company collects directly from its customers and owns entirely.
The ultimate output of a successful retail WiFi analytics deployment, highly valuable for targeted marketing.
Ausgearbeitete Beispiele
A 50-store retail chain needs to implement footfall tracking to optimize staffing, but their current network only provides passive MAC detection, resulting in highly inaccurate data due to MAC randomization.
Deploy a captive portal authentication system integrated with the existing WiFi controllers. Configure the portal to require a simple email or social login in exchange for free WiFi access. Map the authenticated identity to the device's persistent identifier, bypassing the randomized MAC issue. Integrate this data feed via API into the central workforce management system to align staffing levels with verified peak footfall hours.
A large conference centre wants to track attendee flow between different exhibition halls to justify premium pricing for certain vendor booths.
Redesign the RF layout specifically for location analytics rather than just coverage. Deploy additional 802.11ax access points to ensure at least three APs overlap in key transition corridors, enabling accurate trilateration. Feed the signal strength telemetry into the analytics platform to generate real-time heatmaps and path analysis reports for the events team.
Übungsfragen
Q1. Your marketing team wants to implement path analysis to track customer movement around a new product display. The store currently has two access points providing adequate signal coverage for connectivity. What is the necessary technical recommendation?
Hinweis: Consider the requirements for spatial calculation.
Musterlösung anzeigen
You must advise the marketing team that path analysis requires trilateration. Therefore, you need to deploy at least one additional access point to ensure the target area is covered by overlapping signals from a minimum of three APs.
Q2. During a security audit, it is discovered that the guest WiFi network and the POS terminals are operating on the same physical switch without logical separation. What is the immediate compliance risk and remediation?
Hinweis: Think about payment security standards.
Musterlösung anzeigen
This configuration violates PCI DSS requirements. The immediate remediation is to configure separate VLANs on the switch to logically isolate the guest traffic from the POS network, ensuring no lateral movement is possible.
Q3. The operations director notes that while the system reports 1,000 visitors per day based on passive MAC detection, the authenticated user count is only 150. How do you explain this discrepancy?
Hinweis: Consider modern mobile OS features.
Musterlösung anzeigen
Explain that modern smartphones use MAC address randomisation when probing for networks, which artificially inflates passive counts as a single device may broadcast multiple fake MACs. The authenticated count of 150 represents the true, high-fidelity data of users who actively engaged with the captive portal.
Weiterlesen in dieser Reihe
Privacy by Design: Anonymisierung von WiFi-Daten für die GDPR-Konformität
Dieser maßgebliche Leitfaden beschreibt die technische Architektur und Implementierungsstrategien zur Anonymisierung von WiFi-Daten, um die GDPR-Konformität sicherzustellen. Er bietet IT-Führungskräften und Netzwerkarchitekten umsetzbare Frameworks, um robuste Standortanalysen mit strengen Datenschutzanforderungen in Einklang zu bringen.
Heatmapping vs. Presence Analytics: Technische Unterschiede
Dieser maßgebliche technische Leitfaden beschreibt die entscheidenden architektonischen und operativen Unterschiede zwischen WiFi Heatmapping und Presence Analytics für Betreiber von Unternehmensstandorten. Er bietet IT-Führungskräften, Netzwerkarchitekten und Betriebsleitern umsetzbare Bereitstellungs-Frameworks, reale Implementierungsszenarien und herstellerneutrale Best Practices, um den maximalen ROI aus ihrer bestehenden drahtlosen Infrastruktur zu erzielen.
Wie man die Verweildauer mit WiFi Location Analytics berechnet
Dieser Leitfaden bietet eine umfassende technische Referenz zur Berechnung der WiFi-Verweildauer mittels WiFi Location Analytics. Er deckt die gesamte Architektur ab, von der Erfassung von 802.11 Probe Requests über die RSSI-basierte Trilateration bis zur Analyse von Geofence-Zonen. Er richtet sich an IT-Manager, Netzwerkarchitekten und Betriebsleiter von Veranstaltungsorten, die präzise, skalierbare Standortinformationen in Einzelhandel, Gastgewerbe, Gesundheitswesen und im öffentlichen Sektor implementieren müssen. Die Leser erhalten umsetzbare Implementierungsanleitungen, Fallstudien aus der Praxis und einen klaren Rahmen für die Umwandlung von Rohdaten in messbare Geschäftsergebnisse.