
By mid-2026, an estimated 29.4 billion devices are actively connected to the internet globally - representing an average of more than 3.5 connected endpoints for every human on Earth. This staggering figure is driven by the rapid growth of enterprise Internet of Things (IoT) sensors, medical telematics, and personal mobile hardware.
Key takeaways for IT and venue leaders
- 29.4 billion global connected endpoints: Total internet-connected devices have grown from 15.1 billion in 2020 to nearly 30 billion in 2026.
- IoT outpaces consumer hardware: Machine-to-machine (M2M) and IoT devices now make up over 64% of all active online connections.
- UK mobile density hits 143%: The UK has over 99.3 million cellular connections, backed by 5G standalone networks and fiber infrastructure.
- Network capacity strain: High device density causes severe IP pool exhaustion, airtime contention, and unmanaged security vulnerabilities unless managed via 802.1X and dynamic VLAN segmentation.
The global scale of connected devices in 2026
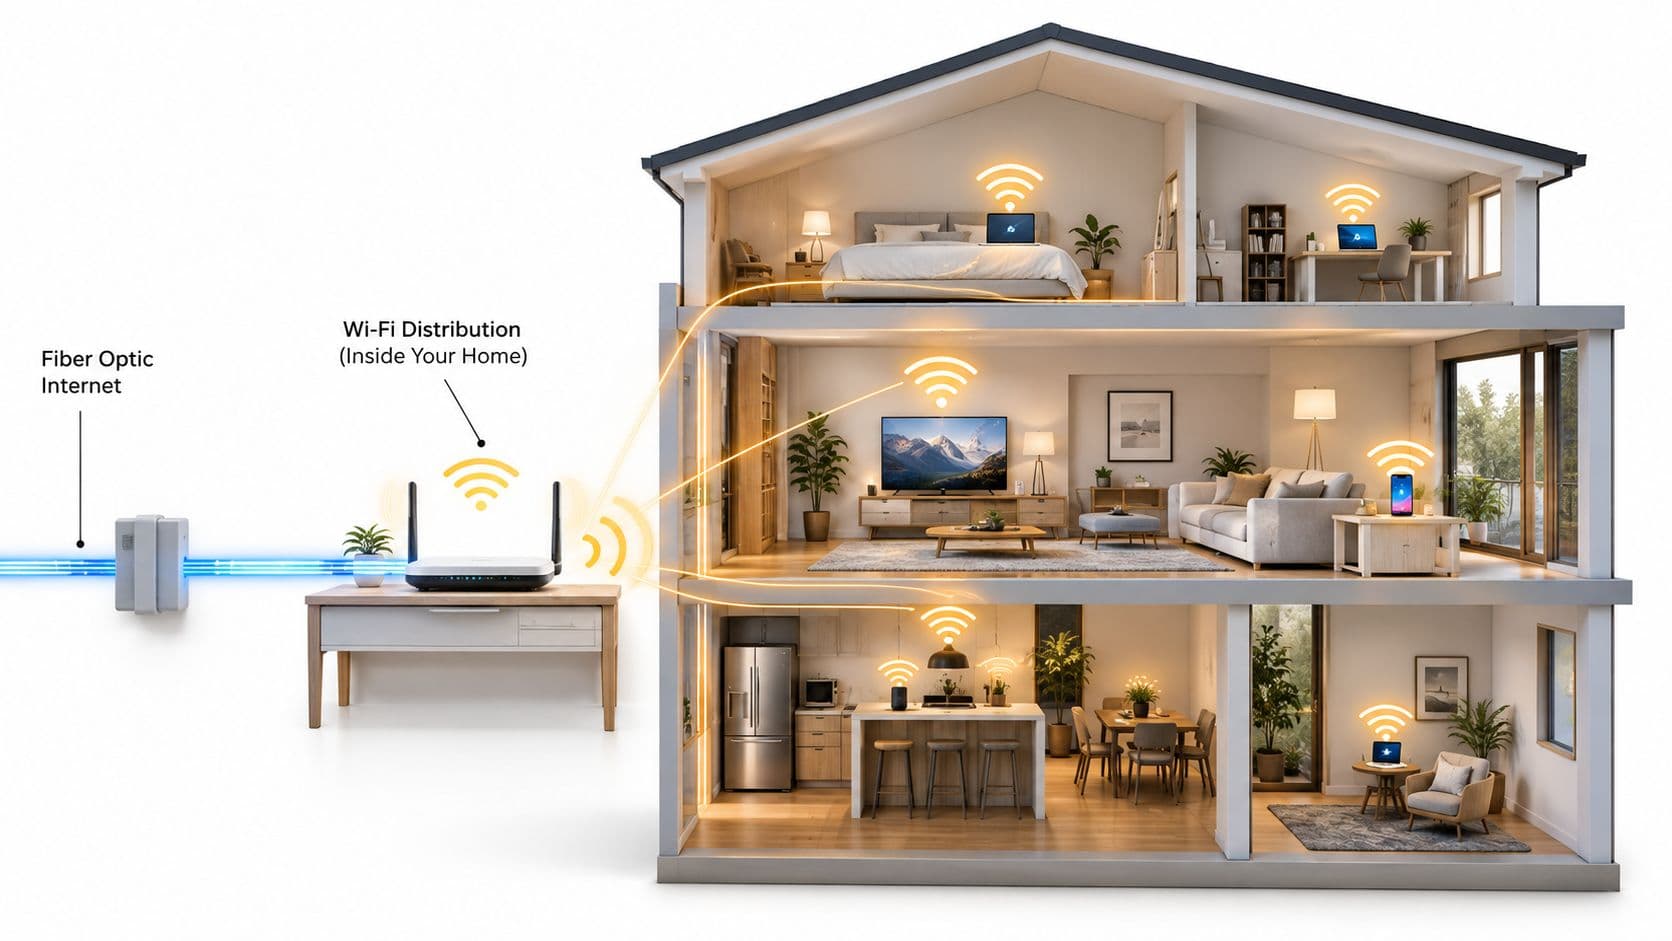
Imagine every individual in an enterprise office carrying four connected devices simultaneously - a smartphone, laptop, smartwatch, and tablet. When combined with smart building automation, inventory scanners, and security cameras, the physical environment transforms into a dense digital web.
For decades, "connected devices" referred strictly to desktop computers and mobile phones. Today, the ecosystem spans industrial sensors, healthcare telemetry, connected fleets, and guest WiFi portals. Industry analysts from Gartner and GSMA Intelligence project that total connected endpoints will exceed 34 billion by 2028.
Consumer endpoints vs IoT machine-to-machine growth
To analyze network density, device traffic is split into two primary categories:
- Consumer mobile devices: Smartphones, laptops, tablets, and wearables. While consumer adoption remains steady, individual users now maintain an average of 3 to 5 active wireless connections throughout their workday.
- Enterprise IoT and M2M connections: This category represents the fastest-growing sector. Machine-to-machine nodes include environmental sensors, point-of-sale terminals, smart lighting, and automated access control systems.
In high-density environments like hospitals, hotels, and university campuses, unmanaged guest hardware competes directly with mission-critical operational systems for wireless airtime and bandwidth.
How research firms quantify billions of online devices
Because no single centralized registry tracks every global IP address, market intelligence firms use a multi-layered telemetry methodology to estimate global connection volume:
- Global hardware shipment tracking: Monitoring semiconductor sales, WiFi module shipments, and cellular chipset distributions.
- Anonymized carrier network telemetry: Analyzing aggregated packet traffic across major internet service providers (ISPs) and 5G mobile operators.
- Enterprise infrastructure audits: Conducting structured surveys across corporate IT departments, healthcare trusts, and hospitality groups to benchmark average device-to-user ratios.
This combined approach provides venue operators with reliable benchmarks for network architecture, bandwidth sizing, and DHCP pool allocation.
The UK hyper-connected landscape
The United Kingdom serves as a benchmark for hyper-connected digital environments. Active cellular connections in the UK surpassed 99.3 million in late 2025 - representing a 143% penetration rate relative to the national population.
UK connectivity statistics and infrastructure growth
Managing high device density in commercial venues
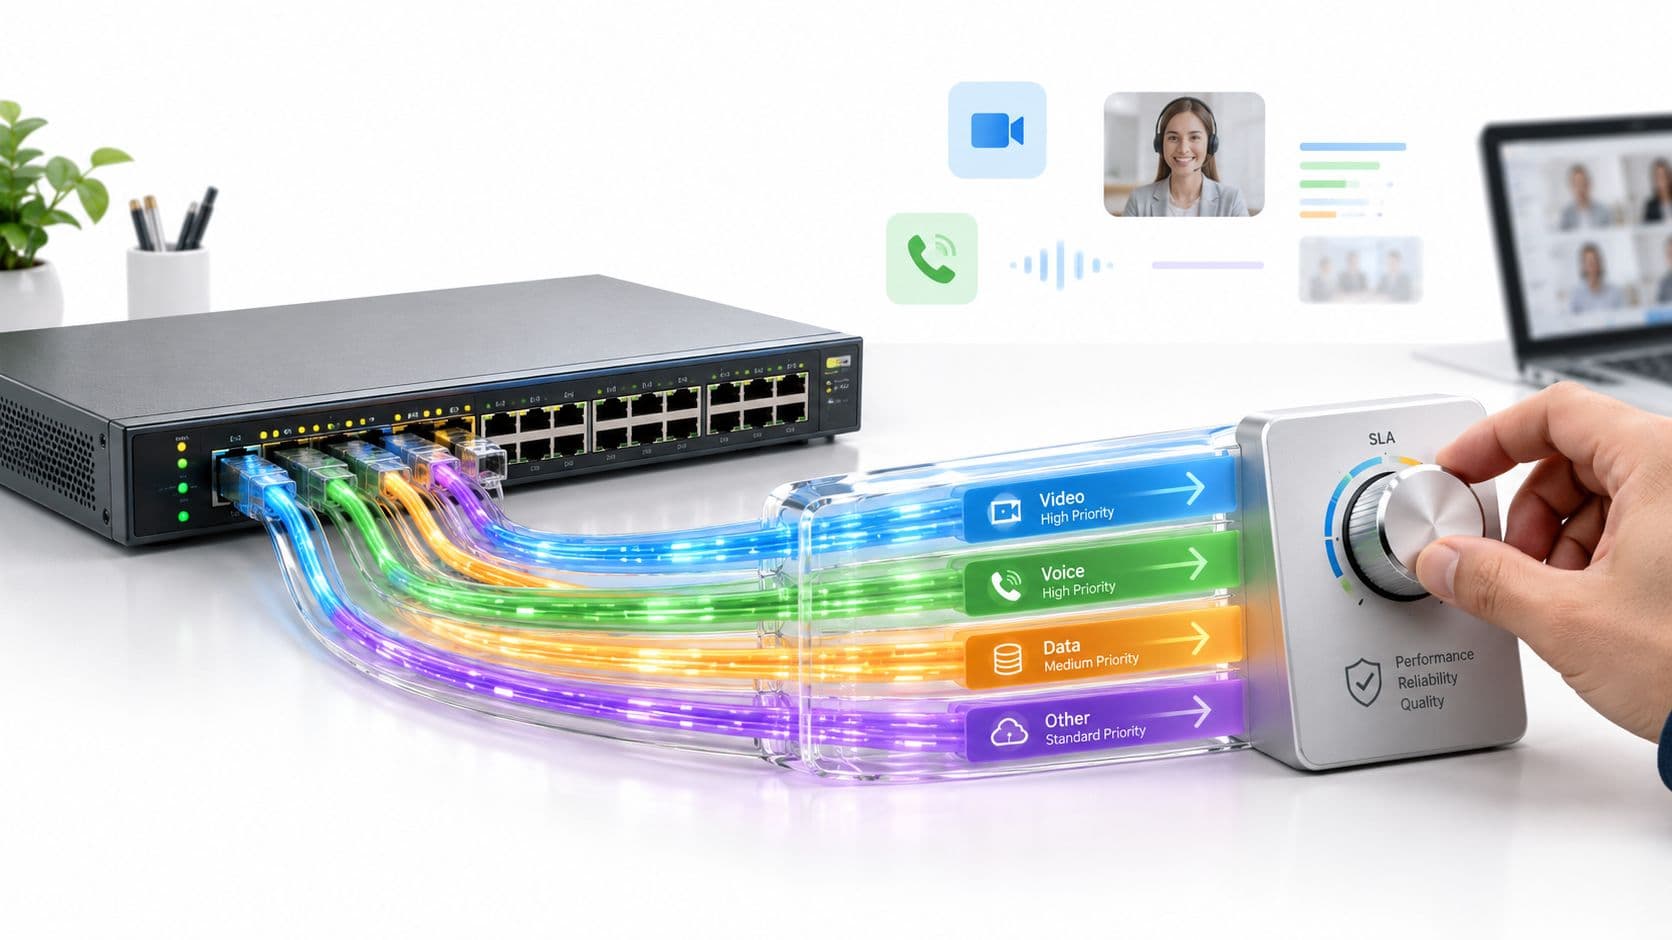
As device density scales, traditional venue networks experience three critical failure points:
- DHCP pool exhaustion: Short lease times and small IPv4 subnets (/24) run out of assignable IP addresses during peak hours.
- Wireless co-channel interference: Legacy 2.4 GHz and unmanaged 5 GHz channels saturate quickly, degrading throughput for all connected users.
- Unsecured IoT attack vectors: Headless IoT hardware lacking standard 802.1X credentials introduces vulnerability to local networks.
To overcome these challenges, enterprise network architects implement identity-based security mechanisms such as Dynamic MPSK / iPSK and automated captive portal solutions that isolate guest traffic from internal IT infrastructure.
For detailed technical strategies on securing enterprise wireless environments, explore our Enterprise WiFi Security Guide or test network capacity using the Purple Network Multi Tool.