Your e-commerce team can tell you which ad drove the click, which page caused the drop-off, and which email recovered the cart. Then a customer walks into one of your stores and the picture goes blurry. You know the day's sales total. You probably know staffing levels. You may even know campaign timings. But you often don't know whether the promotion increased visits, whether shoppers stayed long enough to engage, or whether they came back the following week.
That gap frustrates both sides of the business. Marketing wants attribution and audience insight. IT wants a secure, supportable system that does not create risk. Store operations just want something useful enough to act on.
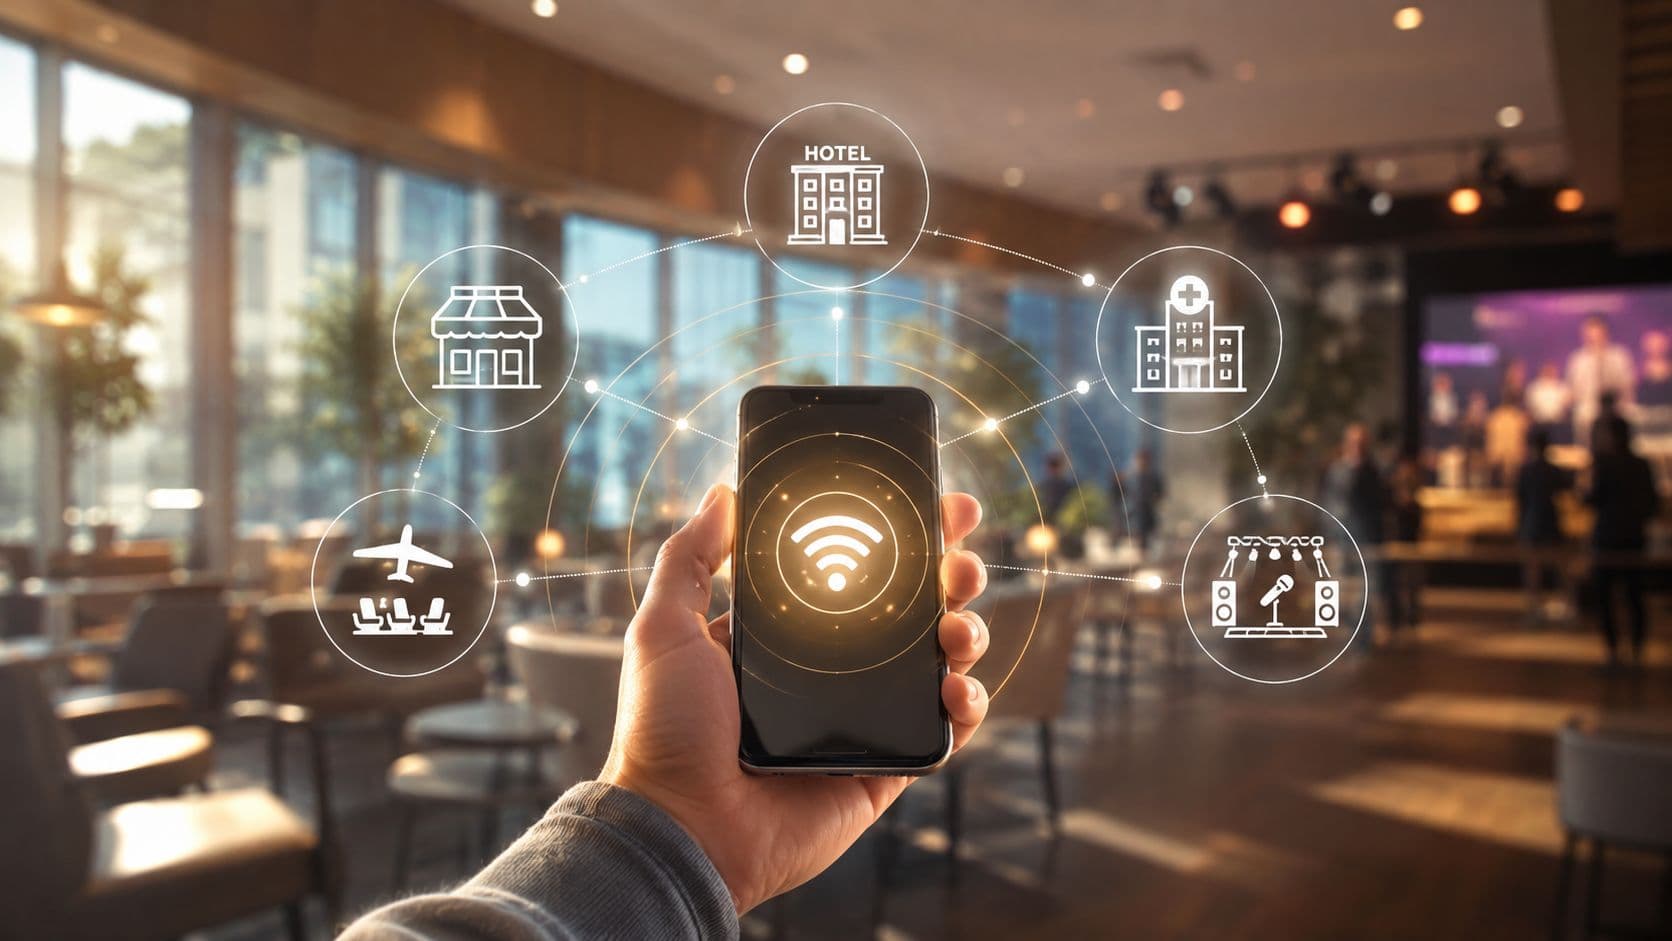
That's where retail WiFi analytics earns its place. In the United States, most adults are active internet users, and the vast majority of those users connect to the internet using a cell phone. High mobile adoption rates across all age demographics mean in-store network data has practical value for modern retail environments (retail WiFi analytics context). Most shoppers already carry the device that makes this analysis possible.
Bridging the Physical and Digital Divide
A common retail problem looks like this. An online campaign performs well, branded search rises, product pages get traffic, and store teams still report patchy in-store impact. The marketing director thinks the campaign worked. The regional manager says traffic felt soft. IT says the network can probably capture useful signals, but nobody has agreed what specific questions the business needs answered.
Physical retail often runs on partial evidence. Sales data tells you what was bought. It rarely tells you what almost happened.
That matters because stores are no longer just transaction points. They're brand environments, fulfillment nodes, service desks, and campaign destinations. If you already build your online store with Shopstar, you've probably become used to digital reporting that makes every step visible. The store estate deserves the same discipline.
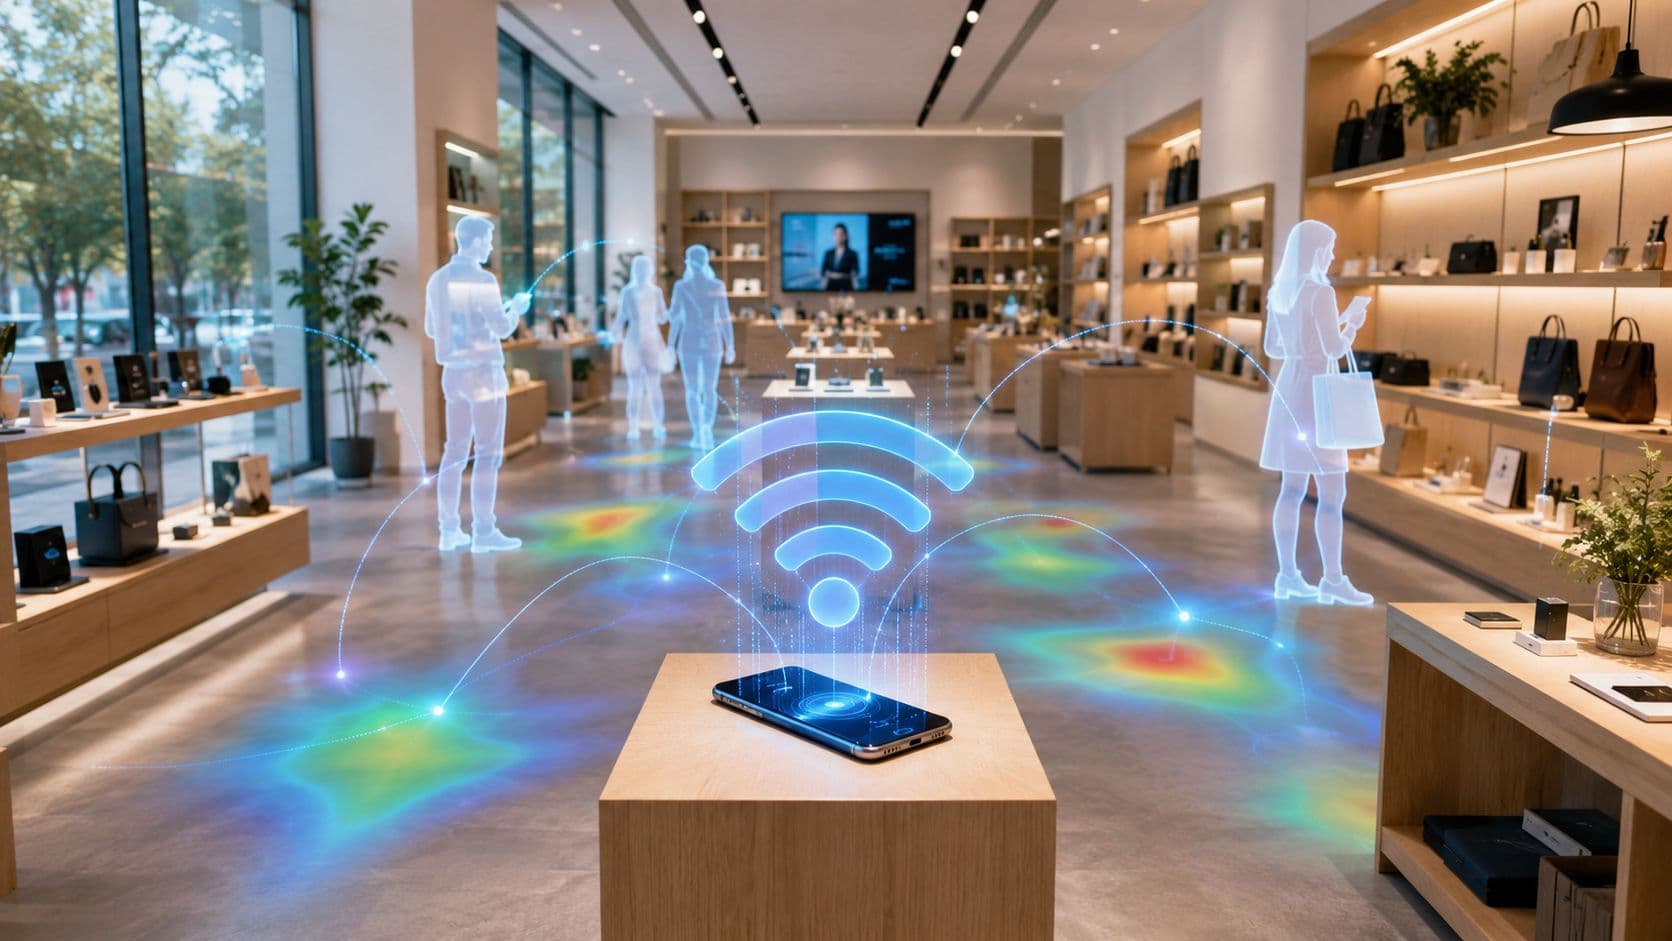
Retail WiFi analytics closes that gap by turning the wireless environment into a measurement layer. Instead of asking only, “What did we sell?”, teams can ask better questions. How many people came in? Where did they spend time? Did they return? Did a display near the entrance pull people deeper into the store, or did traffic stall at the front?
Physical retail becomes easier to improve once movement, dwell, and return behavior stop being guesswork.
For marketing, that means better campaign evaluation and cleaner first-party data thinking. For IT, it means using infrastructure already present in-store to produce operational insight. For both teams, platforms built for retail guest WiFi and analytics can act as the bridge between customer engagement and network data, provided the deployment is planned properly.
How Retail WiFi Analytics Works
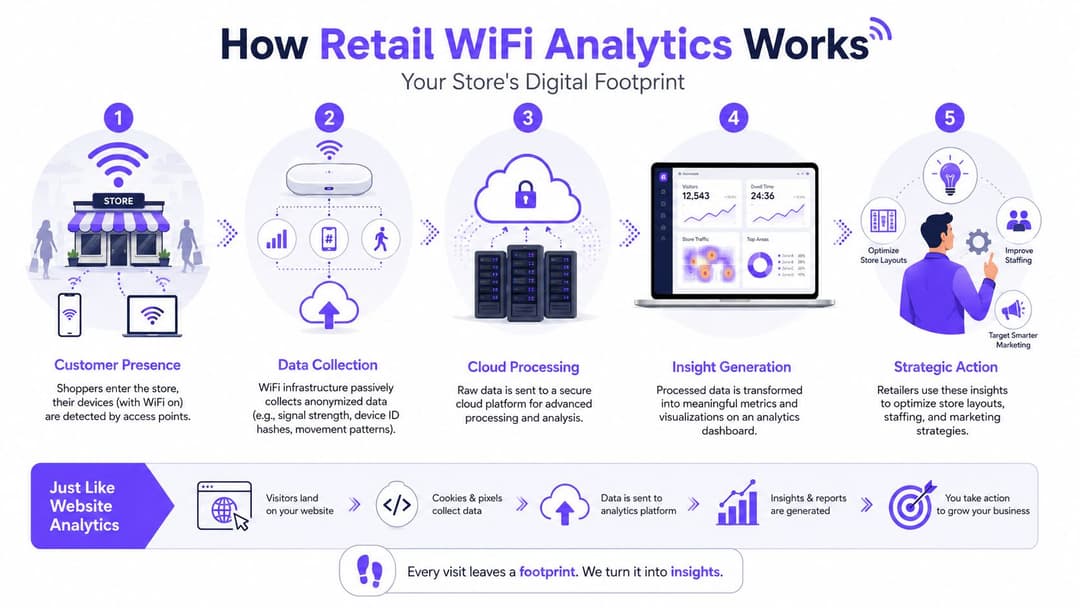
Think of retail WiFi analytics as website analytics for a physical venue. A website logs page views, session length, and returning users. A store can do something similar through the wireless signals around it, but the mechanics are different and the privacy rules are stricter.
Two collection methods
The strongest setups combine two kinds of data. First-party association data comes from devices that connect to the guest network. Probe-based presence detection captures signals from nearby devices to estimate wider traffic patterns. Used together, they provide a fuller view of foottraffic, dwell time, repeat visits, and in-store flow than connected sessions alone (how combined presence and connected analytics work).
That distinction matters.
- Presence detection is useful when you need broad visibility into store traffic. It helps answer operational questions such as whether a campaign increased store visits or whether a front-of-store display changed traffic flow.
- Connected analytics becomes more valuable when a shopper joins guest WiFi. That creates a stronger first-party relationship and usually supports richer engagement, assuming your privacy design is sound.
- Together they stop teams from making the classic mistake of reading guest WiFi logins as if they represent total store visits.
From raw signal to usable metric
Access points and analytics layers don't hand you business insight automatically. Raw wireless events are messy. Devices move in and out of range, pause outside the entrance, and sometimes appear briefly without reflecting meaningful store engagement. A decent platform processes that noise into something managers can work with.
Here's the practical flow:
- Detection happens at the access point level. The network sees connected devices and presence signals in range.
- Data is normalized in the analytics platform. That's where duplicate events, weak detections, and noisy movement patterns get cleaned up.
- Locations and zones are mapped. This is how “the back wall”, “fitting room area”, or “promotional table” becomes measurable rather than anecdotal.
- Dashboards surface operational metrics. Store, marketing, and IT teams each need different views of the same environment.
- Actions are tied to change events. Layout move. Campaign launch. Staffing adjustment. New signage.
A useful mental model is a digital turnstile plus a journey map. The turnstile tells you how many people entered. The journey map tells you what they did once inside.
For teams evaluating vendors, it helps to review a WiFi analytics guide for venue measurement before procurement starts. The technical model is simple enough. The challenge is deciding which signals are worth operationalizing.
The Key Performance Indicators That Matter
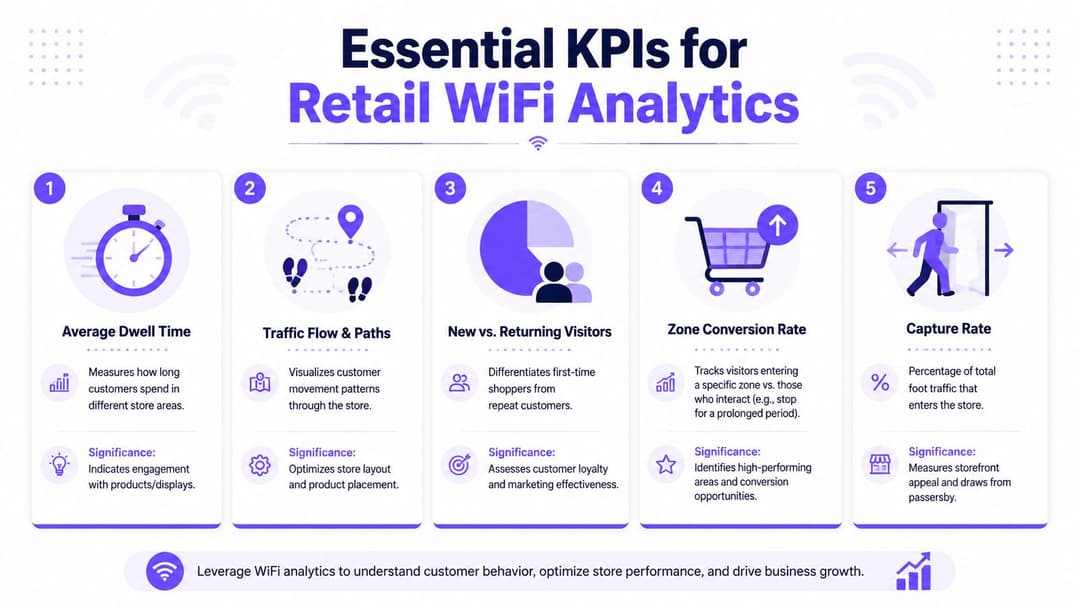
Retailers can drown in dashboards if they don't choose a small set of measures that drive decisions. In practice, the most useful outputs are foottraffic statistics, average time spent in store, and repeat-visit rates, because those feed staffing, merchandising, and promotional timing decisions through the existing in-store wireless infrastructure (retail WiFi analytics operational metrics).
Footfall and what it really tells you
Foottraffic is the starting point, not the finish line. It answers a simple question: how many visitors does the store attract over a given period?
On its own, footfall is useful for scheduling and trend tracking. It becomes more valuable when compared against campaign timing, weather effects, local events, and store changes. If visits rise but sales stay flat, you may have a conversion problem in-store rather than a traffic problem.
A marketing team often treats foot traffic as proof that awareness activity worked. Operations should push one step further and ask whether those visitors moved beyond the entrance zone and engaged with the space.
Dwell time and traffic flow
Dwell time shows how long visitors stay in the store or in specific zones. This is one of the clearest indicators of whether the environment is holding attention.
Short dwell can mean different things depending on the format. In a convenience-led store, a shorter visit may reflect efficiency. In a fashion or experiential setting, it can suggest weak merchandising, poor adjacencies, or displays that are not stopping people.
Traffic flow adds another layer. It shows where people move, not where planners assume they move.
| KPI | Business question | Typical action |
|---|---|---|
| Foottraffic | Are campaigns and storefront changes increasing visits? | Adjust windows, local marketing, staffing |
| Dwell time | Are shoppers engaging with the environment? | Rework displays, fixture placement, service points |
| Traffic flow | Which zones attract or lose attention? | Shift hero products, signage, aisle layout |
Practical rule: Do not judge a display by sales alone. Check whether people stopped, how long they stayed, and whether they moved deeper into the store afterward.
Repeat visits and capture behavior
Repeat-visit rate is where retail WiFi analytics starts becoming strategically interesting. It tells you whether the store gives people a reason to come back, which is often more revealing than one-off spikes in traffic.
Then there's capture rate, which many teams define as the share of passing traffic that enters. This metric can be useful, but it's easy to misuse because definitions vary by site and sensor setup. Treat it as a directional indicator unless your counting logic is tightly governed.
A final warning. Do not fill reports with twenty metrics because the dashboard allows it. Most retail teams get more value by choosing a small KPI set and tying each one to an owner, a decision, and a review cycle.
Transforming Data into Retail Strategy
The difference between a clever dashboard and a useful retail program is what happens after the report lands. Good teams don't admire the heatmap. They change something because of it, then measure what happened next.
Using movement data to change the store floor
A store layout should be treated as a testable hypothesis. If a category is underperforming, the first question shouldn't always be price or stock. It may be visibility. WiFi-derived movement and zone engagement data can show whether shoppers even reached that part of the store and whether they paused once they got there.
Common uses include:
- Entrance optimization. If visitors bunch near the door and fail to progress, the threshold may be cluttered or the visual pathway may be weak.
- Fixture testing. If shoppers spend time in one promotional zone but ignore another, merchandising teams can compare placement, sightline, and message rather than relying on instinct.
- Service deployment. If lines or consultation areas create crowding in one zone, managers can adjust staffing and floor support where it changes behavior.
The key is sequencing. Make one change, define the outcome you expect, and review the relevant KPI after the change window. If you alter pricing, signage, staffing, and layout at once, the data becomes much harder to interpret.
Joining marketing and operations
Marketing often asks, “Did the campaign work?” Operations asks, “What changed in the building?” Retail WiFi analytics helps answer both at the same time.
If a campaign drives more visits but average time in-store drops, that may indicate weak landing execution in the physical environment. If repeat visits improve after a service or loyalty initiative, that's a stronger sign of behavioral change than sales alone, especially when stock availability or seasonality may distort revenue readings.
This is also where integrated platforms matter. Tools such as Purple can combine guest WiFi access, analytics, and customer data capture so marketing can work with first-party signals while IT retains control over authentication and network policy. That isn't the only model on the market, but it's a practical one for organizations trying to reduce the gap between engagement and infrastructure.
A strong retail WiFi analytics program doesn't replace POS, loyalty, or campaign reporting. It gives those systems physical context.
Why complex venues need more than footfall
In shopping centers, transit hubs, and mixed-use sites, plain visitor counts tell only part of the story. Operators need to distinguish dwell time, repeat visitation, and zone-level engagement because foot traffic alone is a weak proxy for value in environments with uneven occupancy and shifting lease performance (WiFi analytics in complex retail environments).
That changes the conversation with tenants and site managers. Instead of reporting that a corridor was busy, landlords can ask whether visitors lingered, whether they returned, and which zones drew sustained attention. Those are more commercially relevant questions.
This logic travels well beyond retail. If you manage customer-facing venues in foodservice, a KPI framework built to boost your restaurant's bottom line can sharpen how you think about repeat behavior, zone performance, and operational timing across physical spaces.
Your Implementation and Compliance Checklist
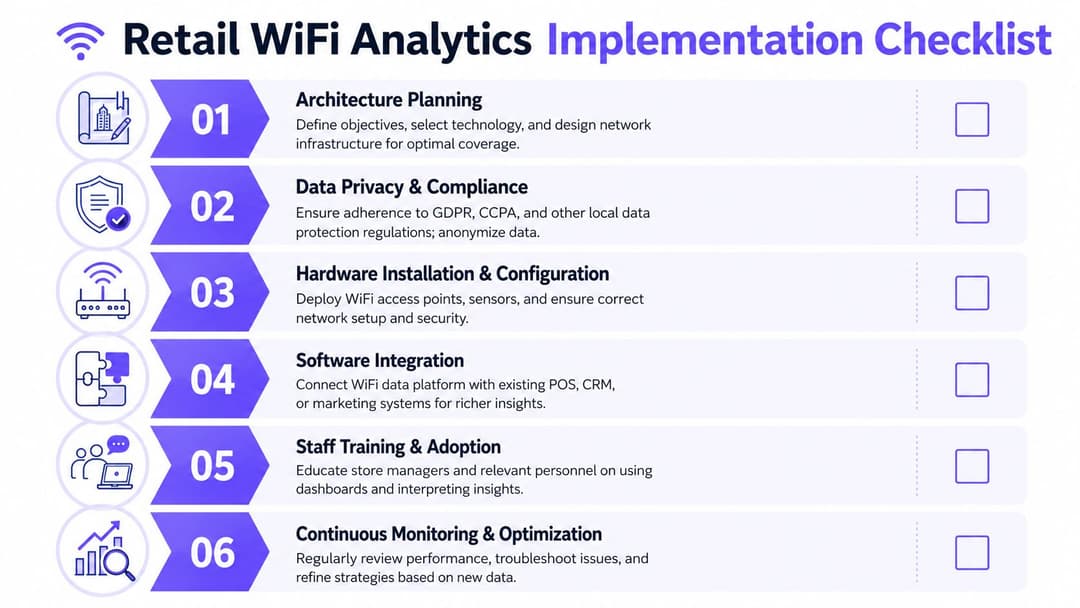
Most retail WiFi analytics projects fail long before launch. Not because the technology can't work, but because the business never agreed what success looks like, who owns the data, or how privacy will be handled. The cleanest deployments start with a checklist that both marketing and IT can sign off.
Start with architecture, not dashboards
The first decision is whether your current wireless estate can support the program you want. Many retailers already run infrastructure from vendors such as Meraki, Aruba, Ruckus, Mist, or UniFi. The practical question isn't whether WiFi exists in the building. It's whether coverage, access point placement, and configuration are good enough to support reliable zone-level measurement.
Use these questions early:
- Coverage quality. Are entrances, high-value zones, and service areas mapped well enough to distinguish passing traffic from actual engagement?
- Venue design. Does the site include thick walls, open mall frontage, multiple floors, or shared spaces that complicate detection logic?
- Project objective. Are you trying to understand broad foot traffic, richer guest WiFi behavior, or both?
A pilot should be operational, not theatrical. Choose a location with enough complexity to test reality, but not so much complexity that every issue becomes a special case.
Plan integrations before data starts flowing
Analytics only becomes actionable when it connects to the rest of the retail stack. That may include CRM, email platforms, customer data platforms, survey tools, or internal reporting systems. If marketing wants segmented follow-up and IT wants clean governance, the integration model needs to be explicit from the start.
A useful review table looks like this:
| Area | What to define |
|---|---|
| CRM | Which fields are captured, matched, and retained |
| Marketing automation | Which events trigger follow-up journeys |
| Reporting | Which team owns KPI definitions and dashboard access |
| Security | Which identities, permissions, and environments are separated |
Vendor question: Ask whether the analytics output is easy to reconcile with existing store reporting, not just whether the dashboard looks polished.
Privacy is a design decision, not a disclaimer
In the US, WiFi-based tracking can be personal data under the TCPA and CAN-SPAM and CCPA/CPRA, even where MAC randomization is in play. The FTC and state attorneys general have made clear that device tracking in public spaces is regulated, so retailers need a lawful basis and transparent notices. This is not just a technical deployment issue. It determines whether the data is usable at all (US guidance on WiFi tracking and compliance).
That means your compliance checklist should include:
- Lawful basis review. Legal, marketing, and IT need a shared view of why processing is happening and where consent or other lawful grounds apply.
- Transparent visitor notice. Captive portals, signage, and privacy wording need to explain tracking clearly enough for real people, not just auditors.
- Data minimization. Collect what supports the business purpose. Don't gather extra fields because the form allows it.
- Retention and access controls. Decide who can see raw versus aggregated data, and for how long.
- Vendor due diligence. Review processor terms, hosting model, and data handling practices in detail.
For teams comparing approaches, it helps to review a vendor's guest WiFi data privacy guidance alongside internal legal review. The right question isn't “Can the platform track devices?” It's “Can we deploy this in a way that is useful, proportionate, and defensible?”
Measuring Success and Proving ROI
If you want budget for retail WiFi analytics beyond the pilot stage, do not lead with technical elegance. Lead with decisions improved and costs avoided. Stakeholders rarely fund dashboards for their own sake.
A solid ROI case usually combines three lenses.
Revenue influence
Start with controllable store changes. If a layout revision increases engagement in a category zone and that same category then performs better at the register, you have a stronger commercial story than “the heatmap looked better”. The point isn't to claim perfect attribution. It's to show that physical behavior and sales moved in the same direction after a defined intervention.
Marketing effectiveness
When guest WiFi is part of the customer journey, marketing can compare campaign periods against changes in visit behavior, return behavior, and on-site engagement. This is especially useful in a post-cookie environment where physical venues need their own first-party measurement model. The most credible reporting links a message or offer to a behavior change in-store, not just an email send or portal view.
Operational efficiency
Some of the fastest wins are operational. Better visibility into traffic patterns can improve staffing schedules, service coverage, cleaning cycles, queue management, and promotional timing. Those gains may not look glamorous in a board pack, but they often make the program easier to defend because they affect daily running costs.
A simple ROI discipline helps:
- Pick one store problem first. Line pressure, dead zones, poor repeat visits, weak campaign read-through.
- Define the behavior you expect to change. More time in a zone, better return patterns, steadier traffic by daypart.
- Tie that behavior to one business outcome. Sales quality, labor efficiency, service speed, or tenant reporting quality.
- Review before and after the intervention. Avoid changing multiple variables at once.
The strongest business case for retail WiFi analytics is rarely “more data”. It's “fewer blind spots in decisions we already make every week”.
Frequently Asked Questions
Does MAC address randomization make retail WiFi analytics useless
No, but it changes how you should think about the data. Presence analytics becomes less about perfect identity and more about directional insight into traffic, dwell, and movement. Connected guest WiFi sessions remain more useful for richer first-party analysis because the customer has actively associated with the network.
What's the difference between presence analytics and location analytics
Presence analytics is about detecting that a device is near or within the venue and using that signal to estimate traffic patterns. Location analytics goes further by mapping where devices move within defined zones. In practice, retailers often need both. Presence helps with broad counting. Location helps with layout and zone performance decisions.
Is WiFi footfall data better than traditional counters
It answers a different question. Beam counters can be useful for counting entries at a doorway. WiFi analytics can add context such as dwell, repeat behavior, and movement through the space. If your only goal is counting door crossings, a dedicated counter may be enough. If you want to understand behavior inside the store, WiFi analytics is more informative.
Who should own the program inside the business
Shared ownership works best. IT should own network integrity, security, vendor review, and privacy implementation. Marketing or customer insight teams should own campaign use cases, audience logic, and reporting requirements. Store operations should validate whether the output reflects reality on the floor. If one department owns it in isolation, the program usually drifts toward either technical abstraction or shallow marketing reporting.
If you're evaluating how to connect guest access, first-party data capture, and in-store behavioral insight in one platform, Purple is worth reviewing. It's built for venues that need secure WiFi access alongside analytics that marketing, IT, and operations can effectively use.