Indoor WiFi-Positionierung: Wie Standortverfolgung in einem Gastnetzwerk funktioniert
Dieser maßgebliche technische Leitfaden erklärt, wie Indoor WiFi-Positionierung in einem Gastnetzwerk funktioniert, einschließlich RSSI-Triangulation, Access Point-Kartierung, Heatmap-Generierung und Integration mit Analyseplattformen. Er richtet sich an IT-Manager, Netzwerkarchitekten und CTOs in Hotels, Einzelhandelsketten, Stadien und öffentlichen Einrichtungen, die in diesem Quartal eine Bereitstellungsentscheidung treffen müssen. Am Ende werden die Leser den vollständigen Datenfluss von der Probe-Anfrage bis zur umsetzbaren Business Intelligence verstehen, einschließlich der kritischen Compliance- und Datenschutzaspekte, die jede reale Bereitstellung regeln.
Diesen Leitfaden anhören
Podcast-Transkript ansehen
Executive Summary
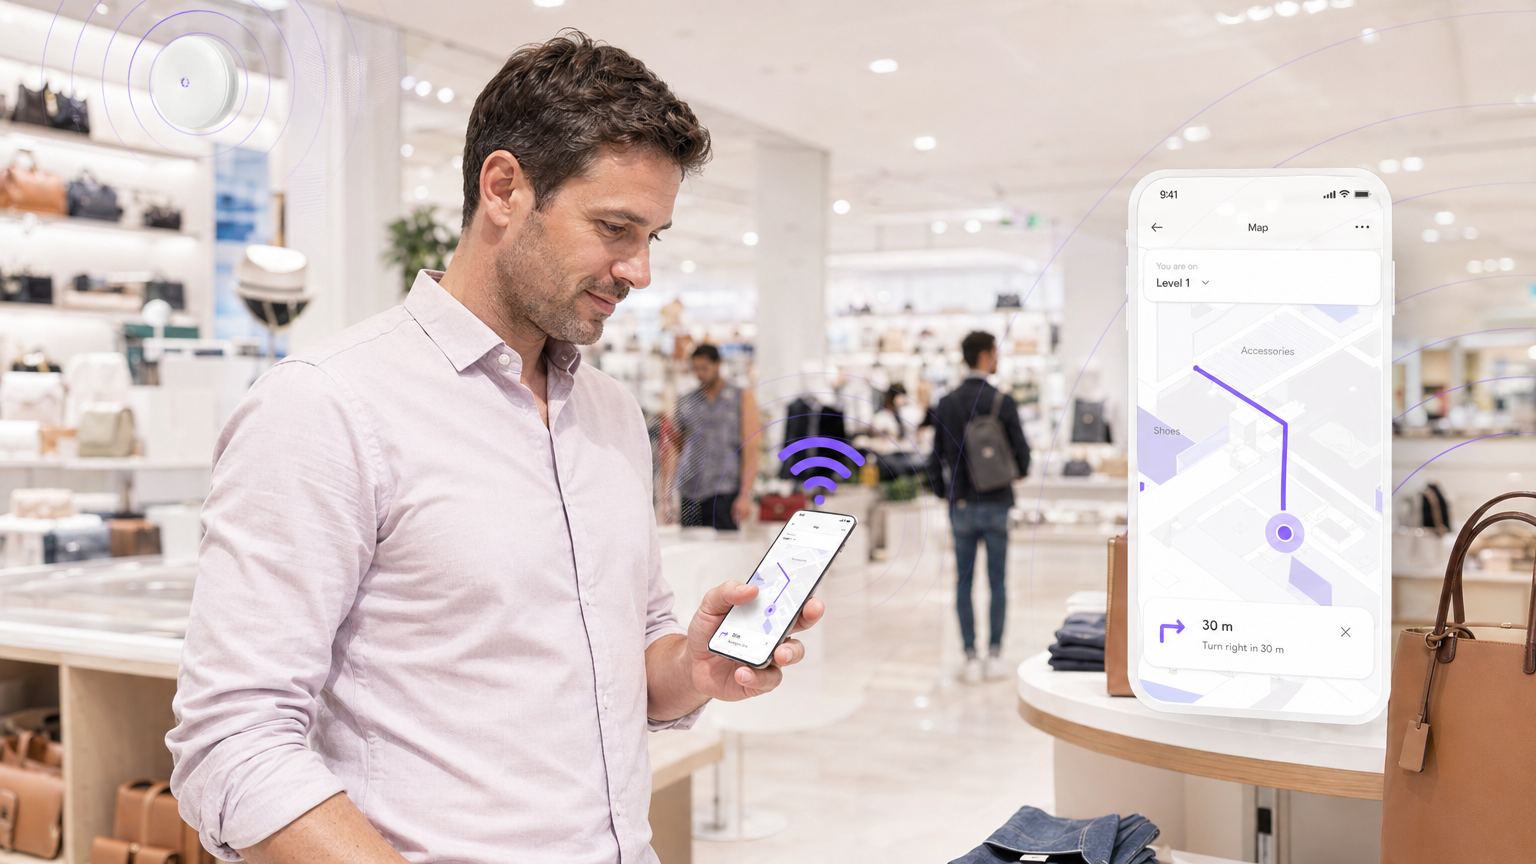
Für moderne Veranstaltungsorte – sei es ein Flagship-Store im Einzelhandel, ein Hotel oder ein großes Stadion – ist das Verständnis des physischen Besucherflusses strategisch ebenso wichtig wie die Verfolgung des digitalen Web-Traffics. GPS versagt in Innenräumen und hinterlässt eine erhebliche Sichtbarkeitslücke, die Betreibern echte Einnahmen kostet. Dieser Leitfaden erklärt, wie IT-Teams von Unternehmen ihre bestehende Guest WiFi -Infrastruktur nutzen können, um ein WiFi-basiertes Indoor-Positionierungssystem (IPS) zu implementieren. Die Technologie ist nicht neu, aber die Integration von RSSI-Triangulation, kalibrierter Access Point (AP)-Kartierung und cloudbasierten WiFi Analytics -Plattformen ist so weit ausgereift, dass die Implementierung heute ein praktisches, innerhalb eines Quartals lieferbares Projekt ist und keine mehrjährige Forschungsinitiative. Dieses Dokument bietet die technische Architektur, Implementierungsschritte, häufige Fehlerquellen und den ROI-Rahmen, der für eine fundierte Entscheidung erforderlich ist. Eine breitere Einführung in die Analyseebene finden Sie in unserem Leitfaden zu Was ist WiFi Analytics? Ein vollständiger Leitfaden .
Technischer Deep-Dive
Die Physik der Indoor WiFi-Ortung
Die grundlegende Herausforderung der Indoor-Positionierung besteht darin, dass GPS-Signale – die bei etwa 1575 MHz arbeiten – beim Durchgang durch Baumaterialien stark gedämpft werden. Eine Betondecke kann die Signalstärke um 20–30 dB reduzieren, wodurch GPS für alles unterhalb weniger Stockwerke eines Gebäudes unzuverlässig wird. WiFi-basierte Indoor-Positionierung umgeht dies, indem sie die 2,4 GHz- und 5 GHz-Signale nutzt, die bereits in jeder Unternehmensnetzwerkbereitstellung vorhanden sind.
Der Kernmechanismus ist der Received Signal Strength Indicator (RSSI). Wenn ein mobiles Gerät WiFi aktiviert hat, sendet es periodisch 802.11 Probe Request Frames, um verfügbare Netzwerke zu entdecken. Jeder Access Point in Reichweite empfängt diese Frames und zeichnet die MAC address des sendenden Geräts zusammen mit dem RSSI-Wert auf – ein logarithmischer Messwert der Signalleistung, typischerweise in dBm ausgedrückt, wobei -30 dBm ein sehr starkes Signal und -90 dBm ein sehr schwaches Signal darstellt.
RSSI-Triangulation (Trilateration)
Ein einzelner AP kann bestätigen, dass sich ein Gerät in seinem Abdeckungsbereich befindet, aber weder Richtung noch genaue Entfernung bestimmen. Um ein Gerät zu lokalisieren, benötigt das System gleichzeitig Messwerte von mindestens drei APs – ein Prozess, der korrekterweise als Trilateration bezeichnet wird (obwohl „Triangulation“ der in der Branche übliche Begriff ist).
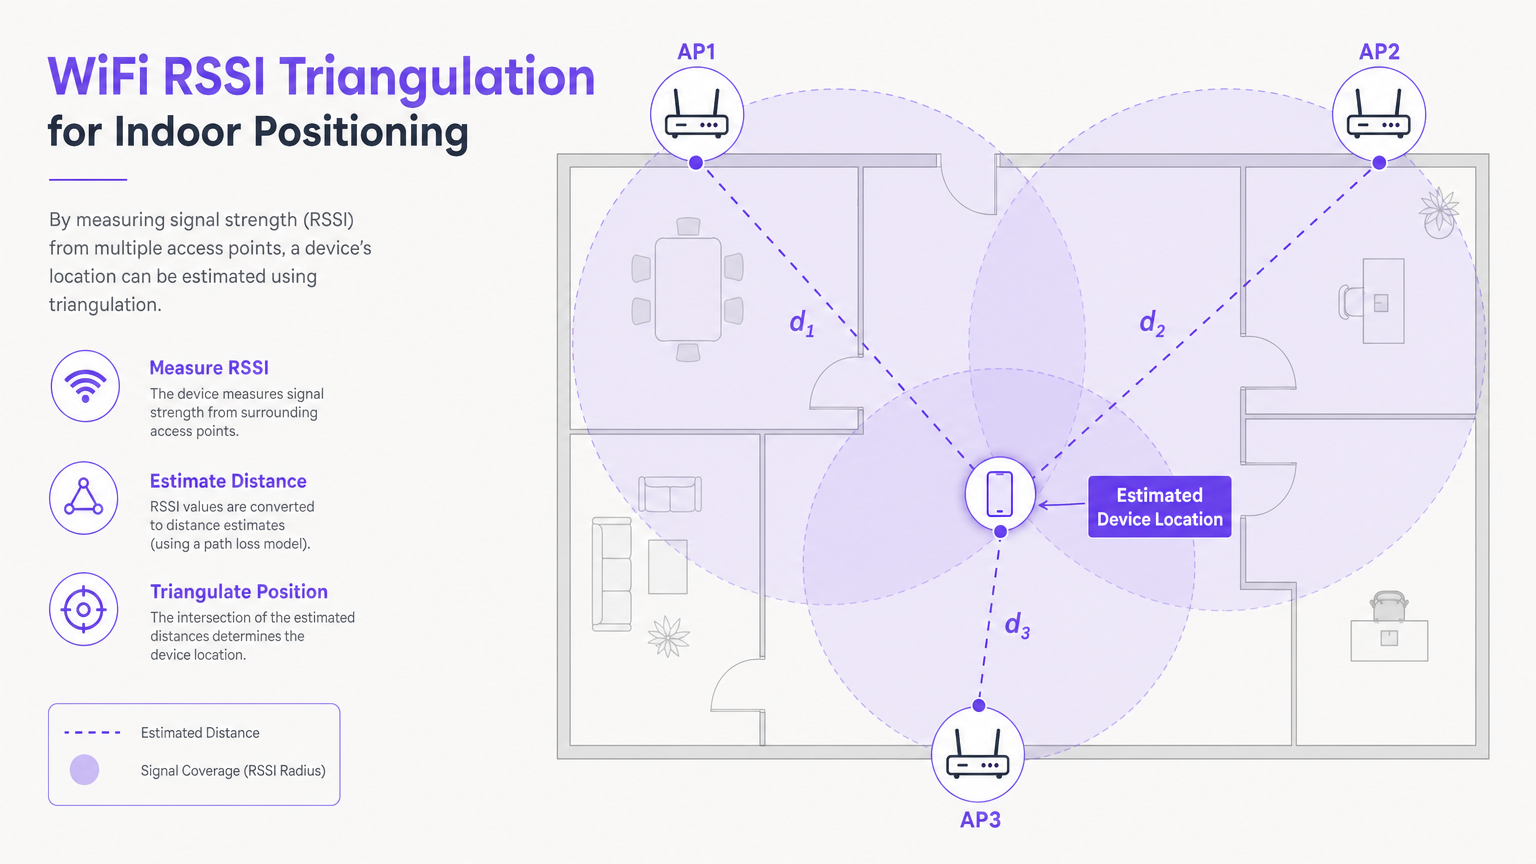
Die Analyseplattform wendet ein Pfadverlustmodell an – typischerweise das Log-Distanz-Pfadverlustmodell –, um jeden RSSI-Wert in eine geschätzte Entfernung von diesem AP umzuwandeln. Mit drei Entfernungsschätzungen und den bekannten physikalischen Koordinaten jedes APs löst das System den Schnittpunkt, der den geschätzten Standort des Geräts darstellt. In der Praxis ist dieser Schnittpunkt aufgrund von Umgebungsstörungen selten ein perfekter Punkt; das System berechnet stattdessen eine Wahrscheinlichkeitsregion und meldet den Schwerpunkt.
Wichtige Formelreferenz: Das Log-Distanz-Pfadverlustmodell wird ausgedrückt als:
PL(d) = PL(d₀) + 10n·log₁₀(d/d₀) + Xσ
Dabei ist n der Pfadverlustexponent (typischerweise 2–4 für Innenräume), d die Entfernung und Xσ eine Gaußsche Zufallsvariable mit Mittelwert Null, die Abschattungseffekte darstellt.
Passive Verfolgung vs. Authentifizierte Analysen
Es ist wichtig, zwischen zwei Betriebsmodi zu unterscheiden, da sie grundlegend unterschiedliche Datenqualität und Compliance-Implikationen haben:
| Modus | Auslöser | Datenqualität | Compliance-Überlegung |
|---|---|---|---|
| Passive Anwesenheitserkennung | Gerät hat WiFi aktiviert; nicht verbunden | Aggregierte Besucherzahlen, Zonen-Dichte | MAC randomisation begrenzt individuelle Verfolgung |
| Authentifizierte Analysen | Benutzer verbindet sich über captive portal | Umfangreiches Erstanbieterprofil, Verweildauer, wiederkehrender Besucher | Erfordert explizite GDPR-Zustimmung beim Login |
MAC randomisation ist hier die entscheidende Variable. Seit iOS 14 und Android 10 randomisieren mobile Betriebssysteme die MAC address, die in Probe Requests verwendet wird. Dies bedeutet, dass ein Gerät bei jedem Besuch als eine andere Entität erscheint, was die passive Verfolgung einzelner wiederkehrender Personen verhindert. Die praktische Implikation ist, dass passive Daten für aggregierte Heatmaps und Besucherzahlen nützlich sind, aber authentifizierte Daten – erfasst, wenn ein Benutzer sich über ein captive portal im Gastnetzwerk anmeldet – für jede individuelle Analyse erforderlich sind.
Eine umfassendere Untersuchung komplementärer Positionierungstechnologien, einschließlich UWB und BLE, finden Sie in unserem Leitfaden zu Indoor Positioning System: UWB, BLE, & WiFi Guide .
Implementierungsleitfaden
Phase 1: Umgebungsbewertung und RF-Planung
Bevor ein einziger AP installiert wird, ist eine gründliche RF-Planung zwingend erforderlich. Die physische Umgebung bestimmt die Signalausbreitung, und Annahmen, die in der Planungsphase getroffen werden und sich im Feld als falsch erweisen, führen zu ungenauen Standortdaten, die nach der Bereitstellung schwer zu diagnostizieren sind.
AP-Dichteanforderung: Für eine genaue Trilateration muss ein Gerät an jedem Punkt im Abdeckungsbereich von mindestens drei APs mit einer Signalstärke von -65 dBm oder besser gehört werden. Dies ist eine strengere Anforderung als die grundlegende Internetzugangsabdeckung, die bei -75 dBm funktionieren kann. In der Praxis bedeutet dies, APs in offenen Umgebungen in Abständen von etwa 15–20 Metern und in Bereichen mit hoher Hindernisdichte (Metallregale, Betonsäulen, Glastrennwände) deutlich näher zu platzieren.
Standortbegehung: Führen Sie vor der physischen Installation eine prädiktive Standortbegehung mit RF-Planungssoftware (z. B. Ekahau, iBwave) durch. Schließen Sie dies mit einer aktiven Standortbegehung ab nach der Installation, um die Abdeckung zu validieren und Funklöcher zu identifizieren.
Phase 2: AP-Kartierung und Plattformkonfiguration
Sobald die APs physisch installiert sind, muss die Analyseplattform mit ihren präzisen Koordinaten konfiguriert werden.
- Laden Sie einen maßstabsgetreuen Grundriss (im PDF-, DWG- oder PNG-Format) in das Dashboard der Analyseplattform hoch.
- Ordnen Sie die exakten physischen Koordinaten jedes APs dem digitalen Grundriss zu. Dieser Schritt ist unerlässlich – jeder Fehler hier führt direkt zu Ungenauigkeiten bei der Standortbestimmung.
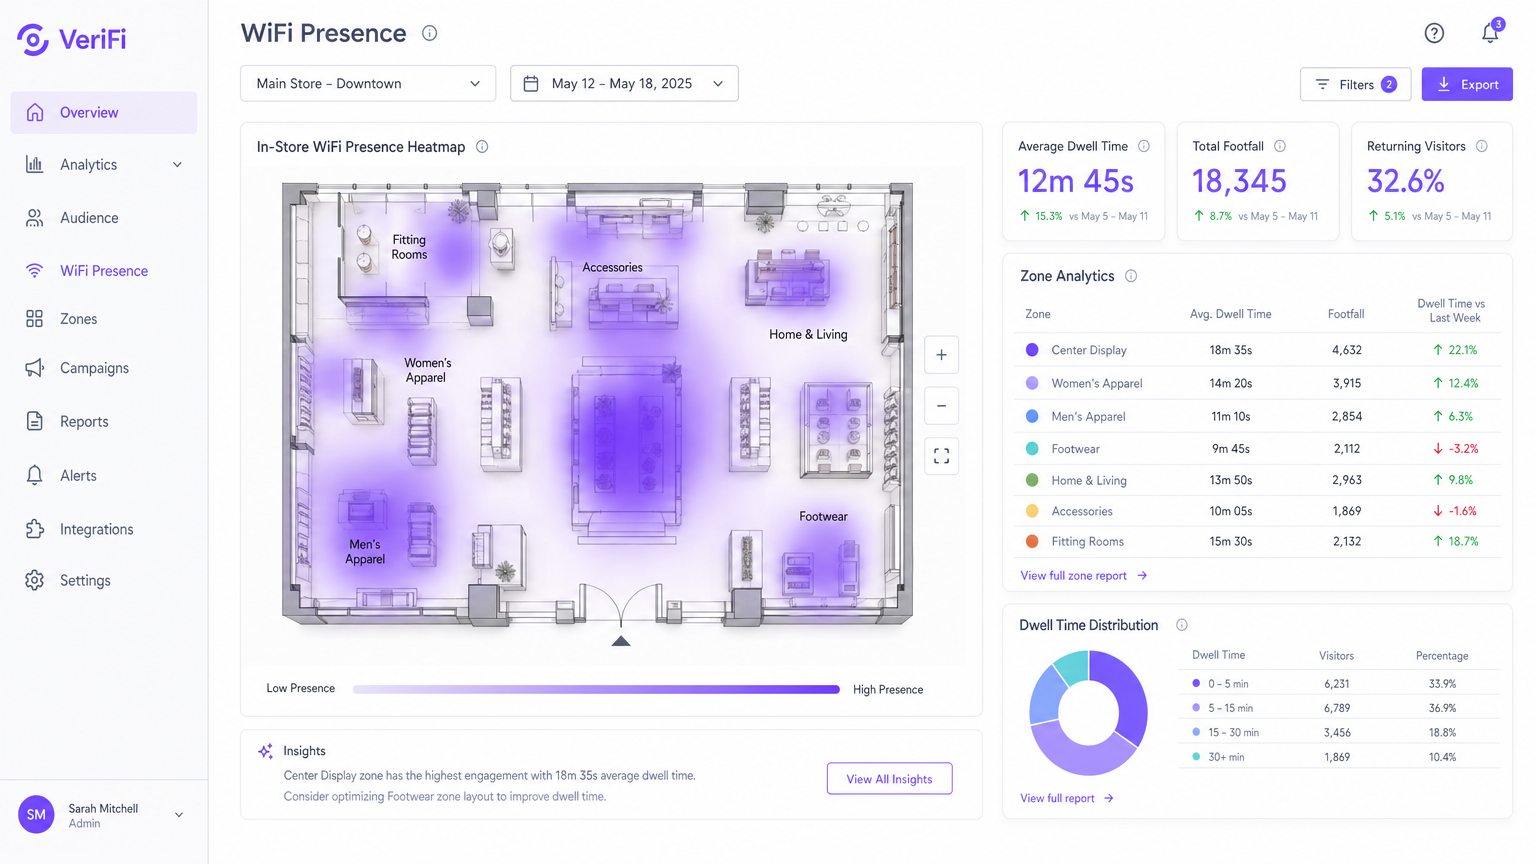
- Definieren Sie Zonen – benannte polygonale Bereiche auf dem Grundriss (z. B. "Kasse", "Herrenmode", "Lobby") –, um eine detaillierte Berichterstattung über Verweildauer und Besucherfrequenz pro Bereich zu ermöglichen.
- Konfigurieren Sie den Wireless LAN Controller (WLC) so, dass er Präsenzdaten über die entsprechende API- oder Syslog-Integration an die Analyseplattform weiterleitet.
Phase 3: Captive Portal und Zustimmungs-Framework
Um authentifizierte Daten zu erfassen und die Einhaltung der GDPR und ähnlicher Frameworks zu gewährleisten, implementieren Sie ein Captive Portal, das den Benutzern eine klare Einverständniserklärung vor dem Gewähren des Netzwerkzugangs präsentiert. Das Portal sollte mindestens erfassen: Name, E-Mail-Adresse und die ausdrückliche Zustimmung zur Datenverarbeitung für Analysezwecke.
Best Practices
Standardisierung auf 5 GHz für Analysen: Während 2,4 GHz Wände effektiver durchdringt, ist es stark überlastet und anfällig für Interferenzen durch Bluetooth, Mikrowellen und benachbarte Netzwerke. Die Lenkung von Clients auf 5 GHz führt zu saubereren, konsistenteren RSSI-Messwerten und verbessert die Standortgenauigkeit. Konfigurieren Sie Band Steering auf dem WLC, um 5 GHz für fähige Clients zu bevorzugen.
Regelmäßige Kalibrierungsüberprüfungen planen: Physische Umgebungen sind nicht statisch. Eine saisonale Änderung des Ladenlayouts, eine neue Trennwand oder sogar eine große temporäre Installation (wie ein Messestand) kann die HF-Ausbreitung erheblich verändern. Planen Sie vierteljährlich eine Kalibrierungsüberprüfung oder sofort nach jeder signifikanten physischen Änderung des Veranstaltungsortes.
Datenminimierung implementieren: Gemäß Artikel 5(1)(c) der GDPR sollten nur die für den angegebenen Zweck unbedingt erforderlichen Daten erhoben werden. Für Analysen auf Zonenebene bedeutet dies, aggregierte Zählungen anstelle individueller Gerätepfade zu speichern. Konsultieren Sie Ihren Datenschutzbeauftragten, bevor Sie den Umfang der Datenerfassung erweitern.
Die IoT-Architektur nutzen: WiFi-Positionierung wird zunehmend in umfassendere IoT-Implementierungen integriert. Für den Kontext, wie Indoor-Positionierung in eine breitere Architektur vernetzter Veranstaltungsorte passt, siehe unseren Leitfaden zu Internet of Things Architecture: A Complete Guide .
Fehlerbehebung & Risikominderung
| Fehlermodus | Symptom | Grundursache | Abhilfe |
|---|---|---|---|
| Unzureichende AP-Dichte | Geräte "springen" auf der Heatmap zwischen weit entfernten Zonen | Weniger als 3 APs empfangen das Gerät bei -65 dBm | Aktive Standortbegehung; APs in Funklöchern hinzufügen |
| Ungenaues AP-Mapping | Heatmap zeigt hohe Verweildauer an physisch unmöglichen Orten | AP-Koordinaten in der Plattform falsch eingegeben | Jede AP-Koordinate mit physischen Installationsaufzeichnungen abgleichen |
| MAC-Randomisierung | Nahezu null wiederkehrende Besucher trotz bekannter wiederholter Besucherfrequenz | Nur passives Tracking; keine authentifizierten Sitzungen | Captive Portal mit incentiviertem Login implementieren |
| Mehrwege-Interferenz | Unregelmäßige Standortschätzungen in bestimmten Zonen | Signalreflexionen von Metallregalen oder Glas | APs neu positionieren; Richtantennen verwenden; Kalman-Filterung in der Analyseplattform anwenden |
| Kanalüberlastung | Inkonsistente RSSI-Messwerte auf 2,4 GHz | Gleichkanalinterferenz von benachbarten Netzwerken | Analyse-Clients auf 5 GHz migrieren; automatische Kanalzuweisung auf dem WLC implementieren |
ROI & Geschäftlicher Nutzen
Der Business Case für die Indoor-WiFi-Positionierung ist am stärksten, wenn er als Infrastrukturinvestition betrachtet wird, die gleichzeitig Erträge in mehreren Abteilungen liefert.
Einzelhandel: Ein mittelgroßer Modehändler mit 20 Filialen kann Zonen-basierte Verweildauerdaten nutzen, um zu identifizieren, welche Produktpräsentationen die größte Aufmerksamkeit erzeugen. Die Neuanordnung leistungsschwacher Einrichtungsgegenstände auf Basis dieser Daten hat in vergleichbaren Implementierungen zu einer Verbesserung der Verkaufs-Conversion-Raten um 8–15 % geführt. Für branchenspezifische Anleitungen siehe unsere Retail -Lösungen.
Gastgewerbe: Ein Hotel mit 300 Zimmern kann Warteschlangen an der Rezeption und in F&B-Outlets in Echtzeit überwachen und Personal dynamisch einsetzen, um Serviceverschlechterungen während Spitzenzeiten zu verhindern. Die Verfolgung der Gästebewegungen durch die Unterkunft ermöglicht auch die Optimierung des Housekeepings, wodurch die Zimmerwechselzeit reduziert wird. Siehe unsere Hospitality -Fallstudien für Implementierungsbeispiele.
Gesundheitswesen: NHS-Trusts und private Krankenhäuser nutzen WiFi-basiertes Asset-Tracking (über WiFi-fähige Tags an medizinischen Geräten), um die durchschnittliche Suchzeit für mobile Assets von 20 Minuten auf unter 2 Minuten pro Vorfall zu reduzieren. Dies reduziert direkt die Zeit des klinischen Personals, die für nicht-klinische Aufgaben verschwendet wird. Entdecken Sie unsere Healthcare -Lösungen.
Transport: Flughäfen und Bahnbetreiber nutzen Präsenzanalyse, um den Passagierfluss durch Sicherheits- und Boarding-Gates zu steuern, Staus zu reduzieren und die Pünktlichkeit der Abflüge zu verbessern. Siehe unsere Transport -Branchenseite für relevante Fallstudien.
ROI messen: Erstellen Sie vor der Implementierung eine Basismessung der Schlüsselmetrik (Verweildauer, Warteschlangenlänge, Asset-Suchzeit). Messen Sie nach 30, 60 und 90 Tagen nach der Implementierung erneut. Ein gut implementiertes Indoor-Positionierungssystem erreicht typischerweise eine Amortisationinnerhalb von 12–18 Monaten wieder amortisiert, wenn die vollständigen betrieblichen Effizienzgewinne berücksichtigt werden.
Für ein umfassendes Verständnis der Analysefunktionen, die auf dieser Positionierungsinfrastruktur aufbauen, lesen Sie unseren Leitfaden: Was ist WiFi Analytics? Ein vollständiger Leitfaden .
Schlüsseldefinitionen
RSSI (Received Signal Strength Indicator)
A measurement of the power level of a received radio signal, expressed in dBm (decibels relative to one milliwatt). Values typically range from -30 dBm (excellent) to -90 dBm (very weak).
IT teams use RSSI values reported by multiple APs to estimate a device's distance from each AP and calculate its location via trilateration. The -65 dBm threshold is the industry-standard minimum for reliable positioning.
Trilateration
A geometric method of determining the location of a point by measuring its distance from three or more known reference points, using the intersection of circles (in 2D) or spheres (in 3D).
This is the mathematical foundation of WiFi indoor positioning. It is distinct from triangulation, which uses angles rather than distances, though the terms are often used interchangeably in vendor documentation.
Probe Request
An 802.11 management frame broadcast by a WiFi-enabled device to discover available networks in its vicinity.
Probe requests are the fundamental data source for passive presence detection. They are transmitted even when the device is not connected to any network, as long as WiFi is enabled.
MAC Randomisation
A privacy feature in modern mobile operating systems (iOS 14+, Android 10+) that substitutes a randomly generated MAC address in probe request frames, preventing persistent tracking across sessions.
This is the primary technical barrier to passive individual tracking. IT teams must implement captive portal authentication to obtain a persistent identifier for returning visitor analytics.
Captive Portal
A web page presented to a user before network access is granted, typically requiring authentication or acceptance of terms and conditions.
The captive portal is the critical junction between anonymous presence detection and authenticated first-party analytics. It is also the primary mechanism for GDPR consent capture in guest WiFi deployments.
Dwell Time
The duration a detected device remains within a defined zone or the overall venue, measured from first detection to last detection within a session.
A primary KPI for retail and hospitality operators. High dwell time in a product zone correlates with purchase intent; low dwell time at a service desk may indicate poor service experience.
Multipath Interference
A propagation phenomenon where a radio signal reaches the receiving antenna via two or more paths due to reflections, diffractions, or scattering from obstacles.
Particularly prevalent in environments with metal racking, glass facades, or concrete columns. It causes RSSI readings to fluctuate independently of actual device distance, degrading location accuracy.
Path Loss Exponent
A parameter in the log-distance path loss model that describes how rapidly signal strength attenuates with distance in a given environment. Free space = 2; typical indoor = 3–4; obstructed indoor = 4–6.
Analytics platforms use a calibrated path loss exponent to convert RSSI values into distance estimates. An incorrectly calibrated exponent is a common source of systematic location error.
Zone Analytics
The aggregation of presence and dwell time data within a user-defined polygonal area on the venue floor plan.
Zones are the primary unit of business reporting in WiFi analytics platforms. They translate raw location coordinates into meaningful business areas (e.g., 'Checkout', 'Cafe', 'Exhibition Hall A').
Ausgearbeitete Beispiele
A 12-store fashion retail chain wants to understand how a new store layout affects customer dwell time in the 'Home & Living' section. They have a basic guest WiFi network but no analytics. The IT manager has a 90-day project window and a modest budget.
Step 1: Conduct an active site survey of the flagship store to identify AP coverage gaps. Upgrade AP density in the 'Home & Living' zone to guarantee 3-AP overlap at -65 dBm or better. Step 2: Integrate the wireless LAN controller with the WiFi Analytics platform via the management API. Step 3: Upload the store floor plan and precisely map all AP coordinates. Draw a 'Home & Living' zone polygon in the analytics dashboard. Step 4: Deploy a captive portal offering a 10% discount code in exchange for email registration and GDPR consent. This converts passive MAC-randomised data into authenticated dwell time metrics. Step 5: Run a 30-day baseline measurement before the layout change, then a 30-day post-change measurement. Compare average dwell time and footfall density in the zone between the two periods.
A conference centre hosting 5,000-delegate events is experiencing complaints about 20-minute queues at the main registration desk during the 08:30–09:30 peak window. The operations director wants a data-driven solution that can trigger real-time staff redeployment.
Step 1: Verify AP density around the registration desk is sufficient for accurate presence detection (minimum 3 APs at -65 dBm). Step 2: Define a 'Registration Desk' zone and a 'Registration Queue' zone (the area leading up to the desk) in the analytics platform. Step 3: Configure an automated alert: if the device count in the 'Registration Queue' zone exceeds 40 for more than 3 consecutive minutes, trigger an SMS and push notification to the floor manager's mobile device. Step 4: Establish a secondary alert threshold at 70 devices, triggering escalation to the venue operations director. Step 5: Review the alert logs weekly to refine the threshold values based on actual observed queue-to-complaint correlation.
Übungsfragen
Q1. You are the network architect for a large department store. The initial heatmaps show devices frequently appearing in the wrong departments — a customer standing in Menswear is being placed in Womenswear on the map. What is the most likely cause and what is your diagnostic and remediation process?
Hinweis: Consider both the physical environment and the configuration of the analytics platform.
Musterlösung anzeigen
There are two likely causes: (1) Incorrect AP coordinate mapping — the physical location of one or more APs has been entered incorrectly in the analytics platform, causing a systematic offset in all location estimates derived from those APs. Remediation: physically verify the location of every AP against its recorded coordinates in the platform and correct any discrepancies. (2) Insufficient AP density — if fewer than three APs are hearing the device at -65 dBm, the trilateration is working with incomplete data, producing inaccurate estimates. Remediation: conduct an active site survey to identify coverage gaps and add APs as required. Start with cause (1) as it is faster and cheaper to diagnose.
Q2. Your marketing team reports that the 'returning visitor' metric in the WiFi analytics dashboard has been at 0% for three months, despite strong anecdotal evidence from store managers that many customers visit multiple times per week. What is the technical explanation and what is the solution?
Hinweis: Consider the privacy features of modern mobile operating systems.
Musterlösung anzeigen
The platform is relying solely on passive probe request tracking. Because modern iOS and Android devices randomise their MAC addresses with each probe session, every visit appears as a new, unique device. The system has no mechanism to link visits from the same physical device across sessions. The solution is to implement a captive portal that requires user authentication (email login, social login, or similar). Once a user authenticates, their session is tied to a persistent identifier (email address or user ID), enabling the platform to correctly identify and count returning visitors. Incentivising login — for example, with a loyalty discount — is recommended to maximise the authenticated session rate.
Q3. A new AP was installed to cover a previously dead zone in the venue's basement car park. The AP is confirmed online, serving clients, and appearing in the WLC dashboard. However, the analytics platform shows no presence data for the car park area. What step was missed and how do you resolve it?
Hinweis: The network layer and the analytics layer have separate configuration requirements.
Musterlösung anzeigen
The AP mapping step was omitted from the analytics platform configuration. While the AP is fully functional at the network layer, its physical coordinates have not been registered in the analytics platform's floor plan. The platform is receiving the presence data from the AP but cannot place it on the map, so it is either being discarded or aggregated into an 'unmapped' category. Resolution: log into the analytics platform, navigate to the floor plan configuration, and add the new AP with its precise physical coordinates. If the car park is on a separate floor level, ensure the correct floor plan level is selected before placing the AP marker.
Q4. The legal team has raised a concern that the indoor positioning system may be processing personal data without adequate legal basis under GDPR. As the IT lead, how do you assess and address this risk?
Hinweis: Consider both passive and authenticated tracking modes separately.
Musterlösung anzeigen
Assess the two tracking modes separately. For passive tracking (probe requests): MAC-randomised probe data is generally not considered personal data under GDPR when it cannot be linked to an identified individual. However, if the system retains raw MAC addresses for any period, this should be reviewed with your DPO, as a non-randomised MAC could be personal data. Implement data minimisation by aggregating to zone-level counts as quickly as possible and purging raw MAC logs. For authenticated tracking: this clearly involves personal data (email address, device association). The legal basis is typically consent, captured via the captive portal. Ensure the consent notice is specific, granular, and clearly describes the analytics use case. Implement a data retention policy and a subject access request process. Document both modes in your Records of Processing Activities (ROPA) under GDPR Article 30.
Weiterlesen in dieser Reihe
Privacy by Design: Anonymisierung von WiFi-Daten für die GDPR-Konformität
Dieser maßgebliche Leitfaden beschreibt die technische Architektur und Implementierungsstrategien zur Anonymisierung von WiFi-Daten, um die GDPR-Konformität sicherzustellen. Er bietet IT-Führungskräften und Netzwerkarchitekten umsetzbare Frameworks, um robuste Standortanalysen mit strengen Datenschutzanforderungen in Einklang zu bringen.
Heatmapping vs. Presence Analytics: Technische Unterschiede
Dieser maßgebliche technische Leitfaden beschreibt die entscheidenden architektonischen und operativen Unterschiede zwischen WiFi Heatmapping und Presence Analytics für Betreiber von Unternehmensstandorten. Er bietet IT-Führungskräften, Netzwerkarchitekten und Betriebsleitern umsetzbare Bereitstellungs-Frameworks, reale Implementierungsszenarien und herstellerneutrale Best Practices, um den maximalen ROI aus ihrer bestehenden drahtlosen Infrastruktur zu erzielen.
Wie man die Verweildauer mit WiFi Location Analytics berechnet
Dieser Leitfaden bietet eine umfassende technische Referenz zur Berechnung der WiFi-Verweildauer mittels WiFi Location Analytics. Er deckt die gesamte Architektur ab, von der Erfassung von 802.11 Probe Requests über die RSSI-basierte Trilateration bis zur Analyse von Geofence-Zonen. Er richtet sich an IT-Manager, Netzwerkarchitekten und Betriebsleiter von Veranstaltungsorten, die präzise, skalierbare Standortinformationen in Einzelhandel, Gastgewerbe, Gesundheitswesen und im öffentlichen Sektor implementieren müssen. Die Leser erhalten umsetzbare Implementierungsanleitungen, Fallstudien aus der Praxis und einen klaren Rahmen für die Umwandlung von Rohdaten in messbare Geschäftsergebnisse.