How to Build a Customer Survey Using Your WiFi Platform
This guide provides IT leaders, network architects, and venue operations directors with actionable steps to deploy post-visit customer surveys through enterprise WiFi networks. It covers the full technical architecture — from captive portal authentication and dwell time thresholds to survey metric selection (NPS vs CSAT) and API-driven CRM integration. Deploying surveys through a WiFi platform transforms existing network infrastructure into a real-time customer intelligence engine, delivering response rates three to five times higher than traditional post-visit email campaigns.
🎧 Listen to this Guide
View Transcript
Executive Summary
For enterprise venues — from Retail environments to Hospitality properties — the guest WiFi network is one of the most underutilised data assets in the technology stack. While traditional feedback mechanisms rely on manual data entry or batch-and-blast email campaigns, integrating customer satisfaction surveys directly into the WiFi experience enables high-conversion, contextual feedback at scale. This guide details how to architect a WiFi-triggered survey system using Purple's Guest WiFi and WiFi Analytics solutions. We cover the deployment mechanics, timing algorithms for post-visit triggers, the technical differences between NPS and CSAT implementations, and the API integrations required to pipe response data into your CRM or analytics platform. The result is a feedback loop that is automated, compliant, and directly tied to the physical guest journey.
Technical Deep-Dive
Building a robust survey system over a public or enterprise WiFi network requires more than a captive portal. It demands a sophisticated architecture that respects user privacy, adheres to GDPR and CCPA consent frameworks, and ensures high throughput without degrading the primary network experience.
Architecture and Data Flow
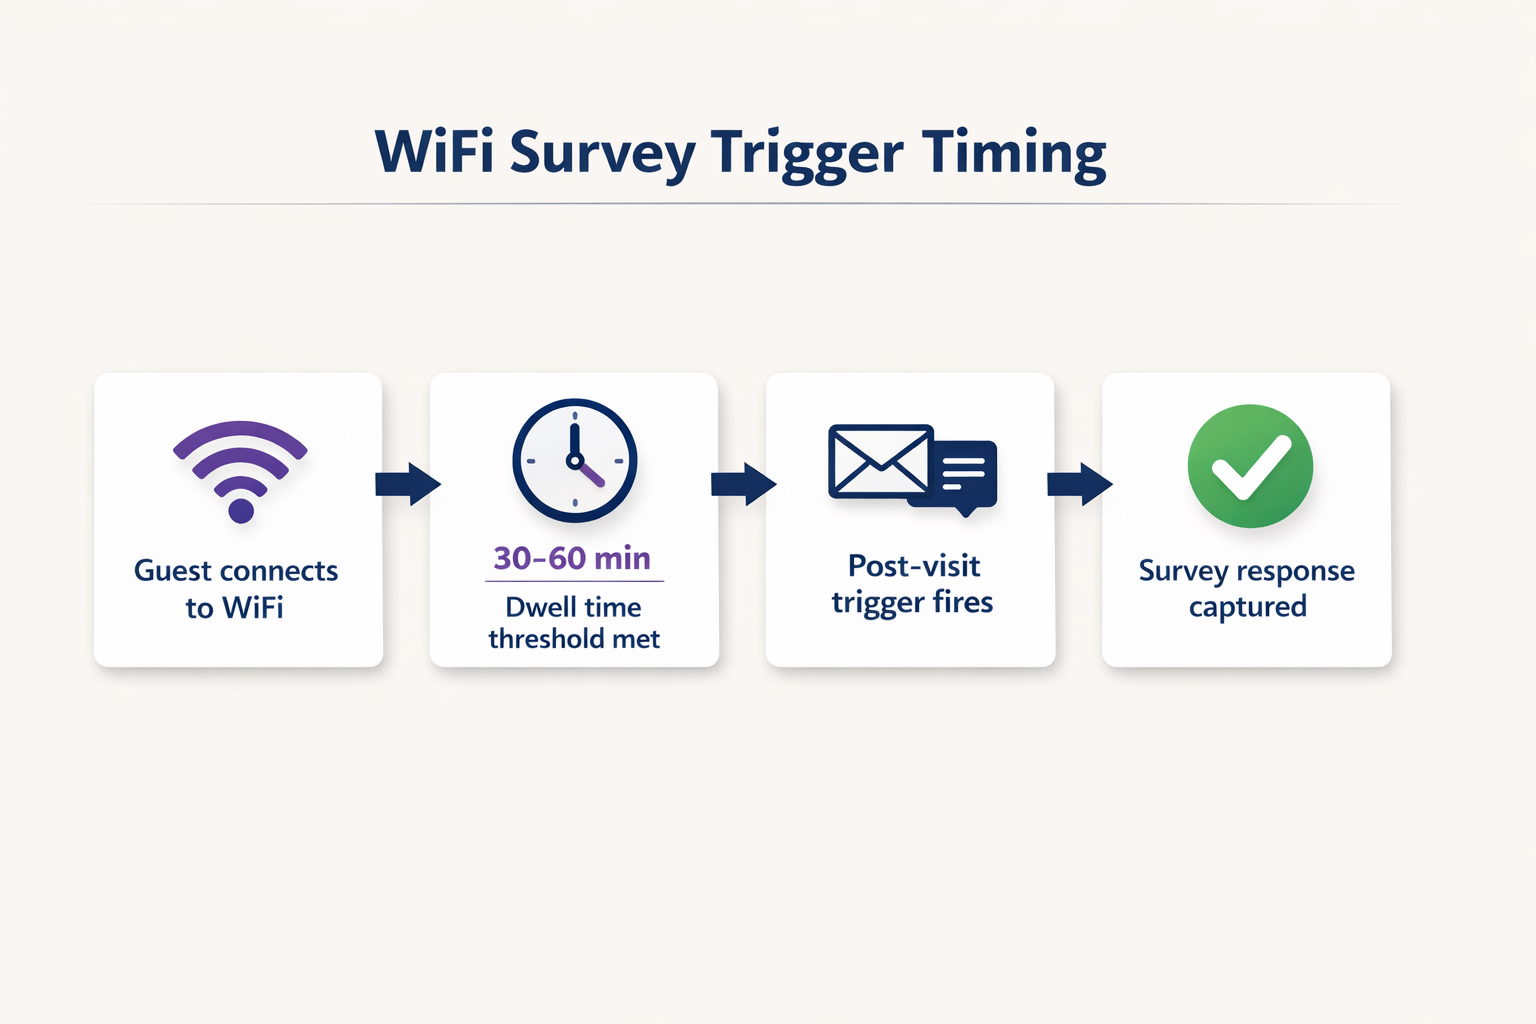
When a guest connects to the network, the system logs the session and authenticates the user through a captive portal, often using a frictionless identity provider model such as OpenRoaming. The critical component is the analytics engine that monitors dwell time in real time. Once the dwell time threshold is met and the user disconnects or leaves the geofenced area, a webhook or API call triggers the survey delivery mechanism — typically SMS or email.
This architecture requires robust integration between the Access Points (APs), the network controller, and the cloud analytics platform. For more on the underlying infrastructure patterns, refer to our guide on Internet of Things Architecture: A Complete Guide . The data flow can be summarised as follows: the AP layer captures the session; the analytics layer enriches it with dwell time and zone data; the integration layer fires the webhook; and the CRM layer receives and acts on the survey response.
Survey Metric Selection: NPS vs CSAT vs CES
The choice of survey metric is a strategic decision, not a technical one — but it has direct implications for how you configure the trigger and how you store and analyse the response data.
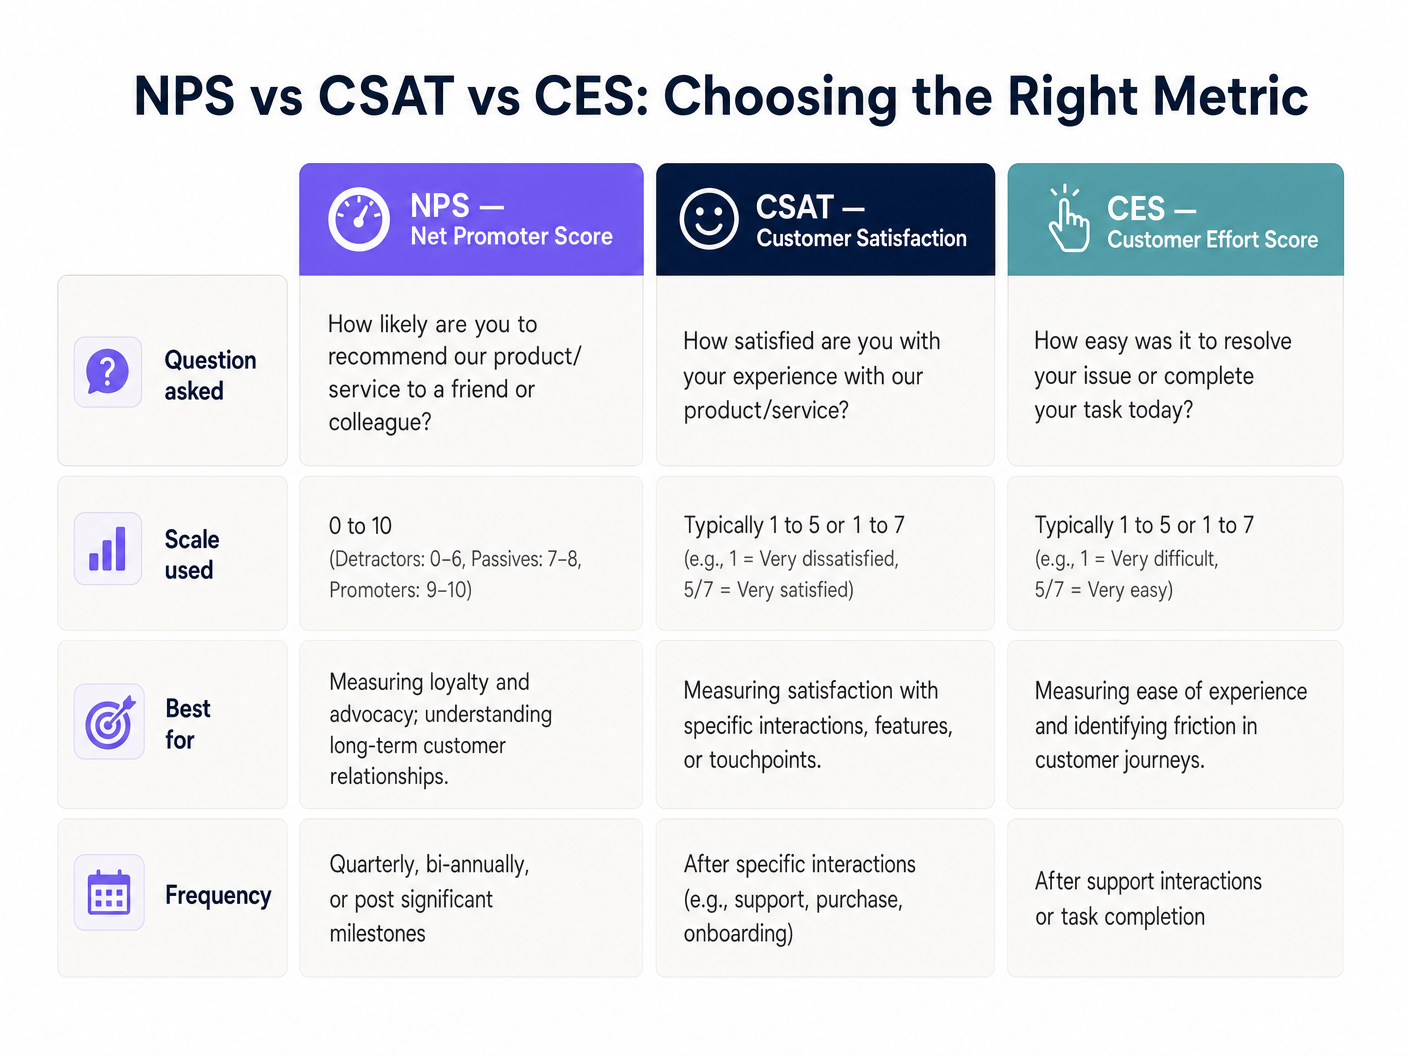
Net Promoter Score (NPS) asks a single question on a zero-to-ten scale and is best suited for measuring overall brand loyalty. Customer Satisfaction (CSAT) uses a one-to-five or one-to-seven scale and is ideal for measuring satisfaction with a specific interaction or touchpoint. Customer Effort Score (CES) measures how easy it was for the customer to accomplish their goal, which is particularly relevant in Healthcare or Transport environments where friction in the service journey is a primary operational concern.
Security and Compliance
Data collection must strictly adhere to GDPR, CCPA, and where applicable, PCI DSS standards. MAC randomization in modern mobile operating systems — a standard feature in iOS 14 and Android 10 onwards — requires advanced identity resolution techniques. The system must link the session to a verified email or phone number captured during the initial captive portal login rather than relying on the hardware MAC address. For a detailed treatment of data security protocols in this context, see How to Protect Customer Data Collected via WiFi .
Implementation Guide
Deploying a WiFi-triggered survey system involves five concrete implementation steps.
Step 1 — Configure the Captive Portal. Set up the initial splash page to capture the necessary contact information (email or phone number) in exchange for free WiFi access. The terms and conditions must explicitly state that this data may be used for feedback purposes. This is the legal foundation of the entire system.
Step 2 — Define Dwell Time Thresholds. Not every connection warrants a survey. A user walking past a venue might connect for two minutes. Set a minimum dwell time appropriate to the venue type: 15 minutes for a quick-service restaurant, 30 to 45 minutes for a retail store, 2 hours for a hotel, and 45 minutes for a stadium or conference centre.
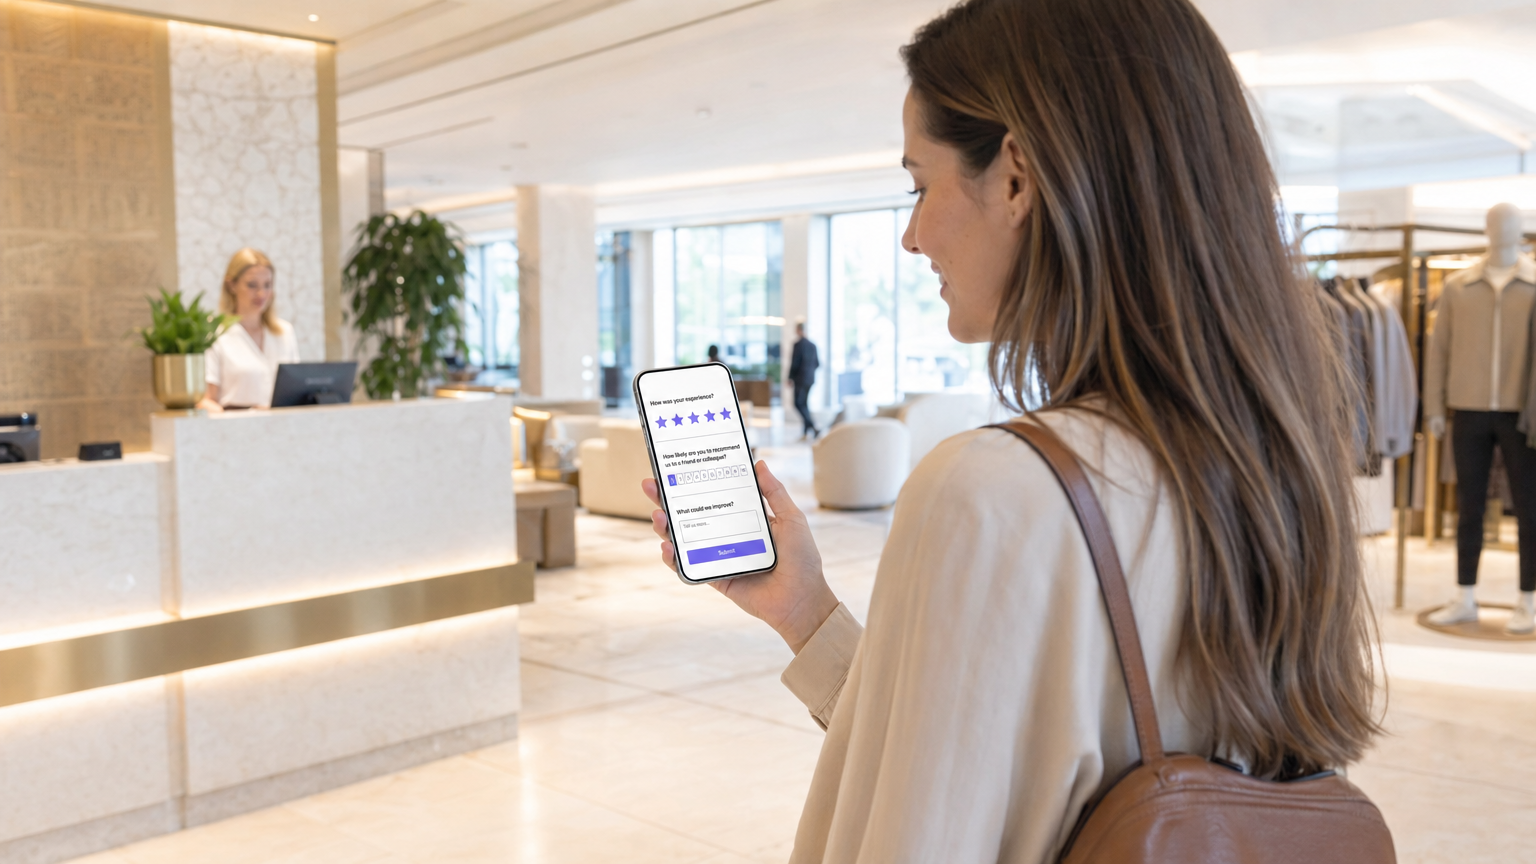
Step 3 — Design the Survey. Keep it to a single primary question. An NPS question followed by an optional open-text field consistently yields the highest completion rates. Avoid multi-page surveys for post-visit WiFi triggers; the context window is short and the user's attention is limited.
Step 4 — Configure the Trigger Mechanism. Set the analytics platform to fire an event when the user's session ends. This event should trigger an automated email or SMS containing the survey link within one to two hours of departure. Delays beyond two hours result in a measurable drop in response rates.
Step 5 — Integrate with CRM. Use RESTful APIs to pipe survey responses directly into your CRM (e.g., Salesforce, HubSpot) or analytics platform. Configure automated workflows: if a detractor score (NPS 0 to 6) is received, trigger an immediate alert to the duty manager for real-time service recovery.
Best Practices
Timing is the single most important variable in WiFi survey deployment. Sending the survey within one to two hours of the guest leaving the venue consistently produces response rates between 15 and 30 percent. Waiting 24 hours drops this to below 5 percent in most venue categories.
Spatial segmentation is a significant differentiator for venues with complex layouts. If your infrastructure supports it, use Access Point zone mapping — or more granularly, Indoor Positioning System: UWB, BLE, & WiFi Guide — to tailor the survey to the specific area the guest visited. A hotel guest who spent three hours in the spa should receive a different survey than one who only used the business lounge.
Mobile optimisation is non-negotiable. Over 85 percent of these surveys will be completed on a smartphone within minutes of receiving the notification. The survey UI must be fully responsive, load in under two seconds, and require no more than two taps to complete the primary question.
For broader enterprise WiFi deployment context, including how survey infrastructure fits into a larger connected venue strategy, see Wi Fi in Auto: The Complete 2026 Enterprise Guide .
Troubleshooting & Risk Mitigation
Low Response Rates are most commonly caused by surveys being sent too late or requiring too many interactions to complete. Diagnose by checking the average time delta between session end and survey delivery. If it exceeds two hours, reconfigure the trigger. Also verify that the first question is embedded directly in the email body rather than requiring the user to click through to a separate page.
MAC Randomisation Issues manifest as return visitors being treated as new guests, breaking longitudinal analysis. The fix is architectural: ensure your captive portal relies on user-authenticated identifiers (email or phone) as the primary key, not the device MAC address. This is a configuration change in the analytics platform, not a network-level fix.
Spam Filter Failures will silently kill your response rate. Ensure your sending domain has valid SPF, DKIM, and DMARC records. Use a dedicated subdomain for survey emails (e.g., surveys.yourdomain.com) to isolate the reputation of your transactional sending infrastructure from your primary marketing domain.
Consent and Compliance Gaps represent the highest-risk failure mode. If the captive portal terms do not explicitly cover the use of contact data for feedback purposes, you are operating outside GDPR Article 6 lawful basis requirements. Conduct a quarterly audit of your captive portal consent language against your data processing register.
ROI & Business Impact
The business case for WiFi-triggered surveys is straightforward. Venues deploying this approach consistently report response rates three to five times higher than traditional post-visit email campaigns, primarily because the survey arrives while the experience is still fresh and emotionally relevant.
The more significant ROI driver, however, is real-time service recovery. By integrating survey responses with a CRM via API, a detractor score can trigger an immediate alert to front-of-house staff within seconds of submission. In hospitality environments, this allows the team to intervene before the guest checks out, converting a potential one-star review into a resolved complaint. The cost of that intervention is negligible compared to the lifetime value of a retained guest or the reputational cost of a negative public review.
For multi-site operators — retail chains, hotel groups, stadium operators — the aggregated data provides a benchmarking capability that is genuinely difficult to replicate through any other channel. You can compare NPS by location, by day of week, by zone, and by demographic segment, all enriched with the dwell time and footfall data that the WiFi analytics platform already captures. This transforms the survey from a simple feedback tool into a strategic intelligence asset.
Key Terms & Definitions
Captive Portal
A web page that a user of a public-access network is obliged to view and interact with before network access is granted. It serves as the primary identity and consent collection point.
This is the architectural foundation of the entire survey system. Without a functioning captive portal that captures a verified email or phone number and explicit consent, no post-visit survey can be legally or technically delivered.
Dwell Time
The total duration a specific device remains connected to or within range of the WiFi network, measured from first association to final disconnection.
Used as the primary filtering metric to ensure surveys are only sent to patrons who spent enough time at the venue to have a meaningful experience. Configuring this threshold correctly is the most important operational decision in the deployment.
MAC Randomization
A privacy feature in modern operating systems (iOS 14+, Android 10+) where the device broadcasts a randomized MAC address when probing for or connecting to networks, rather than the hardware-assigned address.
IT teams must account for this by relying on authenticated user data (email or phone number captured at the portal) rather than hardware addresses to track return visits and build longitudinal profiles.
Webhook
An HTTP callback that sends real-time data from one application to another when a specific event occurs, without requiring the receiving application to poll for updates.
Used to instantly transmit the session-ended event from the WiFi analytics platform to the survey delivery system, enabling the sub-two-hour trigger timing that maximises response rates.
NPS (Net Promoter Score)
A customer loyalty metric based on a single question: 'How likely are you to recommend us to a friend or colleague?' scored on a zero-to-ten scale. Respondents are classified as Detractors (0-6), Passives (7-8), or Promoters (9-10). NPS = % Promoters minus % Detractors.
The most widely adopted brand-level satisfaction metric. Used by venue operators to track loyalty trends over time and benchmark against industry averages.
CSAT (Customer Satisfaction Score)
A metric measuring how satisfied a customer is with a specific product, service, or interaction, typically scored on a one-to-five or one-to-seven scale.
Deployed when operations directors need granular feedback on a specific facility or touchpoint, such as a newly renovated hotel restaurant or a stadium concourse.
OpenRoaming
A roaming federation standard that enables automatic and secure WiFi authentication across different operator networks without requiring the user to manually connect or enter credentials.
Reduces friction for the user connecting to the network, increasing the volume of authenticated sessions available for survey targeting while maintaining a secure, standards-compliant connection.
Service Recovery
The set of actions a service provider takes in response to a service failure to return the customer to a state of satisfaction and prevent churn.
The primary ROI driver for real-time WiFi surveys. An API integration that alerts staff immediately when a low score is submitted allows the team to intervene before the guest leaves, converting a potential negative review into a resolved complaint.
Geofencing
The use of GPS, WiFi signal strength, or Bluetooth beacons to define a virtual perimeter around a physical location, triggering actions when a device enters or exits that boundary.
Used in WiFi survey deployments to detect when a guest has physically left the venue, triggering the post-visit survey webhook without relying solely on network disconnection events.
Case Studies
A 200-room hotel wants to measure guest satisfaction specifically for their new on-site restaurant, but they do not want to survey guests who only used the rooms and did not visit the restaurant.
The IT team configures the WiFi analytics platform to segment users based on Access Point (AP) location. They define a 'Restaurant Zone' comprising the four APs covering the dining area. A trigger rule is created: if a device connects to any AP in the Restaurant Zone for a continuous dwell time of more than 45 minutes, it becomes eligible for a CSAT survey. The trigger fires 30 minutes after the device disconnects from the Restaurant Zone, sending a five-question CSAT survey via email. The survey asks: overall satisfaction with the meal (1-5), food quality (1-5), service speed (1-5), staff friendliness (1-5), and an optional open-text field. Responses are piped via API into the hotel's Salesforce CRM, where a workflow alerts the F&B manager if any score falls below 3.
A large retail chain with 150 stores is experiencing a high bounce rate on their captive portal — only 12% of connecting devices are completing authentication — meaning they are not capturing the contact information needed to send post-visit surveys.
The network architect audits the captive portal flow and identifies that the registration form requires five fields: full name, email, phone number, postcode, and date of birth. The redesign reduces this to two mandatory fields (email address and checkbox consent) and adds a social login option via Google or Apple ID. The captive portal is also redesigned to load within 1.5 seconds on a 4G connection, addressing a secondary drop-off cause. Post-deployment, the authentication completion rate increases from 12% to 47% within 30 days, expanding the eligible survey population by approximately 4x without any changes to the network infrastructure.
Scenario Analysis
Q1. A retail client wants to send a survey to every single person whose phone pings their WiFi network, including passersby on the pavement outside the store. As the solutions architect, what is your recommendation and why?
💡 Hint:Consider the difference between a network probe and an authenticated session, and the legal basis required under GDPR to send a marketing communication.
Show Recommended Approach
Advise strongly against this approach on both legal and data quality grounds. First, a device probing the network has not authenticated through the captive portal, meaning no contact information has been captured and no consent has been obtained. Sending a survey to a device that has merely probed the network is technically impossible without additional tracking infrastructure, and any attempt to do so without explicit consent would breach GDPR Article 6. Second, surveying passersby who never entered the store would pollute the dataset with irrelevant responses. The correct approach is to implement a captive portal with a minimum dwell time threshold of at least 15 minutes, ensuring only actual shoppers who have authenticated and opted in are included in the survey pool.
Q2. Your deployment at a 5,000-capacity conference centre is successfully capturing authenticated emails, but the survey response rate is consistently below 1.5%. The current configuration sends the survey 24 hours after the event ends. How do you diagnose and resolve this?
💡 Hint:Consider both the timing of the trigger and the format of the survey delivery itself.
Show Recommended Approach
The primary issue is timing. A 24-hour delay means the emotional context of the conference experience has largely faded, and the survey competes with the respondent's return-to-work inbox. Reconfigure the webhook trigger to fire within one to two hours of the network detecting session end. Additionally, audit the survey delivery format: if the email requires the recipient to click through to a separate page before seeing the first question, add friction that kills conversion. Embed the NPS zero-to-ten scale directly in the email body as clickable numbers, so the respondent can answer with a single tap without leaving their email client. These two changes — trigger timing and embedded question format — typically increase response rates from below 2% to between 15 and 25%.
Q3. A stadium IT director wants to use the WiFi survey data to trigger real-time alerts to cleaning staff if a specific concourse area receives negative feedback about facilities. How would you architect this end-to-end?
💡 Hint:Think about spatial resolution at the AP zone level, the survey question design, and the API integration layer between the survey platform and the facilities management system.
Show Recommended Approach
The architecture requires three layers working in concert. First, configure the WiFi analytics platform to segment users by AP zone, defining distinct zones for each concourse section. Set a dwell time threshold of 20 minutes for the concourse zones to filter out transit traffic. Second, design the survey to include a zone-specific CSAT question: 'How would you rate the facilities in your area today?' on a one-to-five scale. The survey metadata must include the zone identifier from the session data. Third, integrate the survey platform's response API with the stadium's facilities management software (e.g., ServiceMax or a custom ticketing system). Configure a rule: if a CSAT score of 1 or 2 is received from a specific concourse zone, generate an automated webhook alert to the cleaning team's mobile devices, including the zone name and timestamp. This creates a closed-loop system where negative feedback triggers an operational response within minutes, before the majority of the crowd has left the venue.
