Cómo crear una encuesta de clientes utilizando tu plataforma WiFi
Esta guía proporciona a los líderes de TI, arquitectos de red y directores de operaciones de recintos pasos prácticos para implementar encuestas de satisfacción del cliente post-visita a través de redes WiFi empresariales. Cubre la arquitectura técnica completa, desde la autenticación del captive portal y los umbrales de tiempo de permanencia hasta la selección de métricas de encuesta (NPS vs CSAT) y la integración de CRM impulsada por API. La implementación de encuestas a través de una plataforma WiFi transforma la infraestructura de red existente en un motor de inteligencia de cliente en tiempo real, ofreciendo tasas de respuesta de tres a cinco veces superiores a las de las campañas de correo electrónico post-visita tradicionales.
🎧 Escuchar esta guía
Ver transcripción
Resumen Ejecutivo
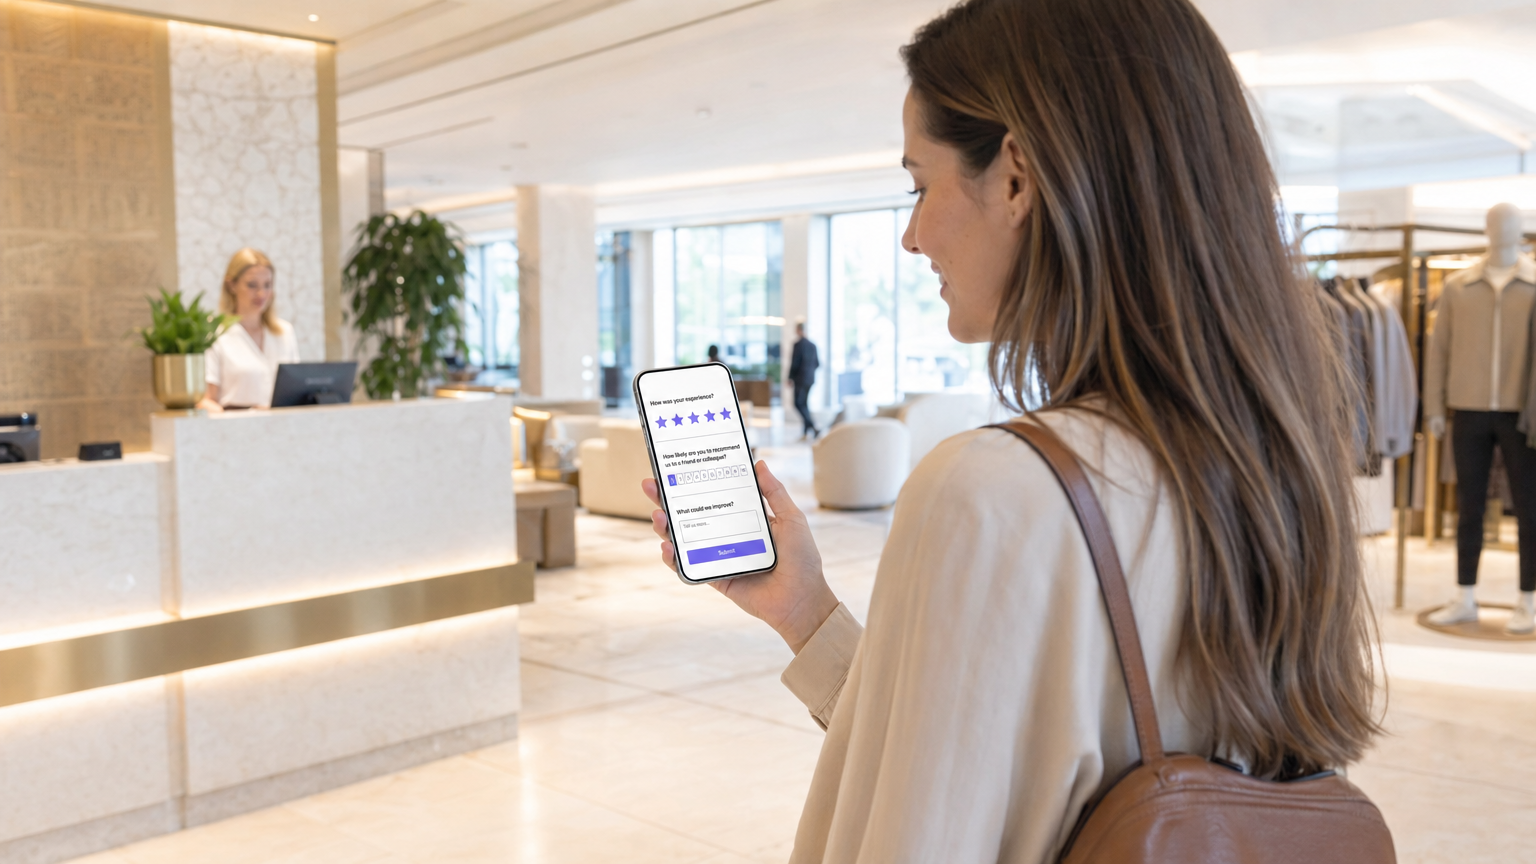
Para los recintos empresariales —desde entornos de Retail hasta propiedades de Hospitality — la red WiFi para invitados es uno de los activos de datos más infrautilizados en la pila tecnológica. Mientras que los mecanismos de retroalimentación tradicionales dependen de la entrada manual de datos o de campañas de correo electrónico masivas, la integración de encuestas de satisfacción del cliente directamente en la experiencia WiFi permite una retroalimentación contextual de alta conversión a escala. Esta guía detalla cómo diseñar un sistema de encuestas activado por WiFi utilizando las soluciones Guest WiFi y WiFi Analytics de Purple. Cubrimos la mecánica de implementación, los algoritmos de temporización para los activadores post-visita, las diferencias técnicas entre las implementaciones de NPS y CSAT, y las integraciones de API necesarias para enviar los datos de respuesta a su CRM o plataforma de análisis. El resultado es un bucle de retroalimentación automatizado, conforme y directamente vinculado al recorrido físico del invitado.
Análisis Técnico Detallado
Construir un sistema de encuestas robusto sobre una red WiFi pública o empresarial requiere más que un captive portal. Demanda una arquitectura sofisticada que respete la privacidad del usuario, se adhiera a los marcos de consentimiento de GDPR y CCPA, y garantice un alto rendimiento sin degradar la experiencia de red principal.
Arquitectura y Flujo de Datos
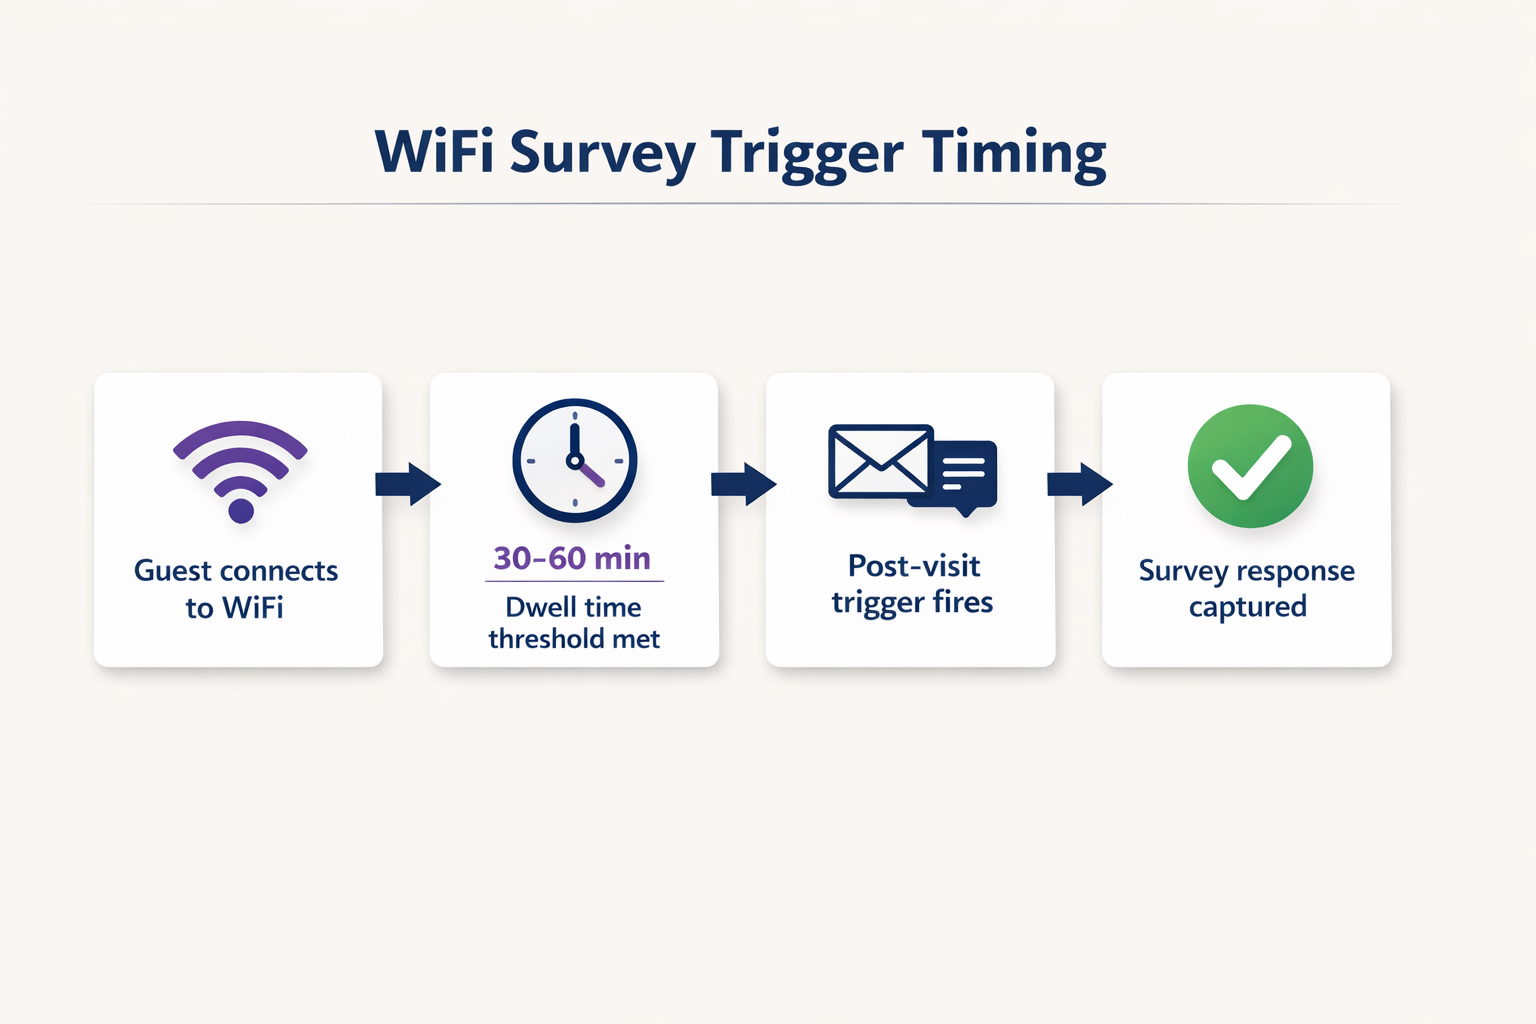
Cuando un invitado se conecta a la red, el sistema registra la sesión y autentica al usuario a través de un captive portal, a menudo utilizando un modelo de proveedor de identidad sin fricciones como OpenRoaming. El componente crítico es el motor de análisis que monitorea el tiempo de permanencia en tiempo real. Una vez que se cumple el umbral de tiempo de permanencia y el usuario se desconecta o abandona el área geocercada, un webhook o una llamada a la API activa el mecanismo de entrega de la encuesta —típicamente SMS o correo electrónico.
Esta arquitectura requiere una integración robusta entre los Puntos de Acceso (APs), el controlador de red y la plataforma de análisis en la nube. Para más información sobre los patrones de infraestructura subyacentes, consulte nuestra guía sobre Arquitectura del Internet de las Cosas: Una Guía Completa . El flujo de datos se puede resumir de la siguiente manera: la capa AP captura la sesión; la capa de análisis la enriquece con el tiempo de permanencia y los datos de zona; la capa de integración dispara el webhook; y la capa CRM recibe y actúa sobre la respuesta de la encuesta.
Selección de Métricas de Encuesta: NPS vs CSAT vs CES
La elección de la métrica de encuesta es una decisión estratégica, no técnica, pero tiene implicaciones directas sobre cómo se configura el activador y cómo se almacenan y analizan los datos de respuesta.
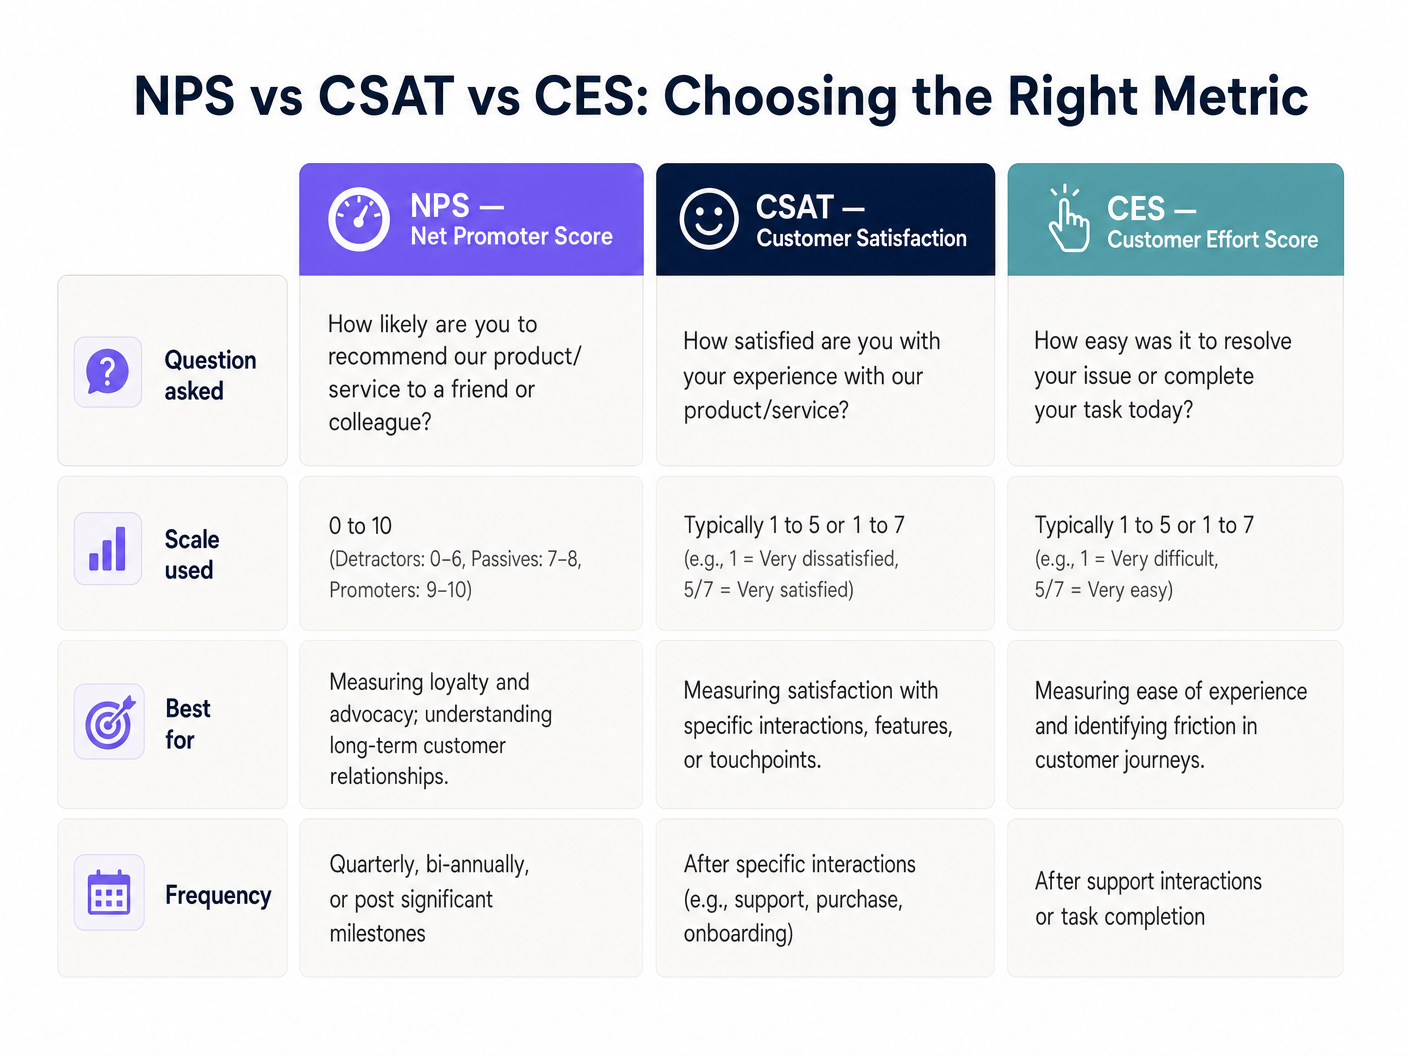
Net Promoter Score (NPS) formula una única pregunta en una escala de cero a diez y es el más adecuado para medir la lealtad general a la marca. Customer Satisfaction (CSAT) utiliza una escala de uno a cinco o de uno a siete y es ideal para medir la satisfacción con una interacción o punto de contacto específico. Customer Effort Score (CES) mide lo fácil que fue para el cliente lograr su objetivo, lo cual es particularmente relevante en entornos de Healthcare o Transport donde la fricción en el recorrido del servicio es una preocupación operativa principal.
Seguridad y Cumplimiento
La recopilación de datos debe adherirse estrictamente a los estándares GDPR, CCPA y, cuando corresponda, PCI DSS. La aleatorización de MAC en los sistemas operativos móviles modernos —una característica estándar en iOS 14 y Android 10 en adelante— requiere técnicas avanzadas de resolución de identidad. El sistema debe vincular la sesión a un correo electrónico o número de teléfono verificado capturado durante el inicio de sesión inicial del captive portal en lugar de depender de la dirección MAC del hardware. Para un tratamiento detallado de los protocolos de seguridad de datos en este contexto, consulte Cómo Proteger los Datos del Cliente Recopilados a través de WiFi .
Guía de Implementación
La implementación de un sistema de encuestas activado por WiFi implica cinco pasos de implementación concretos.
Paso 1 — Configurar el Captive Portal. Configure la página de inicio inicial para capturar la información de contacto necesaria (correo electrónico o número de teléfono) a cambio de acceso WiFi gratuito. Los términos y condiciones deben establecer explícitamente que estos datos pueden utilizarse con fines de retroalimentación. Esta es la base legal de todo el sistema.
Paso 2 — Definir Umbrales de Tiempo de Permanencia. No todas las conexiones justifican una encuesta. Un usuario que pasa por un recinto podría conectarse durante dos minutos. Establezca un tiempo de permanencia mínimo apropiado para el tipo de recinto: 15 minutos para un restaurante de servicio rápido, 30 a 45 minutos para una tienda minorista, 2 horas para un hotel y 45 minutos para un estadio o centro de conferencias.
Paso 3 — Diseñar la Encuesta. Limítela a una única pregunta principal. Una pregunta de NPS seguida de un campo de texto abierto opcional produce consistentemente las tasas de finalización más altas. Evite las encuestas de varias páginas para los activadores WiFi post-visita; la ventana de contexto es corta y la atención del usuario es limitada.
Paso 4 — Configurar el Mecanismo de Activación. Configure la plataforma de análisis para que dispare un evento cuando finalice la sesión del usuario. Este evento debe activar un correo electrónico o SMS automatizado que contenga el enlace de la encuesta dentro de una o dos horas después de la salida. Retrasos superiores a dos horas resultan en una caída medible en las tasas de respuesta.
Paso 5 — Integrar con CRM. Utilice APIs RESTful para enviar las respuestas de la encuesta didirectamente en su CRM (p. ej., Salesforce, HubSpot) o plataforma de análisis. Configure flujos de trabajo automatizados: si se recibe una puntuación de detractor (NPS de 0 a 6), active una alerta inmediata al gerente de turno para la recuperación del servicio en tiempo real.
Mejores Prácticas
El momento es la variable más importante en la implementación de encuestas WiFi. Enviar la encuesta entre una y dos horas después de que el huésped abandone el lugar produce consistentemente tasas de respuesta entre el 15 y el 30 por ciento. Esperar 24 horas reduce esto a menos del 5 por ciento en la mayoría de las categorías de establecimientos.
La segmentación espacial es un diferenciador significativo para los establecimientos con diseños complejos. Si su infraestructura lo permite, utilice el mapeo de zonas de Access Point — o, de forma más granular, Sistema de Posicionamiento Interior: Guía UWB, BLE y WiFi — para adaptar la encuesta al área específica que visitó el huésped. Un huésped de hotel que pasó tres horas en el spa debería recibir una encuesta diferente a uno que solo utilizó la sala de negocios.
La optimización móvil es innegociable. Más del 85 por ciento de estas encuestas se completarán en un smartphone a los pocos minutos de recibir la notificación. La interfaz de usuario de la encuesta debe ser totalmente responsiva, cargarse en menos de dos segundos y no requerir más de dos toques para completar la pregunta principal.
Para un contexto más amplio de implementación de WiFi empresarial, incluyendo cómo la infraestructura de encuestas encaja en una estrategia de establecimiento conectado más grande, consulte Wi Fi en Automoción: La Guía Empresarial Completa 2026 .
Solución de Problemas y Mitigación de Riesgos
Bajas Tasas de Respuesta son causadas más comúnmente por encuestas enviadas demasiado tarde o que requieren demasiadas interacciones para completarse. Diagnostique verificando la diferencia de tiempo promedio entre el final de la sesión y la entrega de la encuesta. Si excede las dos horas, reconfigure el disparador. Verifique también que la primera pregunta esté incrustada directamente en el cuerpo del correo electrónico en lugar de requerir que el usuario haga clic para ir a una página separada.
Problemas de Aleatorización de MAC se manifiestan cuando los visitantes recurrentes son tratados como nuevos huéspedes, rompiendo el análisis longitudinal. La solución es arquitectónica: asegúrese de que su Captive Portal se base en identificadores autenticados por el usuario (correo electrónico o teléfono) como clave principal, no en la dirección MAC del dispositivo. Este es un cambio de configuración en la plataforma de análisis, no una solución a nivel de red.
Fallos del Filtro de Spam reducirán silenciosamente su tasa de respuesta. Asegúrese de que su dominio de envío tenga registros SPF, DKIM y DMARC válidos. Utilice un subdominio dedicado para los correos electrónicos de encuestas (p. ej., surveys.yourdomain.com) para aislar la reputación de su infraestructura de envío transaccional de su dominio de marketing principal.
Lagunas en el Consentimiento y Cumplimiento representan el modo de fallo de mayor riesgo. Si los términos del Captive Portal no cubren explícitamente el uso de datos de contacto para fines de retroalimentación, está operando fuera de los requisitos de base legal del Artículo 6 del GDPR. Realice una auditoría trimestral del lenguaje de consentimiento de su Captive Portal frente a su registro de procesamiento de datos.
ROI e Impacto Empresarial
El caso de negocio para las encuestas activadas por WiFi es sencillo. Los establecimientos que implementan este enfoque reportan consistentemente tasas de respuesta de tres a cinco veces más altas que las campañas de correo electrónico post-visita tradicionales, principalmente porque la encuesta llega mientras la experiencia aún está fresca y emocionalmente relevante.
Sin embargo, el motor de ROI más significativo es la recuperación del servicio en tiempo real. Al integrar las respuestas de la encuesta con un CRM a través de una API, una puntuación de detractor puede activar una alerta inmediata al personal de primera línea a los pocos segundos de su envío. En entornos de hostelería, esto permite al equipo intervenir antes de que el huésped se marche, convirtiendo una posible reseña de una estrella en una queja resuelta. El coste de esa intervención es insignificante en comparación con el valor de vida de un huésped retenido o el coste reputacional de una reseña pública negativa.
Para operadores multisitio — cadenas minoristas, grupos hoteleros, operadores de estadios — los datos agregados proporcionan una capacidad de benchmarking que es realmente difícil de replicar a través de cualquier otro canal. Puede comparar el NPS por ubicación, por día de la semana, por zona y por segmento demográfico, todo ello enriquecido con los datos de tiempo de permanencia y afluencia que la plataforma de análisis WiFi ya captura. Esto transforma la encuesta de una simple herramienta de retroalimentación en un activo de inteligencia estratégica.
Términos clave y definiciones
Captive Portal
A web page that a user of a public-access network is obliged to view and interact with before network access is granted. It serves as the primary identity and consent collection point.
This is the architectural foundation of the entire survey system. Without a functioning captive portal that captures a verified email or phone number and explicit consent, no post-visit survey can be legally or technically delivered.
Dwell Time
The total duration a specific device remains connected to or within range of the WiFi network, measured from first association to final disconnection.
Used as the primary filtering metric to ensure surveys are only sent to patrons who spent enough time at the venue to have a meaningful experience. Configuring this threshold correctly is the most important operational decision in the deployment.
MAC Randomization
A privacy feature in modern operating systems (iOS 14+, Android 10+) where the device broadcasts a randomized MAC address when probing for or connecting to networks, rather than the hardware-assigned address.
IT teams must account for this by relying on authenticated user data (email or phone number captured at the portal) rather than hardware addresses to track return visits and build longitudinal profiles.
Webhook
An HTTP callback that sends real-time data from one application to another when a specific event occurs, without requiring the receiving application to poll for updates.
Used to instantly transmit the session-ended event from the WiFi analytics platform to the survey delivery system, enabling the sub-two-hour trigger timing that maximises response rates.
NPS (Net Promoter Score)
A customer loyalty metric based on a single question: 'How likely are you to recommend us to a friend or colleague?' scored on a zero-to-ten scale. Respondents are classified as Detractors (0-6), Passives (7-8), or Promoters (9-10). NPS = % Promoters minus % Detractors.
The most widely adopted brand-level satisfaction metric. Used by venue operators to track loyalty trends over time and benchmark against industry averages.
CSAT (Customer Satisfaction Score)
A metric measuring how satisfied a customer is with a specific product, service, or interaction, typically scored on a one-to-five or one-to-seven scale.
Deployed when operations directors need granular feedback on a specific facility or touchpoint, such as a newly renovated hotel restaurant or a stadium concourse.
OpenRoaming
A roaming federation standard that enables automatic and secure WiFi authentication across different operator networks without requiring the user to manually connect or enter credentials.
Reduces friction for the user connecting to the network, increasing the volume of authenticated sessions available for survey targeting while maintaining a secure, standards-compliant connection.
Service Recovery
The set of actions a service provider takes in response to a service failure to return the customer to a state of satisfaction and prevent churn.
The primary ROI driver for real-time WiFi surveys. An API integration that alerts staff immediately when a low score is submitted allows the team to intervene before the guest leaves, converting a potential negative review into a resolved complaint.
Geofencing
The use of GPS, WiFi signal strength, or Bluetooth beacons to define a virtual perimeter around a physical location, triggering actions when a device enters or exits that boundary.
Used in WiFi survey deployments to detect when a guest has physically left the venue, triggering the post-visit survey webhook without relying solely on network disconnection events.
Casos de éxito
A 200-room hotel wants to measure guest satisfaction specifically for their new on-site restaurant, but they do not want to survey guests who only used the rooms and did not visit the restaurant.
The IT team configures the WiFi analytics platform to segment users based on Access Point (AP) location. They define a 'Restaurant Zone' comprising the four APs covering the dining area. A trigger rule is created: if a device connects to any AP in the Restaurant Zone for a continuous dwell time of more than 45 minutes, it becomes eligible for a CSAT survey. The trigger fires 30 minutes after the device disconnects from the Restaurant Zone, sending a five-question CSAT survey via email. The survey asks: overall satisfaction with the meal (1-5), food quality (1-5), service speed (1-5), staff friendliness (1-5), and an optional open-text field. Responses are piped via API into the hotel's Salesforce CRM, where a workflow alerts the F&B manager if any score falls below 3.
A large retail chain with 150 stores is experiencing a high bounce rate on their captive portal — only 12% of connecting devices are completing authentication — meaning they are not capturing the contact information needed to send post-visit surveys.
The network architect audits the captive portal flow and identifies that the registration form requires five fields: full name, email, phone number, postcode, and date of birth. The redesign reduces this to two mandatory fields (email address and checkbox consent) and adds a social login option via Google or Apple ID. The captive portal is also redesigned to load within 1.5 seconds on a 4G connection, addressing a secondary drop-off cause. Post-deployment, the authentication completion rate increases from 12% to 47% within 30 days, expanding the eligible survey population by approximately 4x without any changes to the network infrastructure.
Análisis de escenarios
Q1. A retail client wants to send a survey to every single person whose phone pings their WiFi network, including passersby on the pavement outside the store. As the solutions architect, what is your recommendation and why?
💡 Sugerencia:Consider the difference between a network probe and an authenticated session, and the legal basis required under GDPR to send a marketing communication.
Mostrar enfoque recomendado
Advise strongly against this approach on both legal and data quality grounds. First, a device probing the network has not authenticated through the captive portal, meaning no contact information has been captured and no consent has been obtained. Sending a survey to a device that has merely probed the network is technically impossible without additional tracking infrastructure, and any attempt to do so without explicit consent would breach GDPR Article 6. Second, surveying passersby who never entered the store would pollute the dataset with irrelevant responses. The correct approach is to implement a captive portal with a minimum dwell time threshold of at least 15 minutes, ensuring only actual shoppers who have authenticated and opted in are included in the survey pool.
Q2. Your deployment at a 5,000-capacity conference centre is successfully capturing authenticated emails, but the survey response rate is consistently below 1.5%. The current configuration sends the survey 24 hours after the event ends. How do you diagnose and resolve this?
💡 Sugerencia:Consider both the timing of the trigger and the format of the survey delivery itself.
Mostrar enfoque recomendado
The primary issue is timing. A 24-hour delay means the emotional context of the conference experience has largely faded, and the survey competes with the respondent's return-to-work inbox. Reconfigure the webhook trigger to fire within one to two hours of the network detecting session end. Additionally, audit the survey delivery format: if the email requires the recipient to click through to a separate page before seeing the first question, add friction that kills conversion. Embed the NPS zero-to-ten scale directly in the email body as clickable numbers, so the respondent can answer with a single tap without leaving their email client. These two changes — trigger timing and embedded question format — typically increase response rates from below 2% to between 15 and 25%.
Q3. A stadium IT director wants to use the WiFi survey data to trigger real-time alerts to cleaning staff if a specific concourse area receives negative feedback about facilities. How would you architect this end-to-end?
💡 Sugerencia:Think about spatial resolution at the AP zone level, the survey question design, and the API integration layer between the survey platform and the facilities management system.
Mostrar enfoque recomendado
The architecture requires three layers working in concert. First, configure the WiFi analytics platform to segment users by AP zone, defining distinct zones for each concourse section. Set a dwell time threshold of 20 minutes for the concourse zones to filter out transit traffic. Second, design the survey to include a zone-specific CSAT question: 'How would you rate the facilities in your area today?' on a one-to-five scale. The survey metadata must include the zone identifier from the session data. Third, integrate the survey platform's response API with the stadium's facilities management software (e.g., ServiceMax or a custom ticketing system). Configure a rule: if a CSAT score of 1 or 2 is received from a specific concourse zone, generate an automated webhook alert to the cleaning team's mobile devices, including the zone name and timestamp. This creates a closed-loop system where negative feedback triggers an operational response within minutes, before the majority of the crowd has left the venue.
