
Passenger WiFi: How Transit Operators Use WiFi Data to Understand Journeys
This technical guide explains how transit operators leverage passenger WiFi infrastructure to capture operational analytics. It covers the technical architecture, deployment best practices, and real-world applications for measuring foot traffic, dwell time, and journey patterns.
Listen to this guide
View podcast transcript
Part of our core series: WiFi Analytics Guide →

Executive Summary
For transit operators - whether they manage intercity rail networks, urban bus fleets, or marine ferry services - passenger WiFi is often viewed merely as an operational cost or a passenger amenity. However, when integrated with an enterprise-grade analytics layer, this existing infrastructure transforms into a powerful operational intelligence tool. By capturing device connection metadata, operators can map passenger footfall, measure dwell times within station zones, and track journey patterns, without relying solely on ticketing data.
This guide provides IT managers, network architects, and operations directors with a practical framework for deploying and leveraging passenger WiFi analytics. We explore the foundational technical architecture required to securely capture device signals, operational use cases that deliver measurable ROI, and the compliance requirements necessary to process this data within CCPA/CPRA and data protection frameworks.
Listen to a briefing on this topic from our senior consultants:
Technical Deep Dive: Architecture and Data Flow
The foundation of any passenger WiFi analytics capability is the network's ability to securely capture and process device metadata. This architecture typically consists of four main layers:
- Access Point Layer (Edge): Physical hardware deployed in stations and rolling stock. Modern deployments utilizing IEEE 802.11ax (WiFi 6) provide high-density client support and capture essential metadata, including MAC addresses, signal strength (RSSI), and connection timestamps.
- Data Collection Layer (Controller): A centralized cloud-managed controller aggregates raw session logs and roaming handoffs from the access point layer.
- Analytics Engine: Platforms like Purple's WiFi Analytics layer process raw logs, apply machine learning models to filter out staff devices and transient signals, and convert raw data into meaningful metrics (e.g., dwell time, foot traffic).
- Operations Dashboard: The visualization layer where network planners and station managers consume insights through real-time dashboards and heatmaps.

Overcoming MAC Randomization
A critical technical challenge in modern WiFi analytics is MAC address randomization. Since iOS 14 and Android 10, devices randomize their MAC addresses per network to enhance privacy. While this does not affect overall foot traffic or dwell time metrics (as the session remains consistent during a single visit), it limits the ability to track anonymously returning visitors over time.
The architectural solution to this is authenticated Guest WiFi. By routing users through a Captive Portal that requires authentication (e.g., email or social login), the system creates a persistent, consented user profile. This profile links session data to a known user, bypassing the limitations of MAC randomization while strictly complying with data protection regulations.
Implementation Guide: From Infrastructure to Insights
Ensuring data accuracy and network security requires a structured approach to deploying passenger WiFi analytics.
- Conduct Comprehensive RF Audits: Analytics accuracy depends entirely on network coverage. Dead zones in station concourses or platforms cause dropped sessions and fragmented journey data. Conduct thorough RF site surveys to ensure continuous coverage across all passenger zones.
- Standardize Data Integration: Transport networks often feature heterogeneous hardware (e.g., Cisco Meraki in stations, different vendors on rolling stock). Implement a vendor-agnostic API layer to normalize session logs before they reach the analytics engine.
- Implement Robust Security Controls: Passenger-facing networks are high-risk attack surfaces. Implement WPA3 where client compatibility allows, enforce strict client isolation (Layer 2 isolation) to prevent lateral movement between passenger devices, and deploy DNS filtering to block malicious domains. For more information on securing these environments, review our guide on Protect Your Network with Strong DNS and Security.
- Define Zonal Architecture: Divide your physical locations into logical zones (e.g. concourse, retail areas, platforms). This enables granular dwell time analysis, allowing operators to differentiate between a passenger browsing a retail zone and one waiting on a platform due to a service delay.
Got questions about your specific setup?
Our team works with venue operators, IT managers, and network engineers across 80,000 venues. Book a 20-minute call and we will show you how others like you solved it.
Best Practices and Operational Use Cases
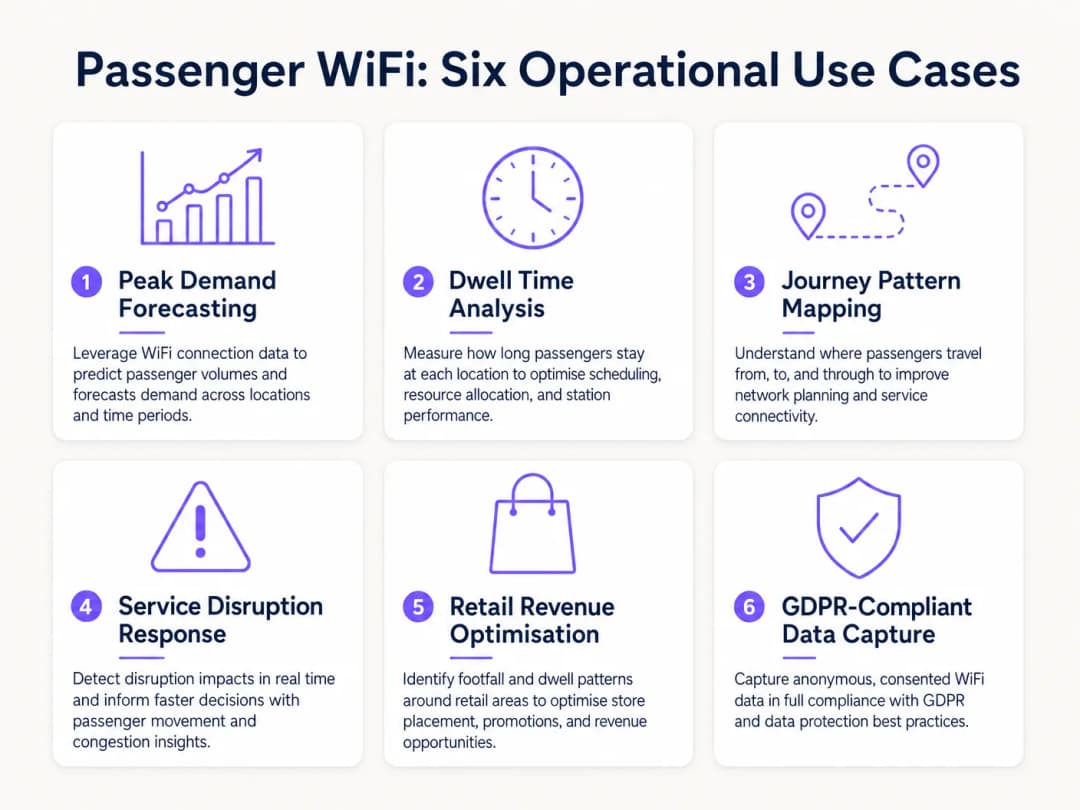
Transit operators are leveraging WiFi analytics to drive efficiency across multiple operational domains. Just as venues in Retail and Hospitality use footfall data to optimize staffing, transit operators use these insights to manage peak demand.
Real-World Case Study: Intercity Rail Network
A major US intercity rail operator deployed WiFi analytics across twelve terminus stations to mitigate platform overcrowding. By correlating WiFi connection spikes with train departure times, the operations team identified that dangerous crowding occurred on specific platforms 40 minutes prior to departure. The data revealed that passengers were arriving earlier than expected due to unclear digital signage in the main concourse. By adjusting the timing of platform announcements on departure boards, the operator smoothed passenger flow, reducing peak platform density by 22% and improving overall safety.
Real-World Case Study: Ferry Terminal Operations
A regional ferry operator managing heavy summer traffic used WiFi dwell time analytics to optimize their terminal retail strategy. The analytics dashboard highlighted that passengers waiting for delayed crossings had an average dwell time of 45 minutes in the terminal, but only 12% entered the secondary retail zone. By repositioning digital signage and triggering automated push notifications via the Captive Portal offering coffee discounts during delays, the operator increased retail conversion by 18% during disruption events.
Troubleshooting and Risk Mitigation
When implementing passenger WiFi analytics, IT teams must mitigate several common failure modes:
- Data Dilution from Staff Devices: Failure to filter out staff devices (e.g. cleaning crews, retail staff) significantly distorts dwell time metrics. Implement strict MAC address filtering or a dedicated SSID for staff to ensure passenger data remains clean.
- Compliance Failure: Capturing device data without explicit consent or a documented lawful basis violates CCPA/CPRA. Ensure your Captive Portal clearly outlines the data processing policy and captures explicit consent where required.
- Backhaul Bottlenecks: Onboard systems relying on cellular backhaul (LTE/5G) often face bandwidth constraints. Ensure your architecture buffers analytics data locally during connectivity drops and syncs asynchronously to prevent data loss without impacting passenger browsing speeds.
ROI and Business Impact
The return on investment for passenger WiFi analytics extends far beyond the IT department. By treating the network as an intelligence asset, operators can:
- Optimize Resource Allocation: Align station staffing, cleaning schedules, and security patrols with empirical footfall data rather than static schedules.
- Drive Retail Revenue: Provide retail tenants with accurate footfall and conversion metrics, supporting premium lease rates in high-traffic zones.
- Improve Passenger Experience: Identify friction points in the station journey and proactively manage crowding, just as the Healthcare sector uses similar technology to understand patient flow. For context on cross-industry applications, see How WiFi Can Improve Patient Experience in Hospitals.
By integrating WiFi analytics into core operational strategies, transportation operators in the Transport sector can transition from reactive management to proactive, data-driven service delivery.
Key Definitions
MAC Address Randomization
A privacy feature in modern operating systems (iOS, Android) that generates a temporary, random MAC address for each WiFi network the device connects to.
IT teams must account for this as it prevents the tracking of repeat visitors using only hardware identifiers, necessitating captive portal authentication.
Dwell Time
The total duration a device remains connected or visible to the WiFi network within a specific physical zone.
Used by operations directors to measure how long passengers wait on platforms or spend in retail areas, directly impacting commercial and safety planning.
Captive Portal
A web page that users must view and interact with before being granted access to a public WiFi network.
The primary mechanism for capturing user consent, enforcing terms of service, and collecting first-party marketing data.
IEEE 802.11ax (WiFi 6)
The current standard for wireless networks, designed to improve performance in high-density environments.
Essential for transit hubs like stadiums and train stations where thousands of devices attempt to connect simultaneously.
RSSI (Received Signal Strength Indicator)
A measurement of the power present in a received radio signal.
Analytics engines use RSSI values from multiple access points to triangulate a device's physical location within a venue.
Client Isolation
A security feature that prevents devices connected to the same WiFi network from communicating directly with each other.
Critical for public passenger WiFi to prevent malicious actors from scanning or attacking other users' devices on the network.
Foot Traffic
The total number of unique devices detected by the WiFi network within a specific timeframe.
Provides station managers with an accurate proxy for total passenger volume, independent of ticket sales.
Cellular Backhaul
The use of cellular networks (LTE/5G) to connect a local WiFi network (like on a bus or train) back to the internet.
The primary ongoing operational cost (OPEX) for onboard WiFi deployments, requiring careful bandwidth management.
Worked Examples
A major train station operator is experiencing severe congestion on Platform 4 during the evening rush hour. They need to understand where these passengers are originating from within the station (e.g., main concourse vs. retail zone) to improve flow.
- Deploy high-density IEEE 802.11ax access points across the concourse, retail zones, and Platform 4 to ensure contiguous coverage.
- Configure the analytics platform to define logical 'Zones' for each area.
- Analyze the 'Zone-to-Zone Transition' reports in the analytics dashboard during the 4:00 PM - 7:00 PM window.
- Identify the primary origin zones for devices arriving at Platform 4.
- If the data shows a bottleneck originating from the retail zone corridor, operations can deploy staff to redirect flow or update digital signage to route passengers through a secondary concourse entrance.
A regional transit operator wants to offer free onboard WiFi but needs to justify the cellular backhaul costs to the commercial director by capturing marketing data.
- Implement a cloud-managed captive portal for the onboard WiFi network.
- Configure the portal to require authentication via email or social login (e.g., Facebook, Google).
- Ensure the portal includes a clear, CCPA/CPRA-compliant privacy notice and opt-in check boxes for marketing communications.
- Integrate the captive portal data capture directly with the operator's CRM or email marketing platform via API.
- Track the volume of new marketing opt-ins generated per route and calculate the equivalent cost-per-acquisition (CPA) to justify the backhaul OPEX.
Practice Questions
Q1. Your ferry terminal has deployed WiFi analytics, but the average dwell time in the main waiting lounge is reporting as 8.5 hours, which is impossible given your sailing schedule. What is the most likely cause and how do you fix it?
Hint: Consider what other devices might be permanently located in or near the waiting lounge.
View model answer
The analytics engine is likely capturing static devices (e.g., smart TVs, digital signage, point-of-sale systems) or staff devices that remain in the lounge all day. The solution is to identify the MAC addresses of these known devices and configure the analytics platform to filter them out of the dataset.
Q2. A bus operator wants to track how many passengers travel the full length of a specific route versus hopping off early. They are relying purely on anonymous MAC address tracking from the onboard access point. Why might this data be inaccurate?
Hint: Think about how modern smartphones handle network connections to protect privacy.
View model answer
Modern smartphones use MAC address randomization. While connected to the bus WiFi, the session is tracked accurately. However, if a device disconnects (e.g., goes to sleep) and reconnects later on the route, it may present a new MAC address, making it appear as a new passenger rather than a continuing journey. Implementing a captive portal for authentication is required to track persistent journeys accurately.
Q3. You are deploying WiFi across a large train station with a high-density concourse. To ensure secure data capture and protect passengers, what two critical network security configurations must be enabled on the public SSID?
Hint: One prevents devices from talking to each other; the other prevents access to malicious sites.
View model answer
- Client Isolation (Layer 2 isolation) must be enabled to prevent passenger devices from communicating with or attacking each other on the local network. 2. DNS Filtering should be deployed to block access to known malicious domains, phishing sites, and inappropriate content.
Continue reading in this series
Measuring the Business ROI of Guest WiFi and Location Analytics
This technical reference shows IT and venue teams how to measure the ROI of guest WiFi with a defensible chain from network health and consented data to validated operational or commercial outcomes. It separates measurable evidence from assumptions, maps Purple Connect, Capture and Engage to the right measurement layer, and gives planning scenarios for hotels, retail estates, and event venues.
Privacy by Design: Anonymizing WiFi Data for GDPR Compliance
This authoritative guide details the technical architecture and implementation strategies for anonymising WiFi data to ensure GDPR compliance. It provides IT leaders and network architects with actionable frameworks for balancing robust venue analytics with strict data privacy requirements.
Heatmapping vs Presence Analytics: Technical Differences
This authoritative technical guide details the critical architectural and operational differences between WiFi heatmapping and presence analytics for enterprise venue operators. It provides IT leaders, network architects, and operations directors with actionable deployment frameworks, real-world implementation scenarios, and vendor-neutral best practices for extracting maximum ROI from their existing wireless infrastructure.
Got questions about your specific setup?
Our team works with venue operators, IT managers, and network engineers across 80,000 venues. Book a 20-minute call and we will show you how others like you solved it.