平均证明清白时间:如何证明问题不在 WiFi
平均证明清白时间 (MTTI) 是衡量 IT 团队花费多少时间来证明网络问题并非自身责任的关键指标。本指南详细介绍了五步可观测性方法论,旨在消除多租户环境中的推诿现象,用共享证据取代相互指责,从而降低平均解决时间 (MTTR)。
收听本指南
查看播客转录
📚 核心系列的一部分:多租户 WiFi:完整指南 →
执行摘要
当多租户环境中的连接中断时,WiFi 总是最先被归咎的对象。它是网络中可见的边缘、设备前的最后一公里(最后一跳),也是沮丧的用户最容易抱怨的目标。对于 IT 经理、网络架构师和场所运营总监而言,这造成了持续的运营负担:即花费时间来证明清白。
平均证明清白时间 (MTTI) 衡量的是从报告事件到团队能够证明其管辖领域并非根本原因之间的平均流逝时间。在诸如长租公寓 (BTR) 街区、酒店或会议中心等复杂环境中,网络管理权分散在物业经理、托管 WiFi 服务提供商和互联网服务提供商 (ISP) 之间。在缺乏确凿遥测数据的情况下,各团队往往会争论责任归属而非着手解决故障,这导致 MTTI 延长,进而推高了平均解决时间 (MTTR)。
本指南详细介绍了系统性降低 MTTI 的五步可观测性方法论。通过部署持续的主动拨测(合成检测)、逐跳路径可视化、流数据分析、拓扑映射和事件关联,您可以用共享证据取代敌对式的相互指责。我们的目标不是更快地在推诿游戏中胜出,而是彻底终结这种游戏。
技术深挖:MTTI 的运作机制
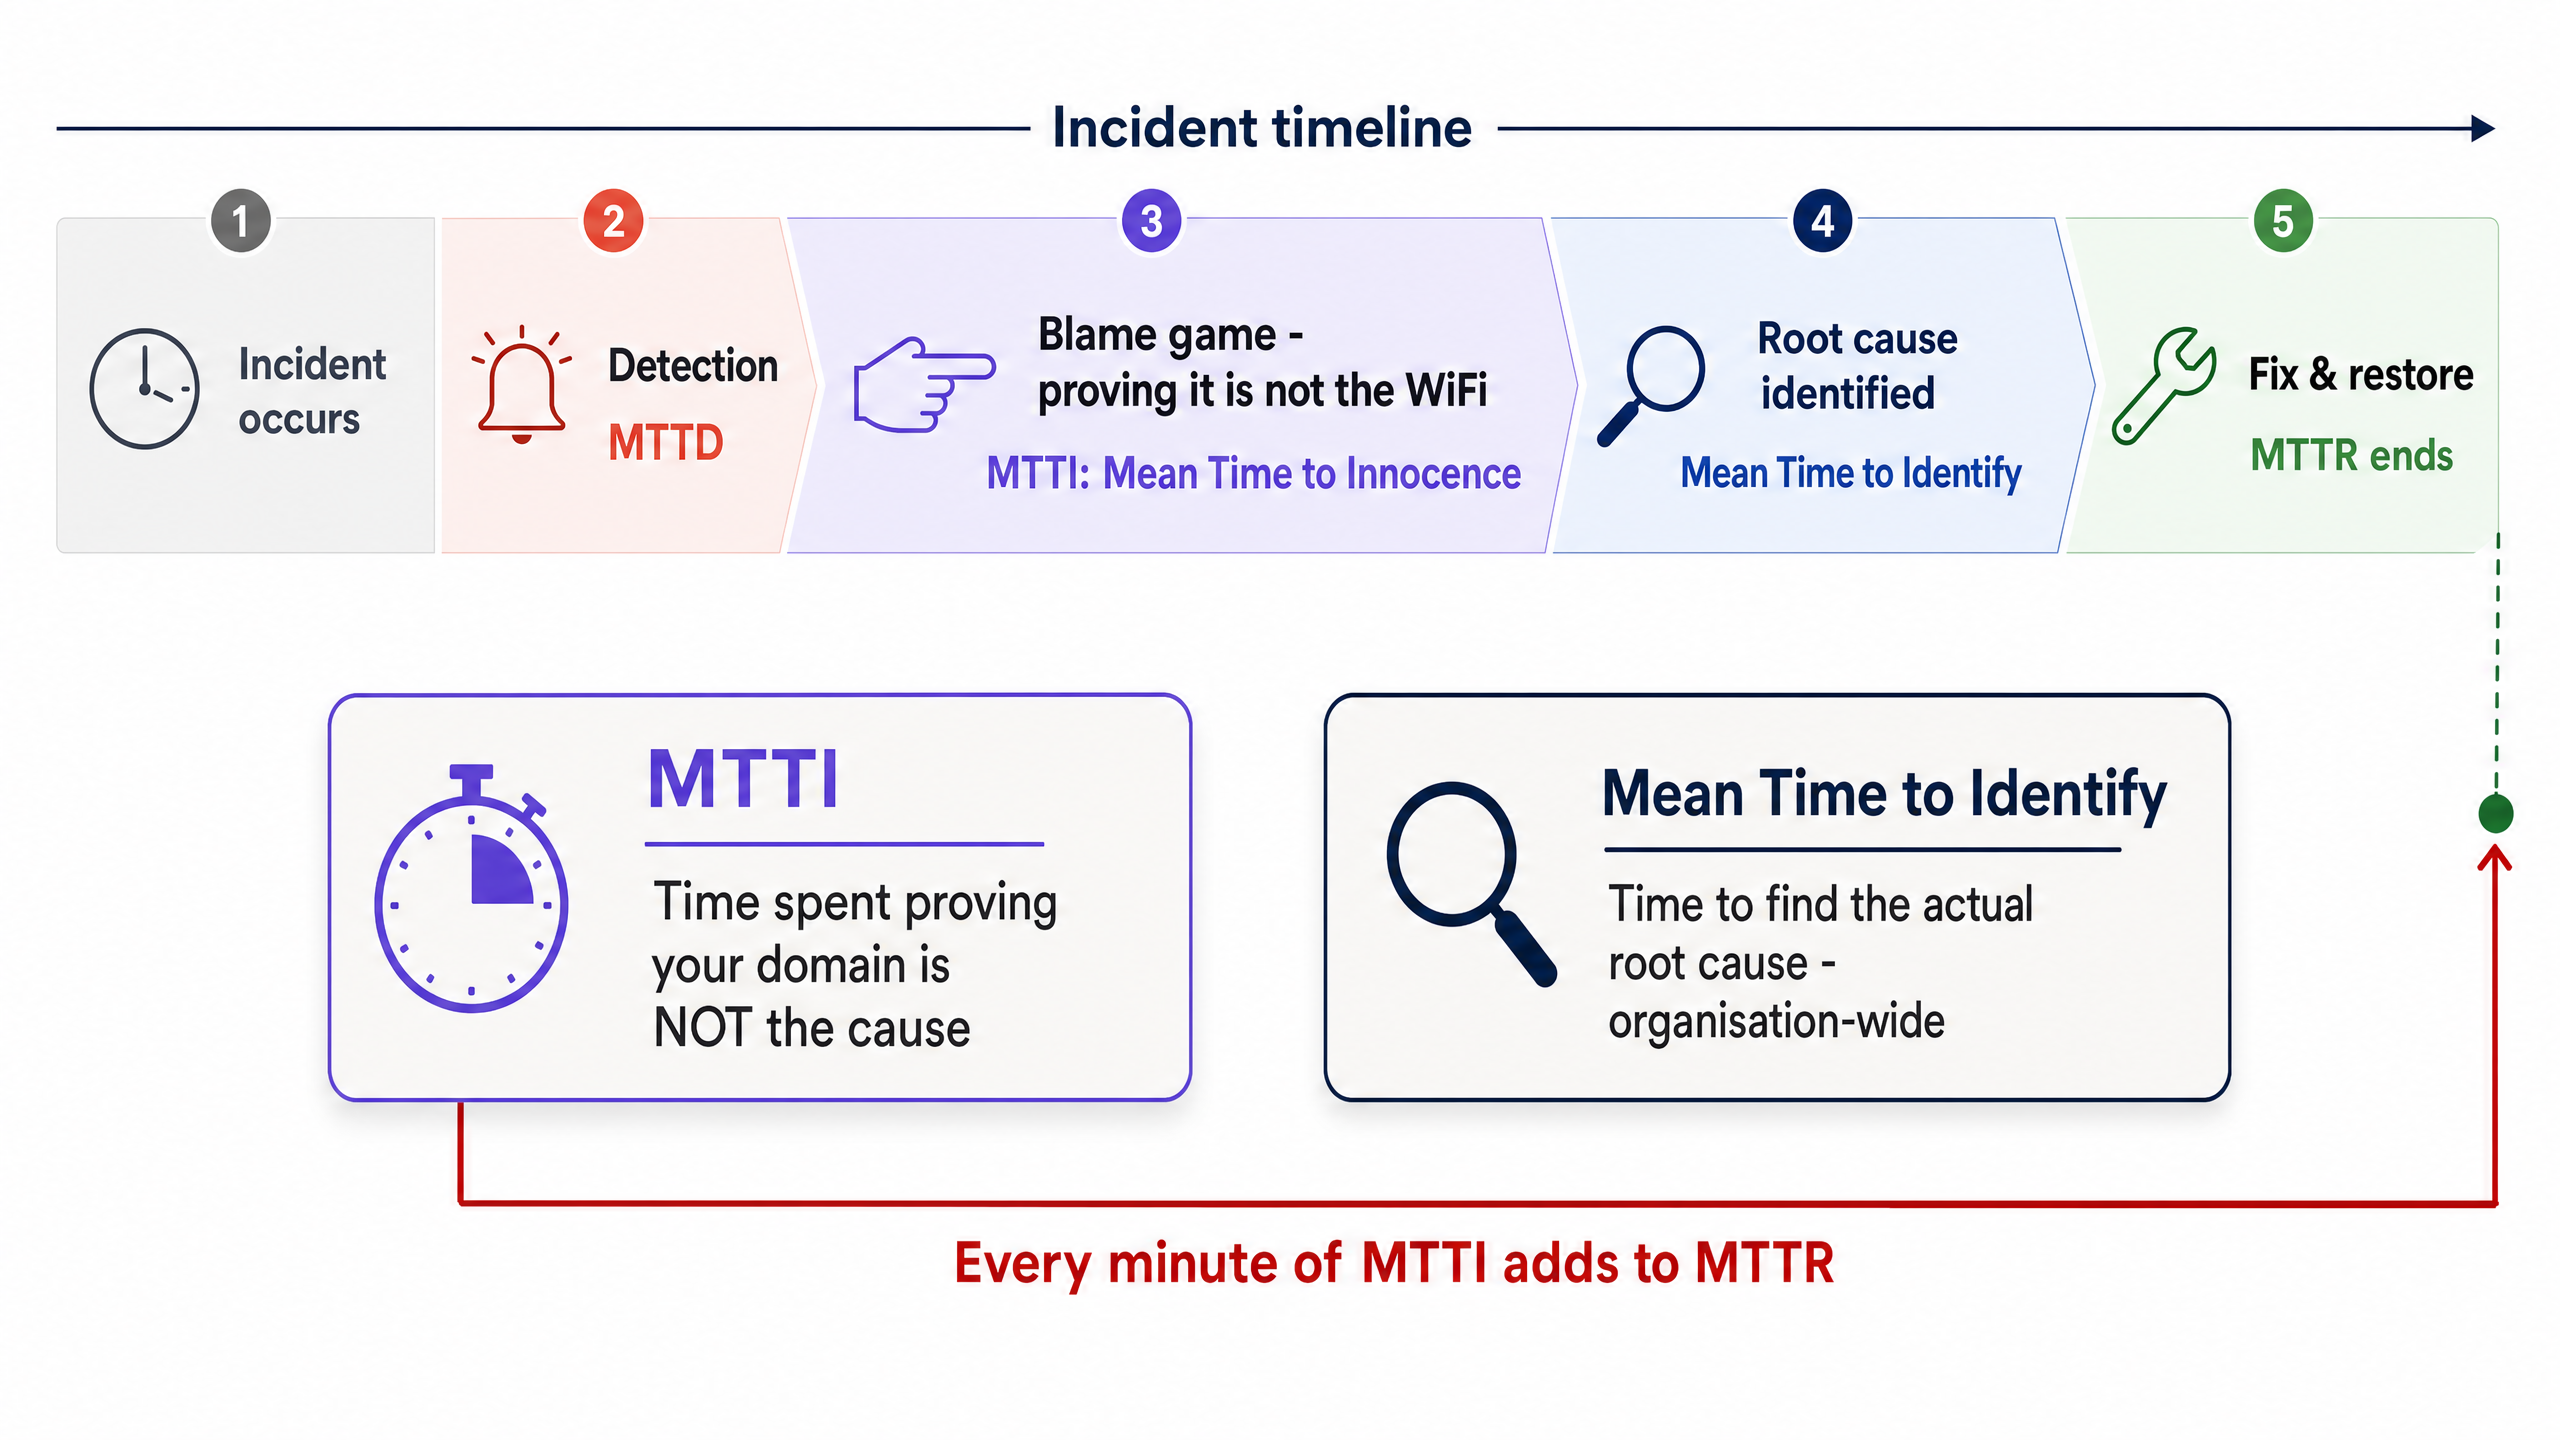
MTTI 与平均识别时间的区别
区分 MTTI 与平均识别时间至关重要。平均识别时间是一个组织层面的指标,用于追踪找出故障实际根本原因所需的时间。而 MTTI 是一个孤立的、特定领域的指标,用于追踪一个团队证明自己不是“罪魁祸首”所需的时间。
MTTI 每增加一分钟,都会直接累加到 MTTR 中。如果托管 WiFi 提供商花费 40 分钟手动检查接入点 (AP) 和交换机日志,最后才得出问题出在 ISP 端的结论,那么在实际修复工作开始之前,MTTR 就已经平白增加了 40 分钟。
为什么 WiFi 总是替罪羊
在为 80,000 多个活跃场所的 3.5 亿独立用户提供服务的环境中,Purple 反复看到了同样的模式。由于以下三个结构性现实,WiFi 层默认会成为被归咎的对象:
- 可见性偏差:WiFi 信号指示图标是普通场所用户唯一可用的网络诊断工具。
- 边缘邻近性:作为连接到客户端设备的最后一跳,WiFi 继承了所有上游故障的症状。从用户的角度来看,ISP 端的 DNS 超时与 AP 故障看起来完全一样。
- 遥测空白:从历史上看,证明无线网络健康状况需要人工干预。如果您无法在两分钟内出示无线层运行良好的证明,您就会在舆论上陷入被动。
多租户环境的复杂性
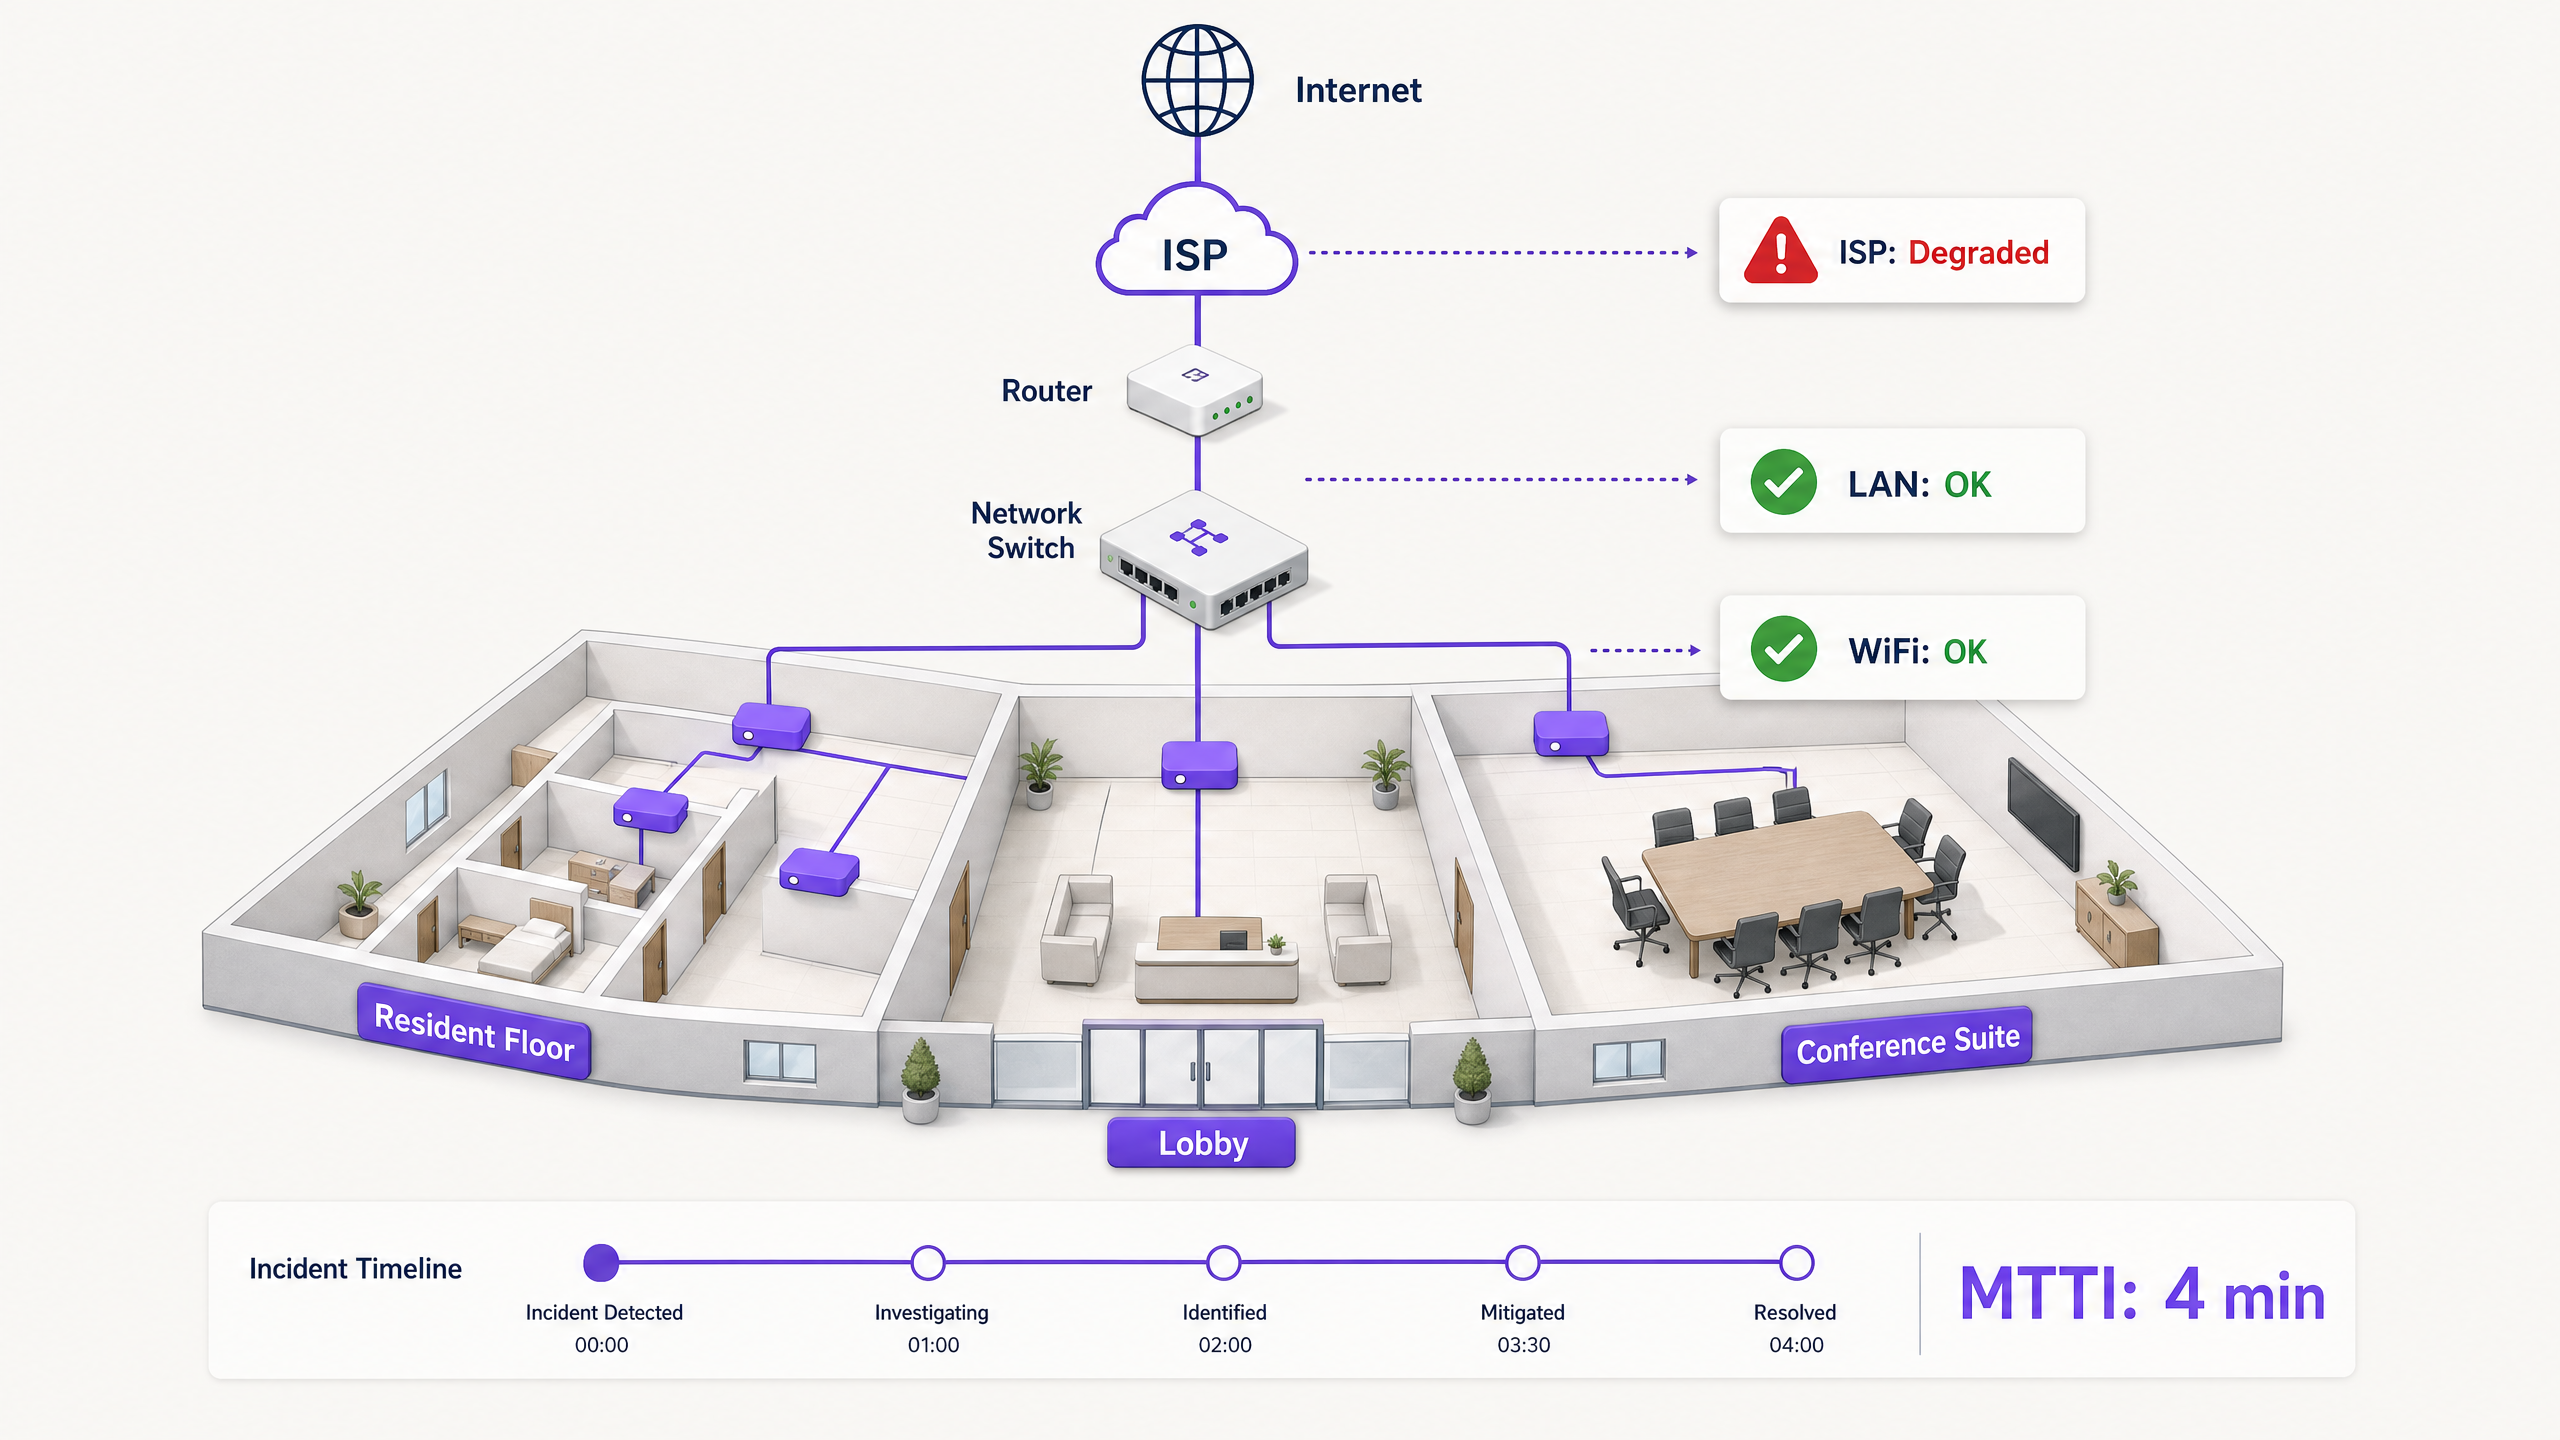
在单租户企业中,网络团队拥有从 AP 到防火墙的整个技术栈。而在多租户 WiFi 环境中,所有权是割裂的。
长租公寓 (BTR) 居民向物业经理付费。物业经理与托管 WiFi 提供商签约。托管 WiFi 提供商则依赖第三方 ISP 线路,且通常还依赖业主的楼内分配网络。当居民无法播放流媒体视频时,提供商必须迅速证明 WiFi 硬件(Cisco Meraki、HPE Aruba、Ruckus 或 Juniper Mist)没有问题,并将故障定位到客户端设备、大楼交换机或 ISP。如果做不到这一点,就会损害提供商与物业经理之间的商业关系。
实施指南:五步方法论
要系统性地降低 MTTI,请部署这套五层可观测性架构。
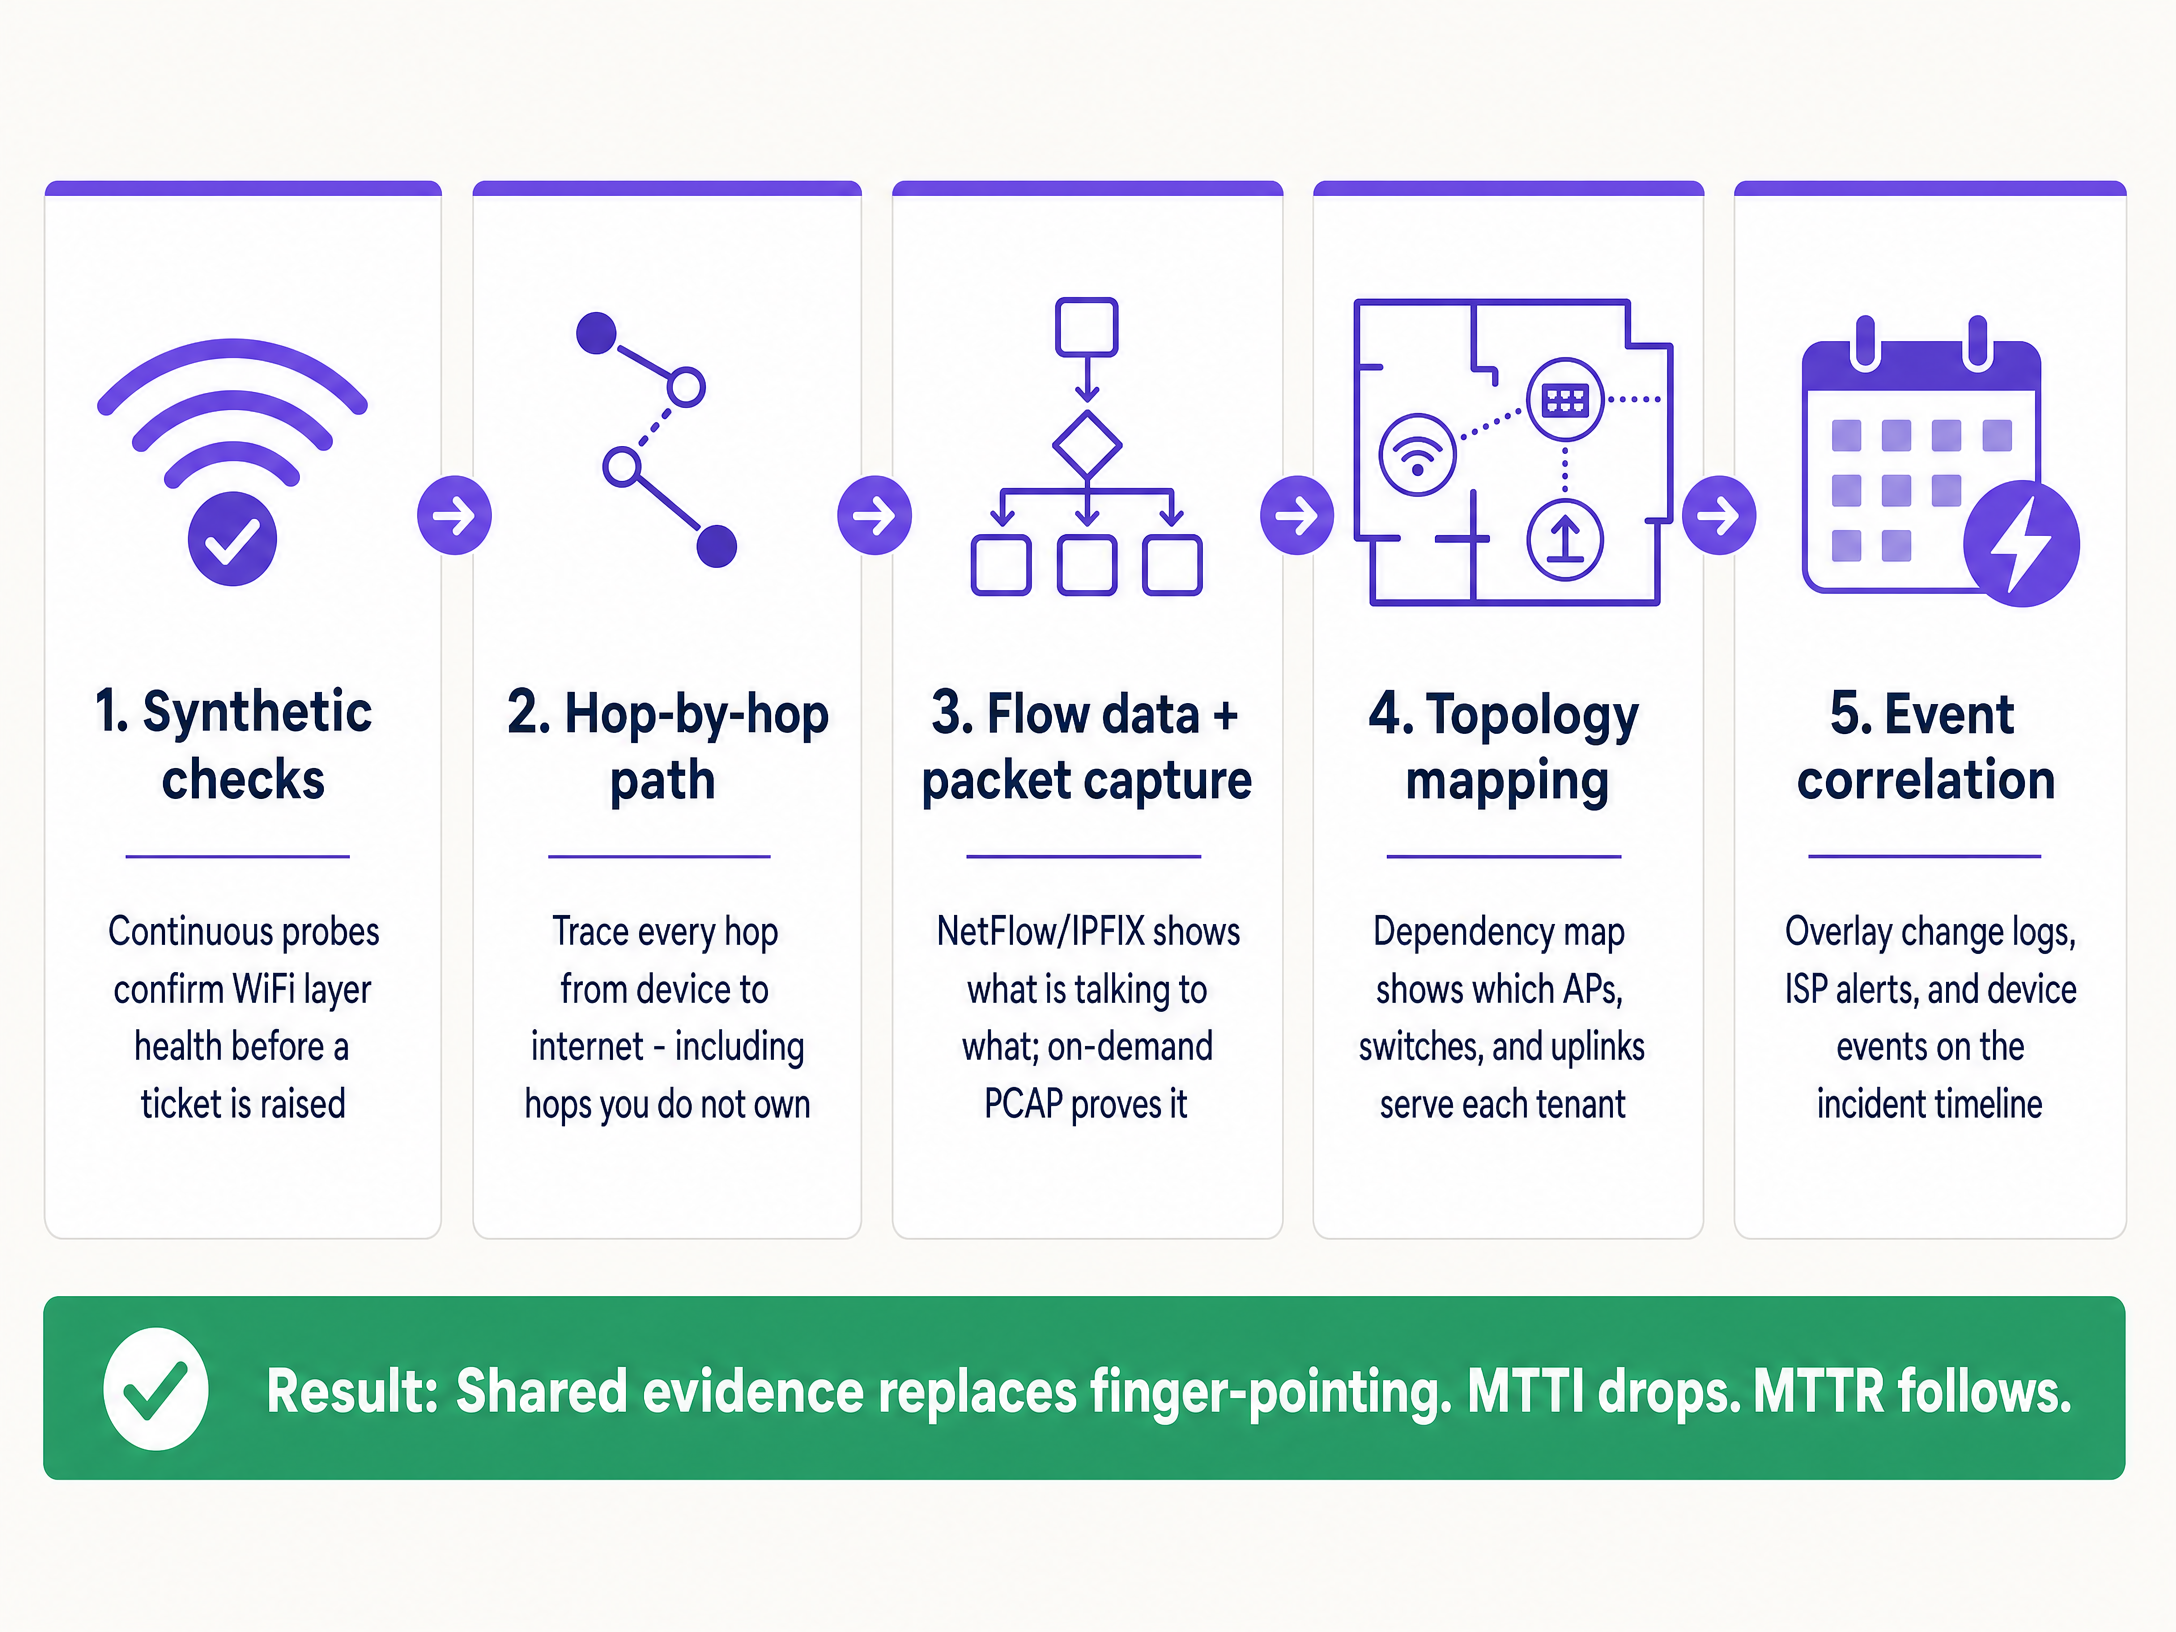
1. 持续主动拨测(合成检测)
不要等待用户投诉。部署自动化的主动探测器,从网络边缘持续模拟用户行为。
- 实施:配置 AP 或专用传感器,针对 DHCP 响应、DNS 解析、HTTP 可达性以及认证流程(例如 802.1X 或 captive portal 登录)运行定期测试。
- 成效:当工单创建时,您首先检查拨测仪表板。如果探测器显示在投诉发生的准确时间 HTTP 可达性良好,您可以立即排除 WiFi 层和 WAN 线路的问题,将注意力转移到特定的客户端设备或目标应用程序上。
2. 逐跳路径可视化
仅仅证明您的硬件健康是不够的,您还必须证明通往互联网的路径是畅通的。
- 实施:使用路径可视化工具追踪流量,从接入层跨越局域网 (LAN),穿过分界点,并进入 ISP 网络。
- 成效:当延迟激增时,路径追踪会准确显示是哪个节点引入了延迟。如果第一到第四跳(您的管辖领域)显示 2 毫秒的延迟,而第五跳(ISP 边缘路由器)显示 150 毫秒的延迟 and 12% 的丢包率,您就有了可以提交给 ISP 的确凿证据。
3. 流数据与按需数据包捕获
当用户报告特定应用程序故障时,您需要会话级别的可见性。
- 实施:从核心交换机或防火墙导出 NetFlow 或 IPFIX 数据。确保您的接入层硬件支持远程、按需进行数据包捕获 (PCAP),而无需工程师亲临现场。
- 成效:流数据可以证明前往特定服务的流量是否正常离开您的网络。如果是,则说明网络是清白的。如果 d如果需要更深入的取证证明,在特定 VLAN 上进行针对性的 PCAP 可以提供 TCP 重传或服务器端重置的无可辩驳的证据。
4. 拓扑与依赖关系映射
在多租户环境中,隔离爆炸半径是分类故障的最快方法。
- 实施:维护一个实时、动态更新的依赖关系图,将每个 AP 连接到其交换机、上行链路和 WAN 电路,并与租户 VLAN 进行映射。
- 结果:如果故障影响了多个楼层的 AP,但仅限于单个交换机,则问题出在交换机上。如果它影响了所有 AP,但仅影响一个租户的 VLAN,则这是一个逻辑配置问题。快速确定范围可以避免在调查健康的基础设施上浪费精力。
5. 事件关联
没有上下文的数据会延长调查时间。
- 实施:将变更日志、ISP 维护警报、硬件固件更新和用户工单输入到单个时间线视图中。
- 结果:将身份验证失败的激增与 10 分钟前发生的 Microsoft Entra ID 证书过期事件进行叠加,可以立即确定根本原因,从而完全绕过网络硬件。
最佳实践
- 标准化硬件栈:将部署限制在主流企业级厂商(Cisco Meraki、HPE Aruba、Ruckus、Juniper Mist、Ubiquiti UniFi、Cambium、Extreme、Fortinet),这些厂商提供用于主动测试和远程 PCAP 的 API。
- 自动化证据收集:配置您的监控平台,在创建 ITSM 工单的瞬间自动将主动测试结果和路径跟踪附加到工单中。
- 共享仪表板:为物业经理提供对高级健康仪表板的只读访问权限。透明度可以预防推诿责任。
- 正式追踪 MTTI:测量从工单创建到您的团队提供“免责”证据之间的时间。将其与 MTTR 一起作为主要 KPI。
故障排除与风险缓解
- 风险:“未发现故障”循环:用户报告问题,但主动测试检查显示为绿色(正常)。
- 缓解措施:问题可能与特定设备相关,或与射频干扰(同频干扰或物理障碍)有关。使用客户端分析来检查特定设备的 RSSI 和漫游历史记录。
- 风险:ISP 否认:尽管您提供了证据,ISP 仍拒绝承认故障。
- 缓解措施:提供逐跳路径跟踪,显示开始丢包的确切 IP 地址。分享展示从您的分界点干净流出的 PCAP。铁证如山的数据会迫使问题升级到 1 级支持以上。
- 风险:Captive Portal 故障:当门户无法加载时,用户会归咎于 WiFi。
- 缓解措施:隔离身份提供商。检查集成状态(Microsoft Entra ID、Okta、Google Workspace)。如果网络允许预身份验证流量,但 IdP 超时,则网络是无辜的。
投资回报率 (ROI) 与业务影响
降低 MTTI 不仅能节省工程师的时间,还能带来可衡量的业务价值。
关键定义
Mean Time to Innocence (MTTI)
The average time required for a specific IT team to prove, using objective data, that their domain or infrastructure is not the root cause of a reported incident.
Critical for managed WiFi providers who must defend their service against property managers and ISPs.
Mean Time to Identify
The organisation-wide metric tracking the total time elapsed from incident detection to the discovery of the actual root cause.
MTTI is a subset of this metric. Reducing MTTI directly reduces the overall time to identify.
Synthetic Checks
Automated, continuous tests that emulate user traffic (e.g., DNS lookups, HTTP requests) to proactively monitor network health.
Used to prove the WiFi layer was functioning correctly at the exact moment a user complained.
Hop-by-Hop Path Visibility
Telemetry that traces network traffic node-by-node from the client to the destination, measuring latency and loss at each specific router or switch.
Essential for proving a fault lies in an ISP network or a landlord's distribution switch, rather than the managed WiFi hardware.
Flow Data (NetFlow/IPFIX)
Network protocol data that provides a summary of traffic conversations, showing source, destination, protocol, and volume.
Used to prove that specific application traffic is successfully leaving the local network.
On-Demand Packet Capture (PCAP)
The ability to remotely record raw network traffic from an access point or switch for forensic analysis.
The ultimate proof used to demonstrate server-side errors or client device misbehaviour.
Blast Radius
The scope of impact of a specific incident (e.g., one user, one AP, one switch, one tenant, or the entire building).
Determining the blast radius via topology mapping is the fastest way to exclude healthy infrastructure from an investigation.
Event Correlation
The practice of overlaying different data streams (logs, alerts, updates) on a single timeline to identify cause and effect.
Used to prove that a network outage was caused by a third-party change, such as an unannounced ISP maintenance window.
应用实例
A 350-room hotel reports that in-room WiFi is slow across the entire property. The front desk blames the managed WiFi provider. How do you exonerate the network and find the root cause?
- Check the synthetic probes: DNS and HTTP reachability tests show the APs have a clean connection to the internet. 2. Review the topology map: The issue affects all APs across all switches, ruling out edge hardware. 3. Execute a path trace: The trace shows 2ms latency within the hotel LAN, but 180ms latency at the third hop (the ISP's aggregation router). 4. Export the evidence: Send the path trace screenshot to the hotel manager and the ISP.
A national retailer reports point-of-sale (POS) terminals in one region are dropping connections to the payment processor. The network team is blamed for a firewall or routing misconfiguration.
- Isolate the blast radius: Confirm only POS terminals (specific VLAN) are affected; guest WiFi and back-office systems are healthy. 2. Analyse flow data: NetFlow confirms traffic destined for the payment processor's IP range is successfully leaving the store routers. 3. Capture packets: An on-demand PCAP on the POS VLAN reveals the payment processor's server is sending TCP resets (RST). 4. Share the PCAP with the payment processor's support team.
练习题
Q1. A tenant in a coworking space complains they cannot access their corporate VPN. Other tenants are browsing the internet without issue. What is the most efficient way to prove the WiFi network is not at fault?
提示:Consider the blast radius and the specific type of traffic failing.
查看标准答案
First, use the topology map to confirm the blast radius is limited to one user or one specific service, ruling out a general AP or switch failure. Second, analyse flow data (NetFlow/IPFIX) for that client's IP address. If the flow data shows the VPN traffic (e.g., UDP 500 or TCP 443) is leaving the network cleanly, the WiFi and LAN are innocent. The issue is either the client's VPN configuration or the corporate firewall blocking the connection.
Q2. Your monitoring dashboard shows an AP has gone offline, but the property manager insists the WiFi is broken because the ISP is down. How do you prove the issue is internal power, not the ISP?
提示:Look for correlation between infrastructure state and external events.
查看标准答案
Use event correlation and topology mapping. If the topology map shows only one AP is offline while others on the same switch are functioning, the ISP circuit is clearly active. Event correlation might show a PoE (Power over Ethernet) failure log from the switch port connected to that specific AP. This proves the issue is local hardware or cabling, not the WAN circuit.
Q3. A stadium operations director claims the WiFi failed during halftime because ticket scanners stopped working. You need to exonerate the network in under two minutes. What telemetry do you use?
提示:You need historical proof of health at the exact moment of the reported failure.
查看标准答案
Pull the historical data from the continuous synthetic checks. Show the operations director the dashboard confirming that during the exact 15-minute halftime window, the APs were successfully resolving DNS and reaching the ticketing server's IP address with low latency. This immediately proves the wireless network was healthy and shifts the investigation to the ticketing application servers, which likely buckled under the sudden load.
继续阅读本系列
SCEP 企业指南:部署简单证书注册协议以实现自动化校园 WiFi 安全
本技术参考指南为使用 SCEP 的企业 WiFi 证书部署提供了权威的架构蓝图和逐步实施策略。它涵盖了 SCEP 与 PKCS 之间的关键区别、成功部署所需的精确步骤顺序,以及面向 IT 领导者的实际风险规避策略。
为什么我的访客 WiFi 无法连接?Captive Portal 问题排查
本权威技术参考指南解释了 Captive Portal 检测的底层机制,并详细介绍了导致访客 WiFi 无法连接的六种主要故障模式。它为 IT 经理和网络架构师提供了一个实用的排查框架,以解决 HTTP 重定向问题、DNS 冲突和 MAC 随机化带来的挑战。
如何实施 SCEP 以实现自动化 WiFi 证书注册
本指南介绍了如何在企业场所实施 SCEP(简单证书注册协议)以实现自动化 WiFi 证书注册。它涵盖了完整的架构蓝图——从 PKI 设计和 MDM 集成到必不可少的三个步骤部署顺序——并向 IT 经理和网络架构师展示了如何在大规模场景下消除共享凭据、自动化证书生命周期管理,并满足 PCI DSS 和 GDPR 要求。