Logiciel d'étude WiFi : Comment cartographier et optimiser votre réseau sans fil
Ce guide fournit aux responsables informatiques et aux architectes réseau des stratégies concrètes pour utiliser un logiciel d'étude WiFi afin de cartographier, d'optimiser et de dépanner les réseaux sans fil d'entreprise. Il couvre les types d'études essentiels, les métriques RF critiques, les meilleures pratiques de déploiement et l'intégration des données d'étude avec l'analyse commerciale.
Écouter ce guide
Voir la transcription du podcast
Résumé Exécutif
Pour les établissements modernes, le réseau sans fil n'est plus une simple utilité informatique ; c'est l'infrastructure critique qui soutient la satisfaction des clients, l'efficacité opérationnelle et les flux de revenus numériques. Que vous gériez un hôtel de 200 chambres, un domaine commercial de 50 succursales ou un stade de grande envergure, s'appuyer sur des réseaux déployés sans validation rigoureuse constitue un risque opérationnel important.
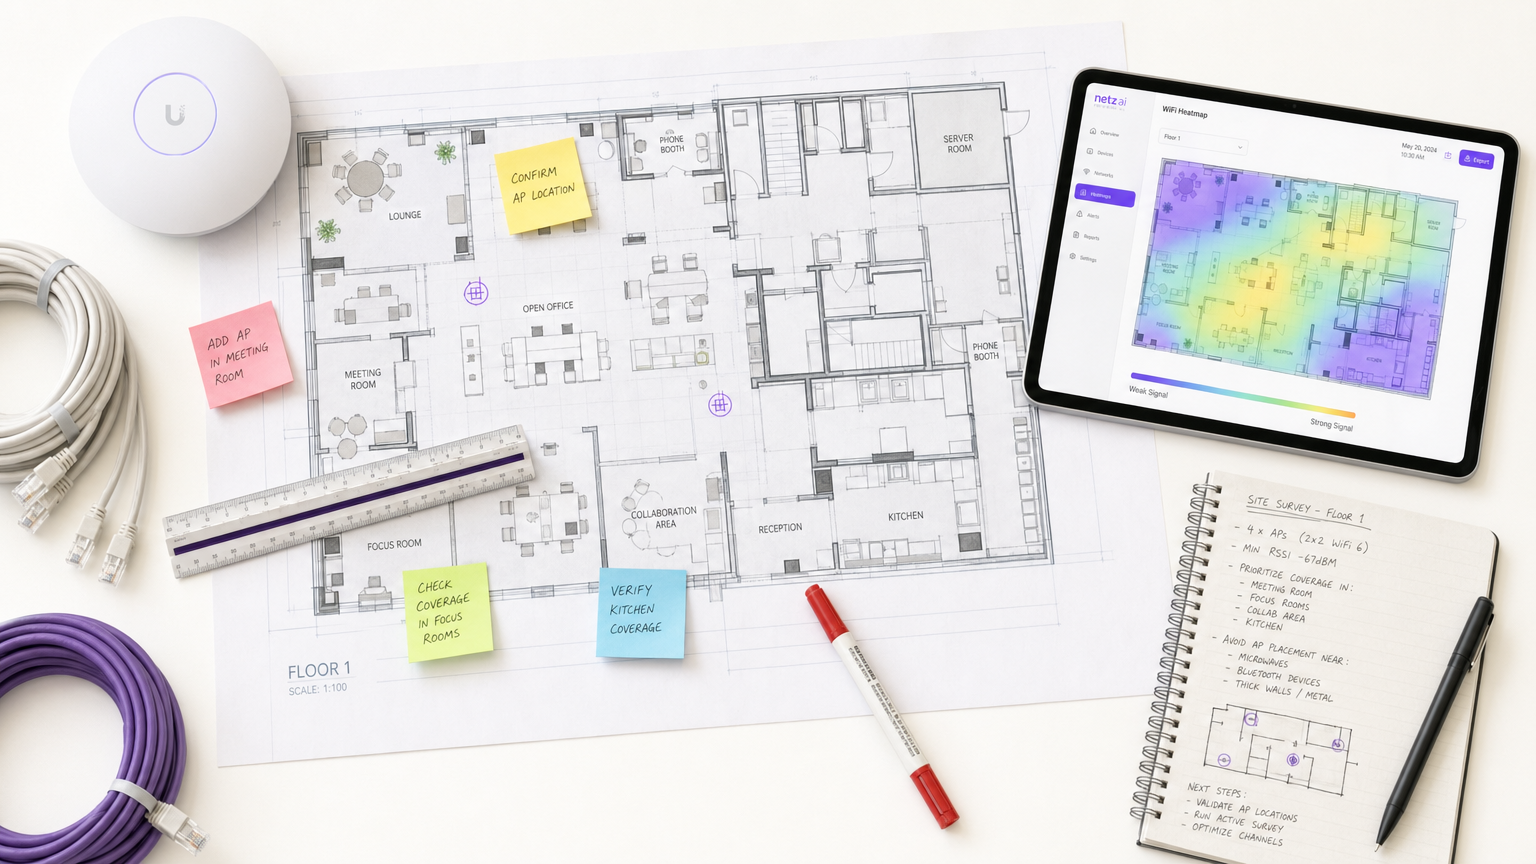
Le logiciel d'étude WiFi est l'outil essentiel pour atténuer ce risque. Il permet aux architectes réseau de mesurer, cartographier et modéliser l'environnement de radiofréquence (RF), traduisant la propagation invisible du signal en cartes thermiques exploitables. Ce guide décrit les mécanismes fondamentaux des études de site WiFi, détaille les métriques critiques requises pour les environnements à haute densité et fournit un cadre de mise en œuvre neutre vis-à-vis des fournisseurs pour garantir que votre infrastructure sans fil offre une connectivité cohérente et haute performance.
Approfondissement Technique
Le logiciel d'étude de site WiFi transforme les données RF brutes en cartes thermiques visuelles, permettant une ingénierie réseau précise. Comprendre les différents types d'études et les métriques qu'elles capturent est fondamental pour une conception de réseau efficace.
Types d'études WiFi
- Étude Passive : L'appareil d'étude écoute l'environnement RF sans s'associer à un point d'accès (AP). Il capture les trames balises, mesure l'indicateur de force du signal reçu (RSSI) sur tous les AP visibles et enregistre les données par rapport aux coordonnées du plan d'étage. Cela établit votre ligne de base et identifie les APs non autorisés ou les interférences externes.
- Étude Active : L'appareil d'étude se connecte au réseau pour effectuer des tests de débit réels (UDP et TCP). Cela mesure les débits de données réels, la perte de paquets et la latence. Les études actives sont non négociables pour les établissements prenant en charge des applications en temps réel telles que la vidéoconférence ou les réseaux de capteurs IoT.
- Étude Prédictive (Virtuelle) : À l'aide du logiciel, les ingénieurs importent un plan d'étage, définissent les matériaux de construction (par exemple, béton, verre) et attribuent des valeurs d'atténuation. Le logiciel modélise la propagation RF avant l'installation de tout matériel. Ceci est essentiel pour les déploiements greenfield afin d'éviter le sur- ou le sous-provisionnement.
Métriques RF Critiques
Pour assurer un déploiement robuste, votre étude doit évaluer les métriques suivantes :
- RSSI (Indicateur de Force du Signal Reçu) : Mesuré en dBm. Un minimum de -70 dBm est requis pour une connectivité générale, tandis que -67 dBm ou mieux est nécessaire pour les applications vocales et vidéo.
- Rapport Signal/Bruit (SNR) : La différence entre le niveau du signal et le bruit de fond. Un SNR minimum de 25 dB est requis pour un fonctionnement fiable, passant à 30 dB+ pour les environnements à haute densité.
- Utilisation du Canal : Mesure l'occupation d'un canal radio. Une forte puissance de signal avec une utilisation élevée du canal entraîne un faible débit en raison de la contention du temps d'antenne.
- Comportement d'Itinérance : Validation des transferts fluides entre les APs à l'aide des normes d'entreprise (IEEE 802.11r/k/v). Une mauvaise itinérance est une cause principale de déconnexions dans les environnements hôteliers et universitaires.
- Interférence Co-Canal (CCI) : Cellules de couverture qui se chevauchent sur le même canal. Le logiciel d'étude identifie ces conflits, permettant des ajustements de canal et de puissance de transmission.
Guide de Mise en Œuvre
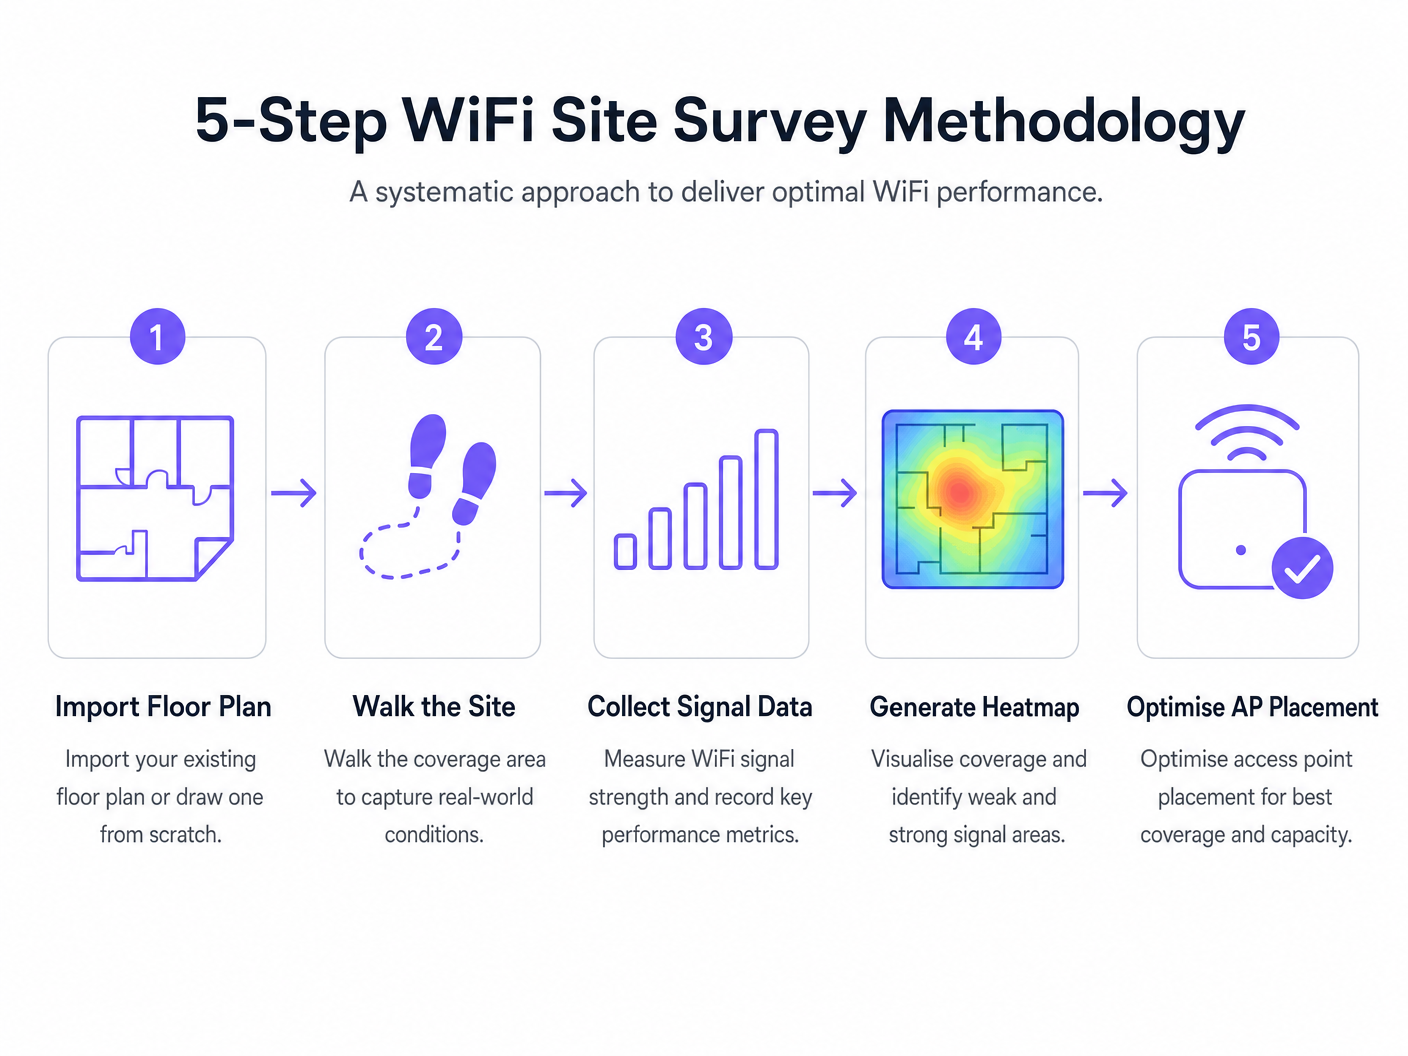
Le déploiement d'un réseau sans fil nécessite une approche systématique. La méthodologie suivante assure un placement optimal des APs et des performances réseau.
- Étude Prédictive Avant Déploiement : Effectuez toujours une étude prédictive avant d'acquérir le matériel. Se fier aux calculateurs génériques des fournisseurs ne tient souvent pas compte des ombres RF structurelles (par exemple, piliers en béton, cages d'ascenseur).
- Valider avec une Étude Active en Charge : Un lieu vide ne reflète pas la réalité opérationnelle. Menez des études actives sous une charge client simulée ou réelle pour mesurer les performances dans des scénarios à haute densité.
- Optimisation Itérative : Après le déploiement initial, utilisez des études actives et passives pour affiner le placement des APs, les attributions de canaux et la puissance de transmission.
- Intégration avec l'Analyse : Connectez vos données de performance RF aux plateformes de business intelligence. Superposer Guest WiFi et WiFi Analytics sur un réseau bien étudié vous permet de corréler la qualité du signal avec le temps de présence des visiteurs et l'affluence.
Bonnes Pratiques
- Tout Documenter : Un rapport d'étude est un document évolutif. Toute modification des emplacements des APs, des plans de canaux ou de la puissance de transmission doit être documentée et ré-étudiée pour maintenir une ligne de base précise.
- Tenir Compte de la Bande 6 GHz : À mesure que les déploiements évoluent vers le WiFi 6E et le WiFi 7, les méthodologies d'étude doivent prendre en compte le spectre 6 GHz, qui offre moins d'interférences mais une atténuation plus élevée (portée plus courte).
- Établir une Cadence d'Étude : Traitez les études de site comme une pratique opérationnelle continue. Les environnements RF changent en raison de nouveaux locataires, de modifications structurelles ou de changements d'occupation saisonniers. Les établissements à haute densité devraient adopter une cadence trimestrielle, tandis que les bureaux standards peuvent nécessiter des études annuelles.
Dépannage et Atténuation des Risques
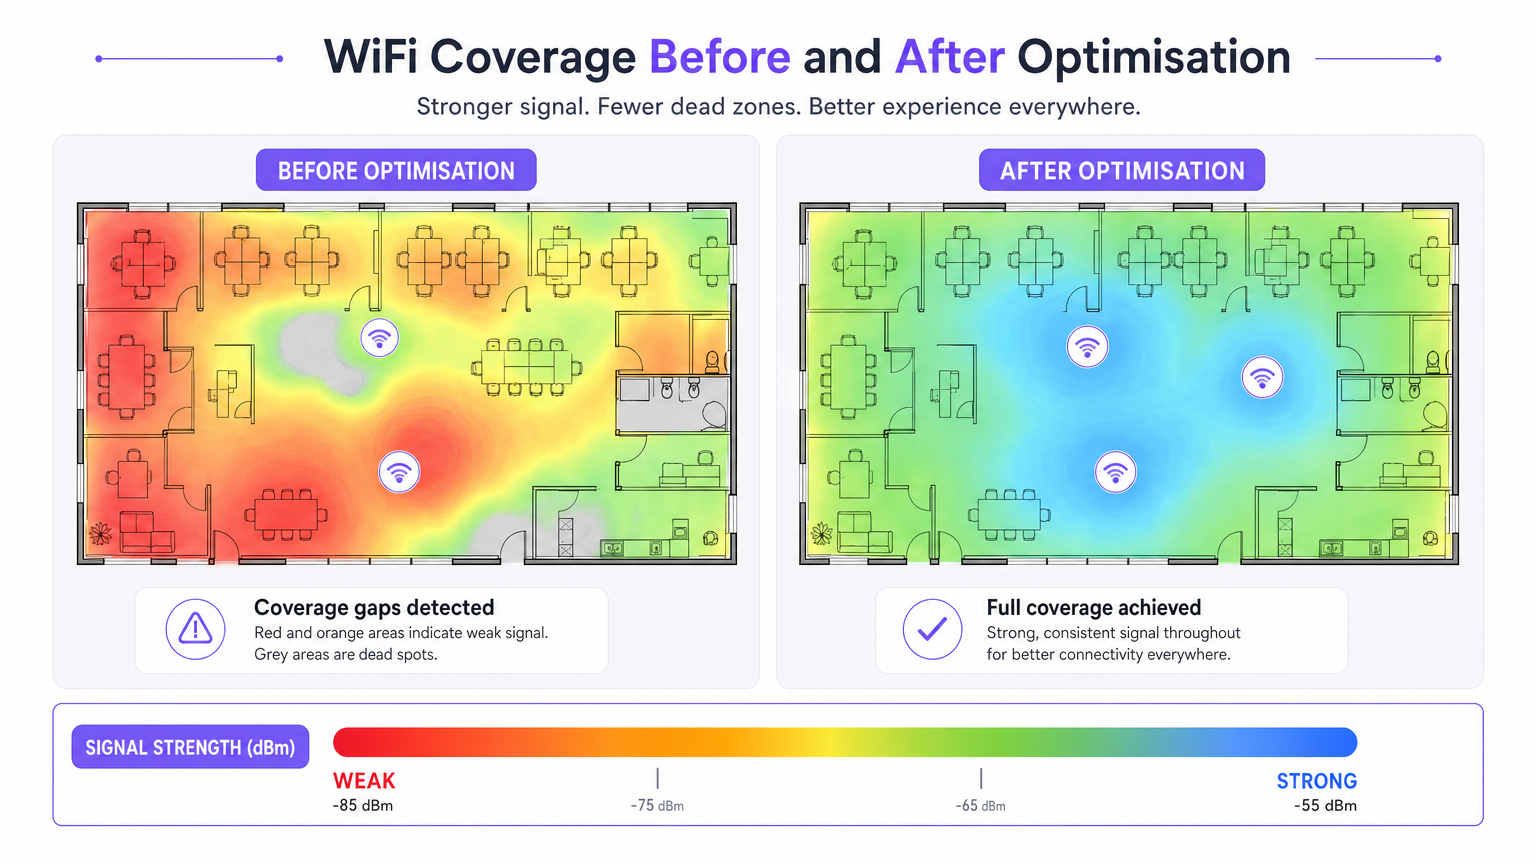
- Zones de Couverture (Points Morts) : Souvent causées par une atténuation structurelle imprévue. Atténuation : S'appuyer sur des études prédictives validées par des études passives post-déploiement.
- Interférences Élevées : Réseaux voisins ou appareils non-WiFi (par exemple, micro-ondes, Bluetooth) augmentant le niveau de bruit. Atténuation : Utilisez les outils d'analyse spectrale de votre logiciel d'enquête pour identifier et éviter les canaux encombrés.
- Clients Adhérents : Appareils refusant de se connecter à un AP plus proche. Atténuation : Validez la configuration 802.11r/k/v et assurez-vous que la puissance de transmission de l'AP n'est pas réglée trop haut, ce qui peut gonfler artificiellement la taille perçue de la cellule.
ROI et Impact Commercial
Le retour sur investissement d'un logiciel d'enquête WiFi professionnel se mesure en termes d'atténuation des risques et d'efficacité opérationnelle.
- Optimisation des Dépenses en Capital (CapEx) : Les études prédictives évitent le sur-provisionnement coûteux des APs et de l'infrastructure de commutation.
- Réduction des Dépenses Opérationnelles (OpEx) : Un réseau correctement étudié génère moins de tickets de support et nécessite moins de temps pour le dépannage.
- Activation des Revenus : Dans des secteurs comme le Commerce de Détail et l' Hôtellerie , un WiFi robuste soutient les stratégies d'engagement numérique, permettant des Analyses de la Fréquentation WiFi : Comment Mesurer et Agir sur les Données des Visiteurs et des campagnes marketing ciblées.
Définitions clés
RSSI (Received Signal Strength Indicator)
A measurement of the power level being received by the client device's antenna.
Used to determine if a device is close enough to an AP to maintain a stable connection. Measured in negative decibels (dBm).
SNR (Signal-to-Noise Ratio)
The difference between the received wireless signal strength and the background RF noise.
Crucial for determining data throughput. A high SNR means a clean signal capable of supporting high data rates.
Channel Utilisation
The percentage of time a specific WiFi channel is busy transmitting data or handling interference.
High utilisation leads to network congestion and slow speeds, even if the signal strength is excellent.
Co-Channel Interference (CCI)
Interference caused when two or more APs are transmitting on the exact same channel within hearing distance of each other.
Forces APs and clients to wait their turn to transmit, severely degrading network capacity.
Attenuation
The loss of signal strength as RF waves pass through physical obstacles like walls, doors, or human bodies.
Must be accurately modelled in predictive surveys to ensure adequate coverage post-installation.
Sticky Client
A wireless device that remains connected to an AP even when a closer, stronger AP is available.
Often caused by poor roaming configuration or AP transmit power being set too high.
Predictive Survey
A software-based simulation of RF coverage using a floor plan and defined building materials, performed before hardware installation.
Used to estimate the number and placement of APs required for a new deployment.
Active Survey
A site survey where the device connects to the network to measure actual data throughput, latency, and packet loss.
Essential for validating the real-world performance of the network for the end-user.
Exemples concrets
A 200-room hotel is experiencing frequent dropped WiFi calls when guests walk from the lobby to their rooms. The IT manager suspects a coverage issue, but the dashboard shows all APs are online.
- Conduct an active survey walking the exact path guests take from the lobby to the rooms.
- Monitor the roaming behaviour specifically looking for IEEE 802.11r (Fast BSS Transition) handoffs.
- Analyse the RSSI overlap between the lobby APs and the corridor APs.
- Adjust the transmit power of the lobby APs down slightly to encourage client devices to roam sooner, rather than 'sticking' to the lobby AP until the signal drops completely.
A large retail chain is rolling out a new inventory management system that relies on handheld scanners. They need to ensure seamless coverage across a 50,000 sq ft warehouse with high metal shelving.
- Perform a predictive survey importing the warehouse floor plan and explicitly defining the metal shelving as high-attenuation obstacles.
- Design the AP layout using directional antennas positioned down the aisles, rather than omnidirectional antennas that would bounce signals off the metal racks.
- Post-installation, conduct a passive survey to validate the coverage cell boundaries and ensure a minimum RSSI of -67 dBm in all aisles.
Questions d'entraînement
Q1. You are reviewing a site survey report for a new corporate office. The RSSI in the main boardroom is excellent (-55 dBm), but the SNR is only 12 dB. What is the likely impact on user experience, and what should be your next troubleshooting step?
Conseil : Consider the relationship between signal strength and background noise.
Voir la réponse type
Despite the strong signal, the low SNR (12 dB) indicates a high noise floor, likely due to interference. Users will experience slow speeds, dropped packets, and poor video call quality. The next step is to use a spectrum analyser to identify the source of the interference (e.g., a neighbouring network on the same channel, or non-WiFi devices) and change the AP's channel assignment.
Q2. A stadium deployment requires APs to be mounted 15 metres high in the roof structure. Should you use omnidirectional or directional antennas, and why?
Conseil : Think about how RF energy propagates from different antenna types over long distances.
Voir la réponse type
You should use directional antennas. Omnidirectional antennas broadcast energy in all directions (like a lightbulb), which would waste signal propagating upwards and cause massive co-channel interference across the stadium seating. Directional antennas focus the RF energy downwards into specific seating sectors (like a spotlight), increasing signal strength for users and reducing interference between APs.
Q3. During a post-installation active survey in a hospital, you notice that devices are not roaming smoothly between APs in the corridors, leading to dropped VoIP calls for nurses. What specific configuration should you verify on the wireless controller?
Conseil : Look for enterprise roaming standards.
Voir la réponse type
You should verify that IEEE 802.11r (Fast BSS Transition), 802.11k (Radio Resource Measurement), and 802.11v (BSS Transition Management) are enabled and supported by the client devices. Additionally, check that the AP transmit power is not set too high, which can create artificially large coverage cells and cause 'sticky clients'.
Continuer la lecture de cette série
Qu'est-ce qu'une requête de sonde (Probe Request) ? Comprendre comment les appareils découvrent les réseaux
Ce guide de référence technique offre une analyse approfondie des requêtes de sonde IEEE 802.11, de la distinction entre balayage actif et passif, et de l'impact de la randomisation MAC sur l'analyse des lieux. Il fournit des stratégies de mise en œuvre concrètes pour les architectes réseau afin d'optimiser les déploiements à haute densité, d'atténuer les tempêtes de sondes et d'assurer une collecte de données précise et conforme au GDPR en utilisant des couches d'identité authentifiées.
Comment réparer un WiFi lent sans améliorer votre forfait Internet
Un guide de référence technique complet pour les responsables informatiques et les architectes réseau sur l'optimisation des performances WiFi d'entreprise sans augmenter la bande passante de l'ISP. Couvre le réglage RF, la gestion de la densité des clients, la mise en œuvre de la QoS et comment exploiter les analyses WiFi pour diagnostiquer et résoudre les goulots d'étranglement.
La Checklist pour la Migration d'un NAC Hérité vers un NAC Cloud-Natif
Ce guide de référence technique faisant autorité fournit une checklist structurée en trois phases pour la migration d'un système de contrôle d'accès réseau (NAC) hérité vers une architecture cloud-native. Il dote les responsables informatiques et les architectes réseau de stratégies concrètes pour gérer l'intégration des identités, la parité des politiques et la conformité sans perturber les opérations des sites.