Qu'est-ce que l'analyse WiFi ? Un guide complet
Ce guide technique complet explique comment l'analyse WiFi transforme l'infrastructure réseau standard en un moteur d'intelligence économique, couvrant les mécanismes de capture de données (fréquentation, temps de présence, type d'appareil, visites répétées), les considérations architecturales et le ROI mesurable. Il est conçu pour les responsables informatiques, les architectes réseau et les directeurs des opérations de site qui doivent évaluer et déployer l'analyse WiFi dans des environnements d'entreprise.
Écouter ce guide
Voir la transcription du podcast
Résumé Exécutif
Pour les sites d'entreprise modernes, fournir du Guest WiFi n'est plus simplement un centre de coûts ou un service attendu — c'est une couche d'infrastructure critique pour l'intelligence économique. WiFi Analytics est le processus de capture, de traitement et de visualisation des données générées par les appareils se connectant à, ou sondant, un réseau sans fil. Pour les responsables informatiques, les architectes réseau et les directeurs des opérations de site, le déploiement d'une solution d'analyse robuste comble le fossé entre les dépenses informatiques et la valeur commerciale mesurable.
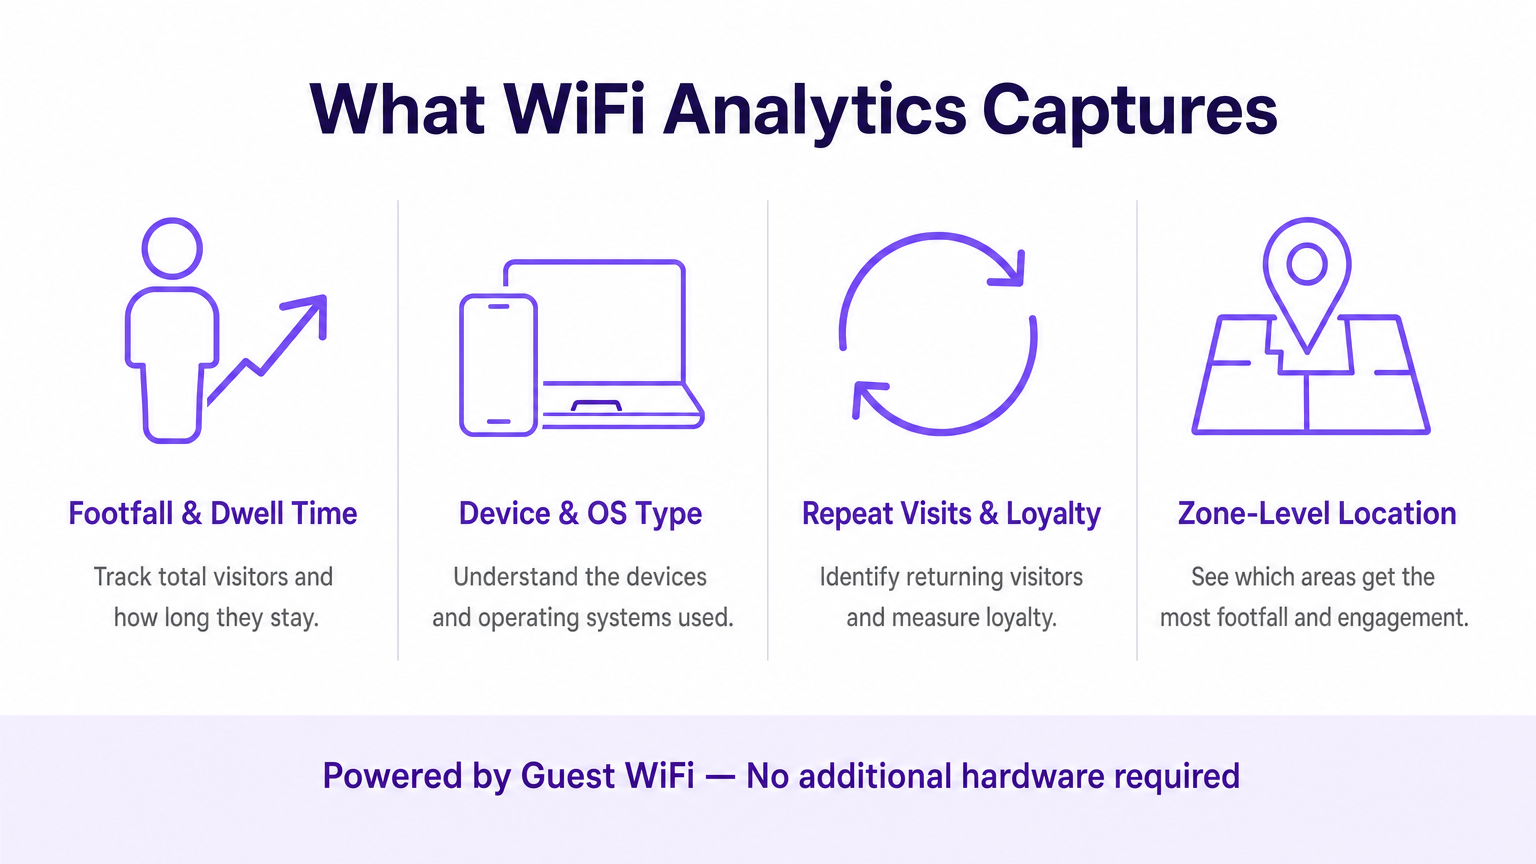
Ce guide détaille l'architecture technique de la collecte de données WiFi, les métriques spécifiques capturées — y compris le nombre de visiteurs, le temps de présence, le type d'appareil et les visites répétées — et les points d'intégration nécessaires pour transformer la télémétrie réseau brute en informations exploitables. En tirant parti de l'infrastructure existante, que ce soit pour un déploiement dans le Commerce de détail , la Santé , l' Hôtellerie ou le Transport , les organisations peuvent obtenir une visibilité approfondie des espaces physiques sans déployer de coûteux réseaux de capteurs superposés.
Plongée Technique : Comment fonctionne l'analyse WiFi
À la base, l'analyse WiFi repose sur le comportement fondamental des appareils clients 802.11. Même avant qu'un utilisateur ne s'authentifie à un réseau, son appareil diffuse des requêtes de sondage pour découvrir les points d'accès (APs) disponibles. Ces trames de gestion, combinées aux données générées lors des sessions authentifiées, constituent les deux principaux flux de données traités par une plateforme d'analyse WiFi.
Les Mécanismes de Capture de Données
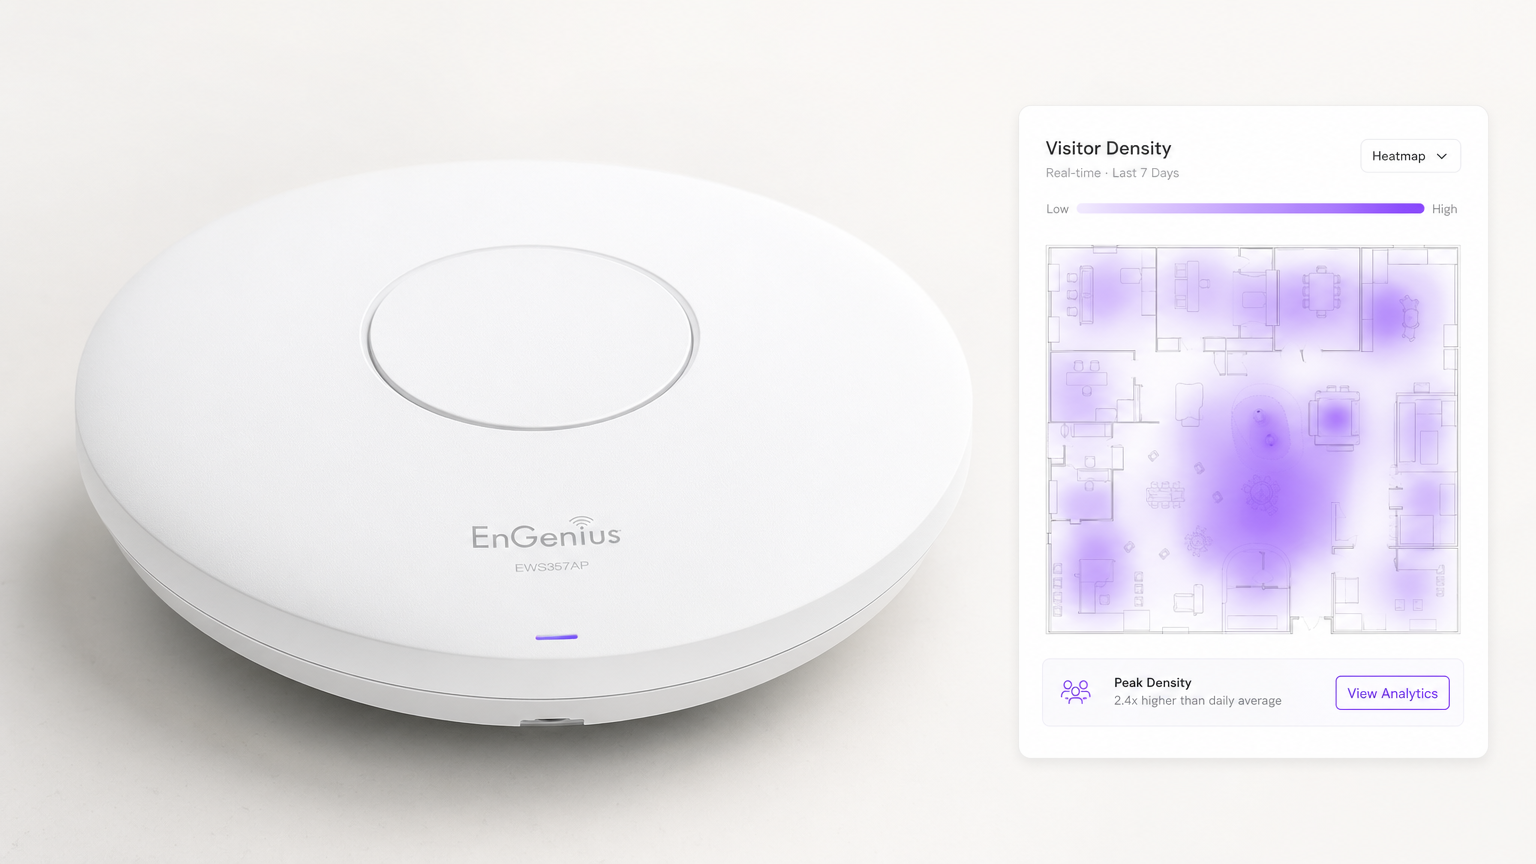
Analyse de Présence (Non Authentifiée) : Lorsqu'un smartphone a le WiFi activé, il envoie périodiquement des requêtes de sondage contenant son adresse MAC et la force de son signal (RSSI). Les points d'accès détectent ces sondes. En triangulant le RSSI sur plusieurs APs, le système calcule l'emplacement approximatif de l'appareil au sein d'un site. Cela fournit des métriques de base sur le nombre de visiteurs et la conversion — passants versus visiteurs actifs — sans nécessiter d'interaction de l'utilisateur.
Analyse Authentifiée : Lorsqu'un utilisateur se connecte activement au Captive Portal, le moteur d'analyse capture des données propriétaires riches. Cela inclut généralement des informations démographiques, des coordonnées et des identifiants CRM, comblant le fossé entre une adresse MAC anonyme et un profil client connu et persistant. C'est la couche de données qui permet le marketing personnalisé et les programmes de fidélité.
Services de Localisation (RTLS) : Les déploiements avancés utilisent des techniques telles que la différence de temps d'arrivée (TDOA) ou la mesure de temps fine (802.11mc/802.11az) pour fournir un positionnement intérieur très précis, souvent augmenté par des balises Bluetooth Low Energy (BLE). Pour une analyse détaillée de ces technologies de positionnement, consultez notre Guide des systèmes de positionnement intérieur : UWB, BLE et WiFi .
Architecture et Intégration
L'architecture implique généralement du matériel périphérique — contrôleurs de réseau local sans fil et APs — transmettant les données de télémétrie via API ou syslog à un moteur d'analyse basé sur le cloud. La plateforme ingère ce flux de données à haute vitesse, le normalise et applique des algorithmes de cartographie spatiale aux plans d'étage téléchargés pour produire des analyses par zone.
Il est crucial que le système s'intègre parfaitement à la pile de fournisseurs de réseau existante. Que vous évaluiez Purple vs Cisco Spaces (DNA Spaces) : Quand choisir chacun ou que vous déployiez sur Aruba, Ruckus ou Meraki, la plateforme d'analyse agit comme une surcouche — extrayant de la valeur sans nécessiter de remplacement matériel. C'est une distinction fondamentale par rapport aux solutions propriétaires basées sur des capteurs.
Le pipeline de données suit ce flux : Les APs capturent les requêtes de sondage et les événements de connexion → le contrôleur WLAN agrège et transmet la télémétrie → le moteur d'analyse normalise et cartographie les données → le tableau de bord présente les informations aux équipes opérationnelles et marketing → les webhooks API poussent les profils d'utilisateurs authentifiés vers les plateformes CRM et d'automatisation marketing.
Normes et Considérations de Conformité
Les déploiements doivent tenir compte de plusieurs normes réglementaires et techniques :
| Norme | Pertinence |
|---|---|
| IEEE 802.11ax (Wi-Fi 6/6E) | Fournit les fonctionnalités OFDMA et BSS Colouring qui améliorent la densité des AP et la précision de la localisation |
| IEEE 802.11mc / 802.11az | La mesure de temps fine (FTM) permet une précision de portée sub-métrique pour les déploiements RTLS |
| WPA3-Enterprise | Obligatoire pour les déploiements traitant des données sensibles ; fournit un mode de sécurité 192 bits |
| GDPR / UK GDPR | Exige un consentement explicite et vérifiable avant de capturer des données personnelles via le Captive Portal |
| PCI DSS | Le trafic Guest WiFi doit être isolé des réseaux de cartes de paiement via des VLAN dédiés |
| CCPA | S'applique aux déploiements desservant les résidents de Californie ; exige des mécanismes de désinscription |
Guide d'Implémentation
Le déploiement d'une solution d'analyse WiFi nécessite une coordination minutieuse entre l'ingénierie réseau et les parties prenantes commerciales. Les étapes suivantes représentent un cadre de déploiement indépendant du fournisseur.
Étape 1 — Évaluation de la Préparation du Réseau : Évaluez la densité et le placement actuels des AP par rapport aux exigences d'analyse de localisation. Une conception de couverture standard (APs centrés dans les pièces) est insuffisante pour une triangulation précise. Le placement des AP en périphérie est essentiel. Menez une étude de site active à l'aide d'outils tels qu'Ekahau ou iBwave pour identifier les zones mortes RF et les sources d'interférences.
Étape 2 — Cartographie des plans d'étage : Téléchargez des plans d'étage précis et mis à l'échelle sur la plateforme d'analytics. Définissez des zones qui correspondent aux objectifs commerciaux — par exemple, 'Zone de caisse', 'Zone de tête de gondole promotionnelle' ou 'Hall d'entrée'. Une mise à l'échelle imprécise des plans d'étage est l'une des causes les plus courantes de mauvaise qualité des données de localisation.
Étape 3 — Configuration du Captive Portal : Concevez le flux d'authentification pour équilibrer l'expérience utilisateur et l'acquisition de données. Mettez en œuvre des options de connexion sociale (Google, Apple ID) pour réduire les frictions. Assurez-vous que le portail est entièrement réactif sur tous les types d'appareils. Purple peut agir comme fournisseur d'identité pour OpenRoaming sous la licence Connect, permettant un onboarding fluide pour les utilisateurs récurrents sans interactions répétées avec le portail.
Étape 4 — Cadre de consentement et de confidentialité : Mettez en œuvre une capture de consentement conforme au GDPR. Le consentement doit être granulaire (opt-ins séparés pour l'analytics, le marketing et le partage avec des tiers), explicite (pas de cases pré-cochées) et auditable (enregistrements horodatés stockés par profil utilisateur).
Étape 5 — Intégration des données : Configurez les webhooks et les intégrations REST API pour pousser les données utilisateur authentifiées vers les plateformes CRM (Salesforce, HubSpot) et les outils d'automatisation du marketing (Marketo, Klaviyo). Cette étape est celle où le déploiement IT permet directement le ROI marketing et est fréquemment dépriorisée — ne la laissez pas l'être.
Étape 6 — Alertes et rapports : Configurez des alertes opérationnelles (par exemple, des seuils de temps de présence déclenchant des notifications au personnel) et des rapports automatisés pour les parties prenantes non techniques. Les données qui restent dans un tableau de bord IT ne génèrent aucune valeur commerciale.
Bonnes Pratiques
Atténuation de la randomisation MAC : Les systèmes d'exploitation modernes (iOS 14+, Android 10+) utilisent des adresses MAC randomisées par réseau. Les plateformes d'analytics doivent s'appuyer sur des sessions authentifiées et des algorithmes de rapprochement comportemental plutôt que sur des adresses matérielles persistantes pour le suivi des visiteurs récurrents. Priorisez les taux d'authentification du Captive Portal comme KPI.
Densité des AP pour la précision de la localisation : Un minimum de trois AP avec une couverture superposée est requis pour une triangulation de base. Pour une précision inférieure à 3 mètres, déployez des AP à des intervalles de 8 à 10 mètres dans les zones à forte valeur ajoutée. Pour un RTLS sub-mètre, complétez avec des balises BLE ou déployez du matériel compatible 802.11az.
Segmentation du réseau : Isolez le trafic Guest WiFi des réseaux d'entreprise et de paiement à l'aide de VLAN dédiés, d'ACL de pare-feu et de filtrage DNS. Ceci est non négociable pour la conformité PCI DSS et réduit considérablement la surface d'attaque.
Gouvernance des données : Établissez une politique claire de rétention des données. La plupart des cas d'utilisation d'analytics sont bien servis par 13 mois de données (permettant une comparaison d'une année sur l'autre). Des périodes de rétention plus longues augmentent le risque de conformité et les coûts de stockage sans avantage analytique proportionnel.
Dépannage et atténuation des risques
Données de localisation imprécises : Le plus souvent causées par une densité d'AP insuffisante, une mise à l'échelle incorrecte du plan d'étage ou des interférences RF provenant de réseaux adjacents. Validez le placement des AP par rapport à l'étude de site, vérifiez l'échelle du plan d'étage dans la plateforme d'analytics et utilisez les outils d'analyse spectrale de votre contrôleur WLAN pour identifier les sources d'interférences.
Faibles taux d'authentification : Si les visiteurs ne complètent pas le Captive Portal, auditez le parcours utilisateur. Mesurez le taux d'abandon à chaque étape. Les causes courantes incluent des temps de chargement lents du portail (optimisez pour le mobile sur les connexions de secours 3G/4G), des champs de données excessifs et des propositions de valeur peu claires. Effectuez des tests A/B sur la conception du portail.
Silos de données : Le mode de défaillance le plus dommageable commercialement. Créez de manière proactive des rapports automatisés pour les équipes opérationnelles et marketing. Établissez un groupe de travail interfonctionnel 'Données WiFi' avec des représentants de l'IT, du marketing et des opérations pour examiner les insights mensuellement.
Verrouillage fournisseur : Évitez les plateformes d'analytics qui nécessitent du matériel propriétaire. Assurez-vous que la plateforme prend en charge votre fournisseur d'AP existant via des API standard et peut exporter des données dans des formats ouverts (CSV, JSON) pour éviter la dépendance à l'écosystème d'un seul fournisseur.
ROI et impact commercial
La mesure ultime d'un déploiement d'analytics WiFi est sa contribution aux résultats commerciaux. Le cadre suivant associe les capacités d'analytics à des KPI mesurables.
| Capacité d'analytics | KPI Commercial | Amélioration typique |
|---|---|---|
| Comptage de l'affluence | Suivi du volume de visiteurs | Remplace le comptage manuel ; précision de 99 % et plus |
| Temps de présence par zone | Gestion des files d'attente, allocation du personnel | Réduction de 15 à 25 % des temps d'attente aux heures de pointe |
| Taux de visites répétées | Mesure de la fidélité client | Base de référence pour le ROI du programme de fidélité |
| Taux de conversion spatiale | Conversion vitrine-magasin | Informe l'investissement dans l'affichage extérieur |
| Profils authentifiés | Enrichissement CRM, ciblage de campagnes | Amélioration de 3 à 5 fois de la pertinence des campagnes email |
| Analyse des flux de zones | Optimisation de l'agencement | Augmentation mesurable des dépenses secondaires |
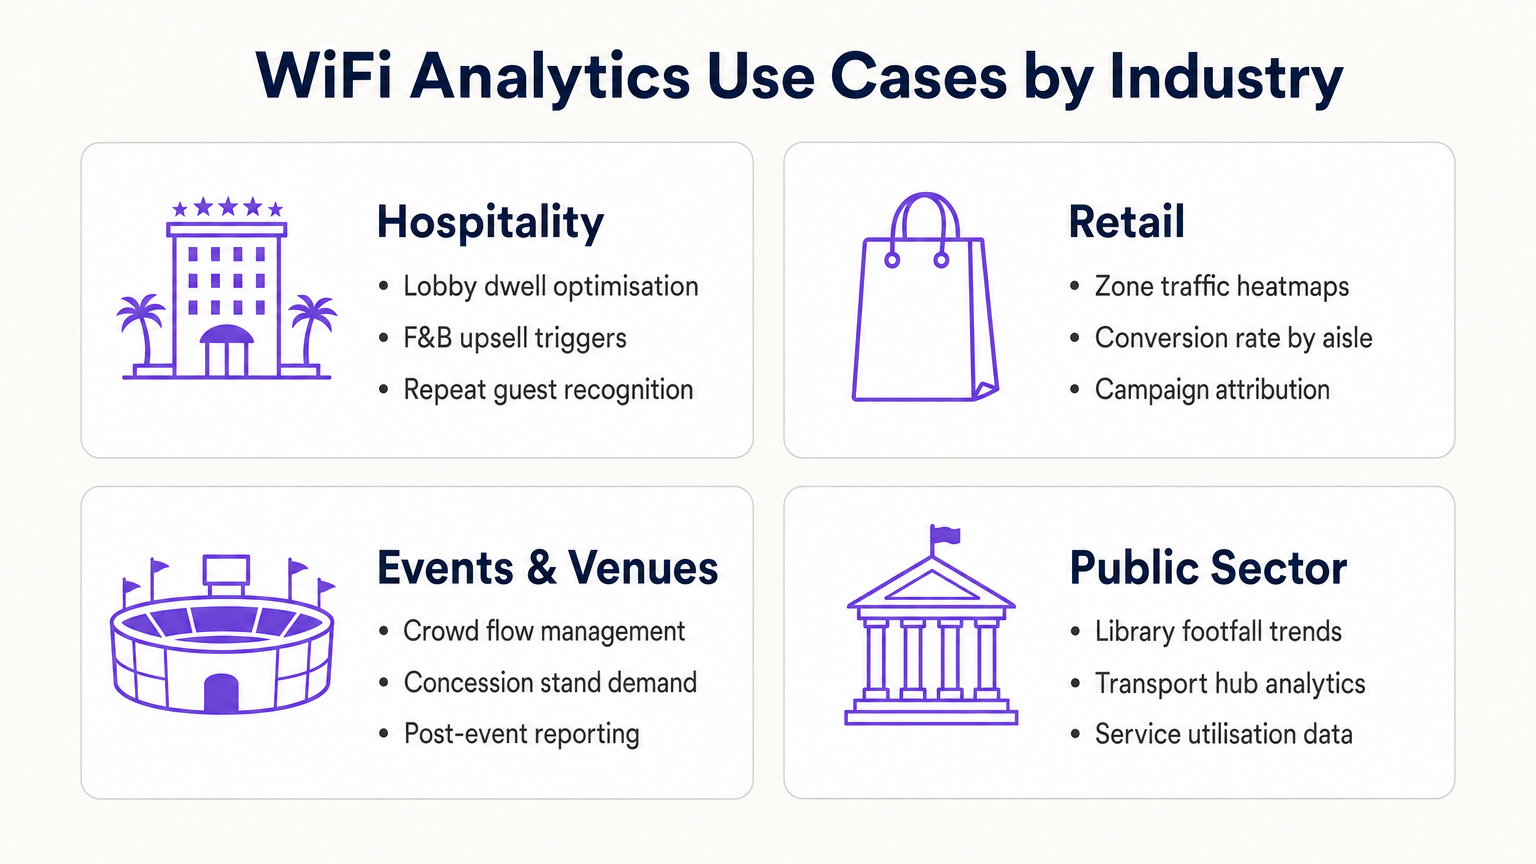
Pour les opérateurs de l' Hôtellerie , l'analytics WiFi permet la reconnaissance des clients récurrents, la gestion de la congestion du hall et les déclencheurs de vente incitative F&B. Pour les chaînes de Commerce de détail , il offre une optimisation de l'agencement basée sur les cartes thermiques et l'attribution des campagnes. Pour les pôles de transport et les lieux du secteur public, il fournit des données d'utilisation des services et la gestion des flux de foule. Pour un aperçu détaillé des applications des lieux connectés, consultez notre Architecture de l'Internet des Objets : Un Guide Complet .
En traitant le réseau WiFi comme un actif de données stratégique plutôt qu'une simple utilité, les leaders IT passent du statut de gestionnaires de centres de coûts à celui de facilitateurs commerciaux — générant un ROI concret grâce à une efficacité opérationnelle accrue, un engagement client amélioré et une prise de décision basée sur des preuves.
Définitions clés
Probe Request
An 802.11 management frame broadcast by a client device to discover available wireless networks in its vicinity, containing the device's MAC address and supported data rates.
The foundational mechanism for unauthenticated presence analytics. Access points capture these frames to detect and locate devices before any user interaction occurs.
RSSI (Received Signal Strength Indicator)
A measurement of the power level of a received radio signal, expressed in dBm (typically ranging from 0 to -100 dBm).
Analytics platforms use RSSI readings from multiple APs simultaneously to triangulate a device's physical location. Lower (more negative) values indicate greater distance from the AP.
MAC Address Randomisation
A privacy feature in modern operating systems (iOS 14+, Android 10+) that assigns a randomised hardware address to a device on a per-network basis, replacing the device's permanent MAC address.
Significantly limits the reliability of unauthenticated presence analytics for repeat visitor tracking, making captive portal authentication essential for building persistent customer profiles.
Captive Portal
A web-based authentication interface that intercepts a user's HTTP/HTTPS traffic and redirects them to a login or registration page before granting network access.
The primary mechanism for capturing first-party customer data and securing GDPR-compliant consent. Portal design and friction level directly determine data capture rates.
Dwell Time
The duration a specific authenticated or detected device remains within a defined physical zone, measured from first detection to last detection within that zone.
A critical operational metric used to identify queue congestion, measure engagement with promotional displays, and trigger time-based marketing automations.
Footfall
The total count of unique devices detected within a defined venue or zone over a specified time period.
Provides the baseline traffic metric analogous to website sessions. Used to measure overall venue performance, compare locations, and calculate spatial conversion rates.
Spatial Conversion Rate
The percentage of devices detected in an outer zone (e.g., a street or main walkway) that subsequently enter an inner zone (e.g., a store or aisle).
Used by retail operators to evaluate the effectiveness of exterior displays and entrance signage. A low conversion rate despite high footfall indicates an attraction problem at the threshold.
OpenRoaming
A Wireless Broadband Alliance (WBA) federation standard that enables seamless, secure Wi-Fi onboarding across participating networks without requiring repeated captive portal interactions.
Purple can act as an identity provider for OpenRoaming under the Connect licence, enabling venues to offer seamless connectivity while retaining the ability to capture analytics data from returning users.
RTLS (Real-Time Location System)
A system that uses radio frequency technologies (WiFi, BLE, UWB, or RFID) to determine and track the real-time location of objects or people within a defined space.
Relevant when sub-3-metre location accuracy is required — for example, asset tracking in healthcare or turn-by-turn indoor navigation in large venues. Standard WiFi RSSI triangulation is typically insufficient for these use cases.
TDOA (Time Difference of Arrival)
A location technique that calculates position by measuring the difference in the time a signal arrives at multiple reference points (APs or anchors).
Provides significantly higher location accuracy than RSSI-based triangulation, but requires hardware support and precise clock synchronisation across APs.
Exemples concrets
A 400-room resort hotel wants to reduce congestion at check-in desks during peak hours (15:00–17:00) and increase revenue at the lobby bar. The IT team has a Cisco Meraki deployment with 24 APs across the ground floor.
- Map the lobby floor plan in the analytics platform with three distinct zones: 'Check-In Queue', 'Lobby Seating', and 'Bar Area'. Verify that at least three APs provide overlapping coverage in each zone for accurate triangulation.
- Configure a real-time operational alert: if the device count in the 'Check-In Queue' zone exceeds 20 simultaneously AND average dwell time exceeds 15 minutes, trigger an automated SMS to the Duty Manager via the platform's webhook integration.
- Configure a marketing trigger: if a device dwells in the 'Lobby Seating' zone for more than 10 minutes, push a personalised notification (via the captive portal session or email if authenticated) offering a 10% discount at the bar, valid for 30 minutes.
- Integrate the authenticated user profiles with the hotel PMS (Property Management System) to automatically recognise returning guests and suppress the captive portal for them, surfacing a personalised welcome message instead.
- Review weekly dwell time reports to identify whether the check-in queue alert is triggering at consistent times, enabling proactive staffing adjustments rather than reactive responses.
A 50-store retail chain has deployed WiFi analytics across all locations. The Head of Merchandising reports that a specific promotional aisle in their flagship Manchester store generates high footfall but below-average sales per square foot. They want to understand why before rolling out the same layout to 15 other stores.
- Define two zones in the analytics platform for the Manchester store: 'Main Walkway' (the primary traffic artery adjacent to the aisle) and 'Promotional Aisle' (the target zone).
- Pull a 30-day report comparing: (a) the spatial conversion rate — the percentage of devices in the Main Walkway that subsequently enter the Promotional Aisle — and (b) the average dwell time within the Promotional Aisle for devices that do enter.
- Scenario A — High conversion, low dwell time: Visitors are entering the aisle but leaving quickly. This indicates the product placement or signage within the aisle is confusing or unappealing once inside. Recommendation: redesign the aisle layout and test with a 14-day A/B comparison.
- Scenario B — Low conversion despite high walkway traffic: Visitors are not being drawn into the aisle from the walkway. This indicates the end-cap display or entrance signage is ineffective. Recommendation: redesign the entrance display and measure conversion rate change over the following 14 days.
- Correlate the WiFi analytics data with POS transaction data by time-of-day to identify whether dwell time correlates with purchase probability, establishing a venue-specific 'engagement threshold' for future campaign design.
Questions d'entraînement
Q1. A retail client reports that their 'Repeat Visitor' metric has dropped by 40% over the past eight months, despite sales remaining steady and no significant change in marketing activity. Their analytics deployment relies entirely on unauthenticated presence tracking. What is the most likely technical cause, and what is the recommended remediation?
Conseil : Consider the timeline of major mobile OS updates and their privacy features.
Voir la réponse type
The most likely cause is the progressive adoption of MAC address randomisation across the client's customer base. iOS 14 (released September 2020) and Android 10+ introduced per-network MAC randomisation, causing returning devices to appear as new, unique visitors to presence analytics engines. As the proportion of customers running these OS versions has increased, the repeat visitor metric has degraded. The remediation is to implement a captive portal authentication layer. When users authenticate with a persistent identifier (email address, social login), the analytics platform can build a customer profile tied to that identifier rather than the rotating MAC address. This restores repeat visitor tracking accuracy and simultaneously generates first-party marketing data.
Q2. You are the network architect for a new 80,000-seat stadium. The venue operations team wants WiFi analytics to manage crowd flow through concourse areas and identify concession stand congestion in real time. The IT budget allows for 400 APs. How should you prioritise AP placement to maximise analytics accuracy, and what accuracy level can you realistically expect?
Conseil : Think about the geometric requirements of triangulation and the difference between coverage and analytics design principles.
Voir la réponse type
Prioritise perimeter placement over central coverage. For each concourse zone, ensure APs are placed at the zone boundaries rather than the centre. This enables the analytics engine to accurately determine when a device crosses from one zone to another. Aim for a minimum of three APs with overlapping coverage in each defined zone, with AP spacing of 8–10 metres in high-priority areas (concession stands, entry/exit gates). With standard RSSI triangulation on 802.11ax hardware, expect 3–5 metre location accuracy in open concourse areas. For sub-3-metre accuracy at specific chokepoints (e.g., individual concession windows), supplement with BLE beacons or deploy 802.11az-capable APs at those locations.
Q3. A hospital IT director wants to use the existing WiFi network to track the location of 200 high-value mobile medical assets (infusion pumps, portable ECG monitors). They do not want to deploy any additional hardware. The analytics platform currently provides 5-metre RSSI triangulation accuracy. Is this deployment viable, and what are the key risks?
Conseil : Consider both the technical accuracy requirements and the behaviour of the devices being tracked.
Voir la réponse type
This deployment is not reliably viable for two reasons. First, medical equipment frequently enters low-power or sleep states, causing the device to stop broadcasting WiFi probe requests. When a device is not actively probing, it is invisible to the presence analytics engine. This creates gaps in tracking that are unacceptable for asset management. Second, 5-metre RSSI accuracy is insufficient to determine whether an asset is in Room 4A or Room 4B in a typical hospital ward layout. The recommended alternative is a dedicated RTLS solution using active RFID tags or BLE beacons attached to the assets, which actively broadcast at regular intervals regardless of the asset's power state, and which can achieve sub-2-metre accuracy. The existing WiFi infrastructure can serve as the receiver network for BLE beacons, avoiding the need for a completely separate sensor network.
Continuer la lecture de cette série
Confidentialité dès la conception : Anonymisation des données WiFi pour la conformité au GDPR
Ce guide de référence détaille l'architecture technique et les stratégies de mise en œuvre pour anonymiser les données WiFi afin d'assurer la conformité au GDPR. Il fournit aux leaders informatiques et aux architectes réseau des cadres d'action pour équilibrer des analyses de site robustes avec des exigences strictes en matière de confidentialité des données.
Cartographie thermique vs Analyse de présence : Différences techniques
Ce guide technique de référence détaille les différences architecturales et opérationnelles cruciales entre la cartographie thermique WiFi et l'analyse de présence pour les opérateurs de sites d'entreprise. Il fournit aux responsables informatiques, aux architectes réseau et aux directeurs des opérations des cadres de déploiement exploitables, des scénarios de mise en œuvre réels et des meilleures pratiques indépendantes des fournisseurs pour maximiser le retour sur investissement de leur infrastructure sans fil existante.
Comment calculer le temps de présence à l'aide de WiFi Location Analytics
Ce guide fournit une référence technique complète pour le calcul du temps de présence WiFi à l'aide de WiFi location analytics, couvrant l'architecture complète de la capture des requêtes de sondage 802.11 en passant par la trilatération basée sur le RSSI jusqu'à l'analyse des zones géorepérées. Il est destiné aux responsables informatiques, aux architectes réseau et aux directeurs des opérations de site qui doivent déployer une intelligence de localisation précise et évolutive dans les environnements de la vente au détail, de l'hôtellerie, de la santé et du secteur public. Les lecteurs obtiendront des conseils de mise en œuvre exploitables, des études de cas réelles et un cadre clair pour traduire les données spatiales brutes en résultats commerciaux mesurables.