Mean time to innocence: come dimostrare che non è colpa del WiFi
Il Mean time to innocence (MTTI) è la metrica fondamentale che definisce quanto tempo i team IT dedicano a dimostrare che un problema di rete non è colpa loro. Questa guida illustra una metodologia di osservabilità in cinque passaggi per eliminare il rimpallo di responsabilità negli ambienti multi-tenant, sostituendo le accuse reciproche con prove condivise per ridurre il tempo medio di risoluzione (MTTR).
Ascolta questa guida
Visualizza trascrizione del podcast
📚 Part of our core series: WiFi multi-tenant: la guida completa →
Executive Summary
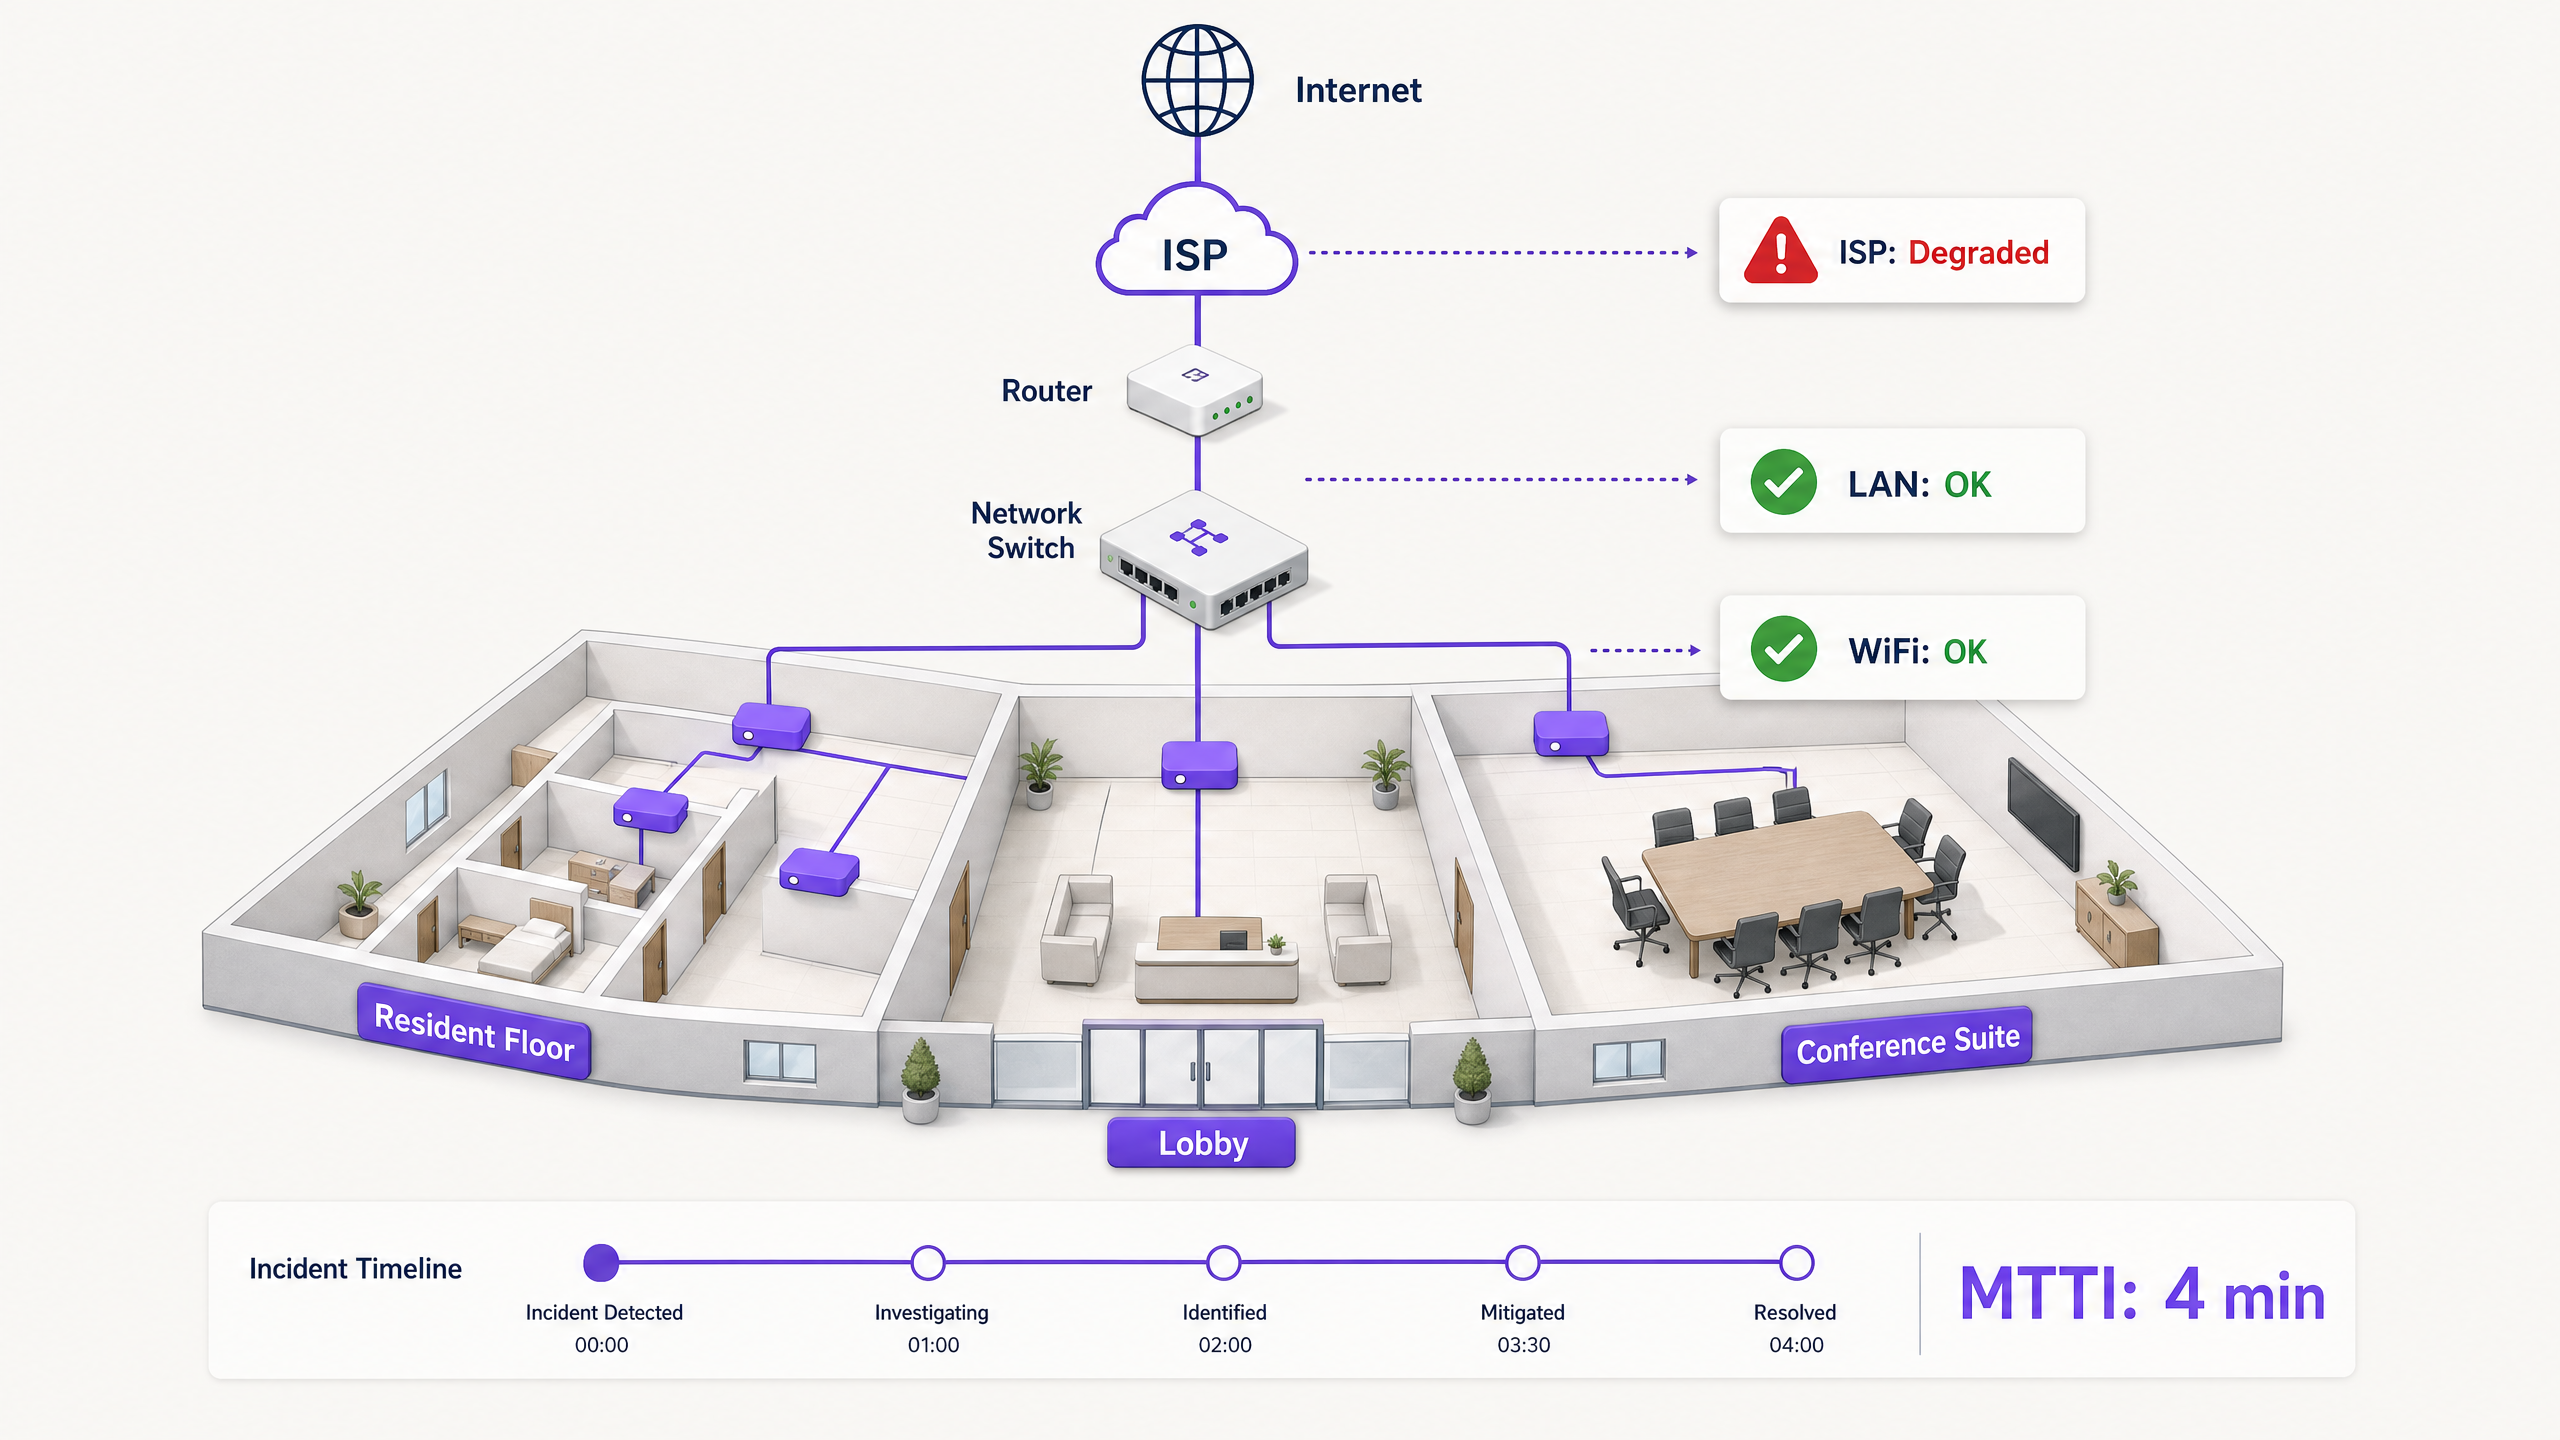
Quando la connettività si interrompe in un ambiente multi-tenant, il WiFi è il primo a essere colpevolizzato. Rappresenta il perimetro visibile della rete, l'ultimo miglio prima del dispositivo e il bersaglio più facile per gli utenti frustrati. Per i responsabili IT, gli architetti di rete e i direttori operativi delle strutture, ciò si traduce in un costo operativo costante: il tempo speso a dimostrare la propria innocenza.
Il Mean time to innocence (MTTI) misura il tempo medio che intercorre tra la segnalazione di un incidente e la capacità di un team di dimostrare che il proprio dominio non ne è la causa principale. In ambienti complessi come i complessi residenziali build-to-rent (BTR), gli hotel o i centri congressi, la rete è frammentata tra gestori immobiliari, fornitori di WiFi gestito e fornitori di servizi internet (ISP). Senza una telemetria definitiva, l'MTTI fa lievitare il tempo medio di risoluzione (MTTR), poiché i team discutono sulle responsabilità anziché risolvere il guasto.
Questa guida descrive in dettaglio una metodologia di osservabilità in cinque passaggi per ridurre sistematicamente l'MTTI. Implementando controlli sintetici continui, visibilità del percorso hop-by-hop, analisi dei dati di flusso, mappatura della topologia e correlazione degli eventi, è possibile sostituire il rimpallo di responsabilità con prove condivise. L'obiettivo non è vincere più velocemente il gioco delle colpe, ma porvi fine del tutto.
Technical Deep-Dive: The Mechanics of MTTI
The Distinction Between MTTI and Mean Time to Identify
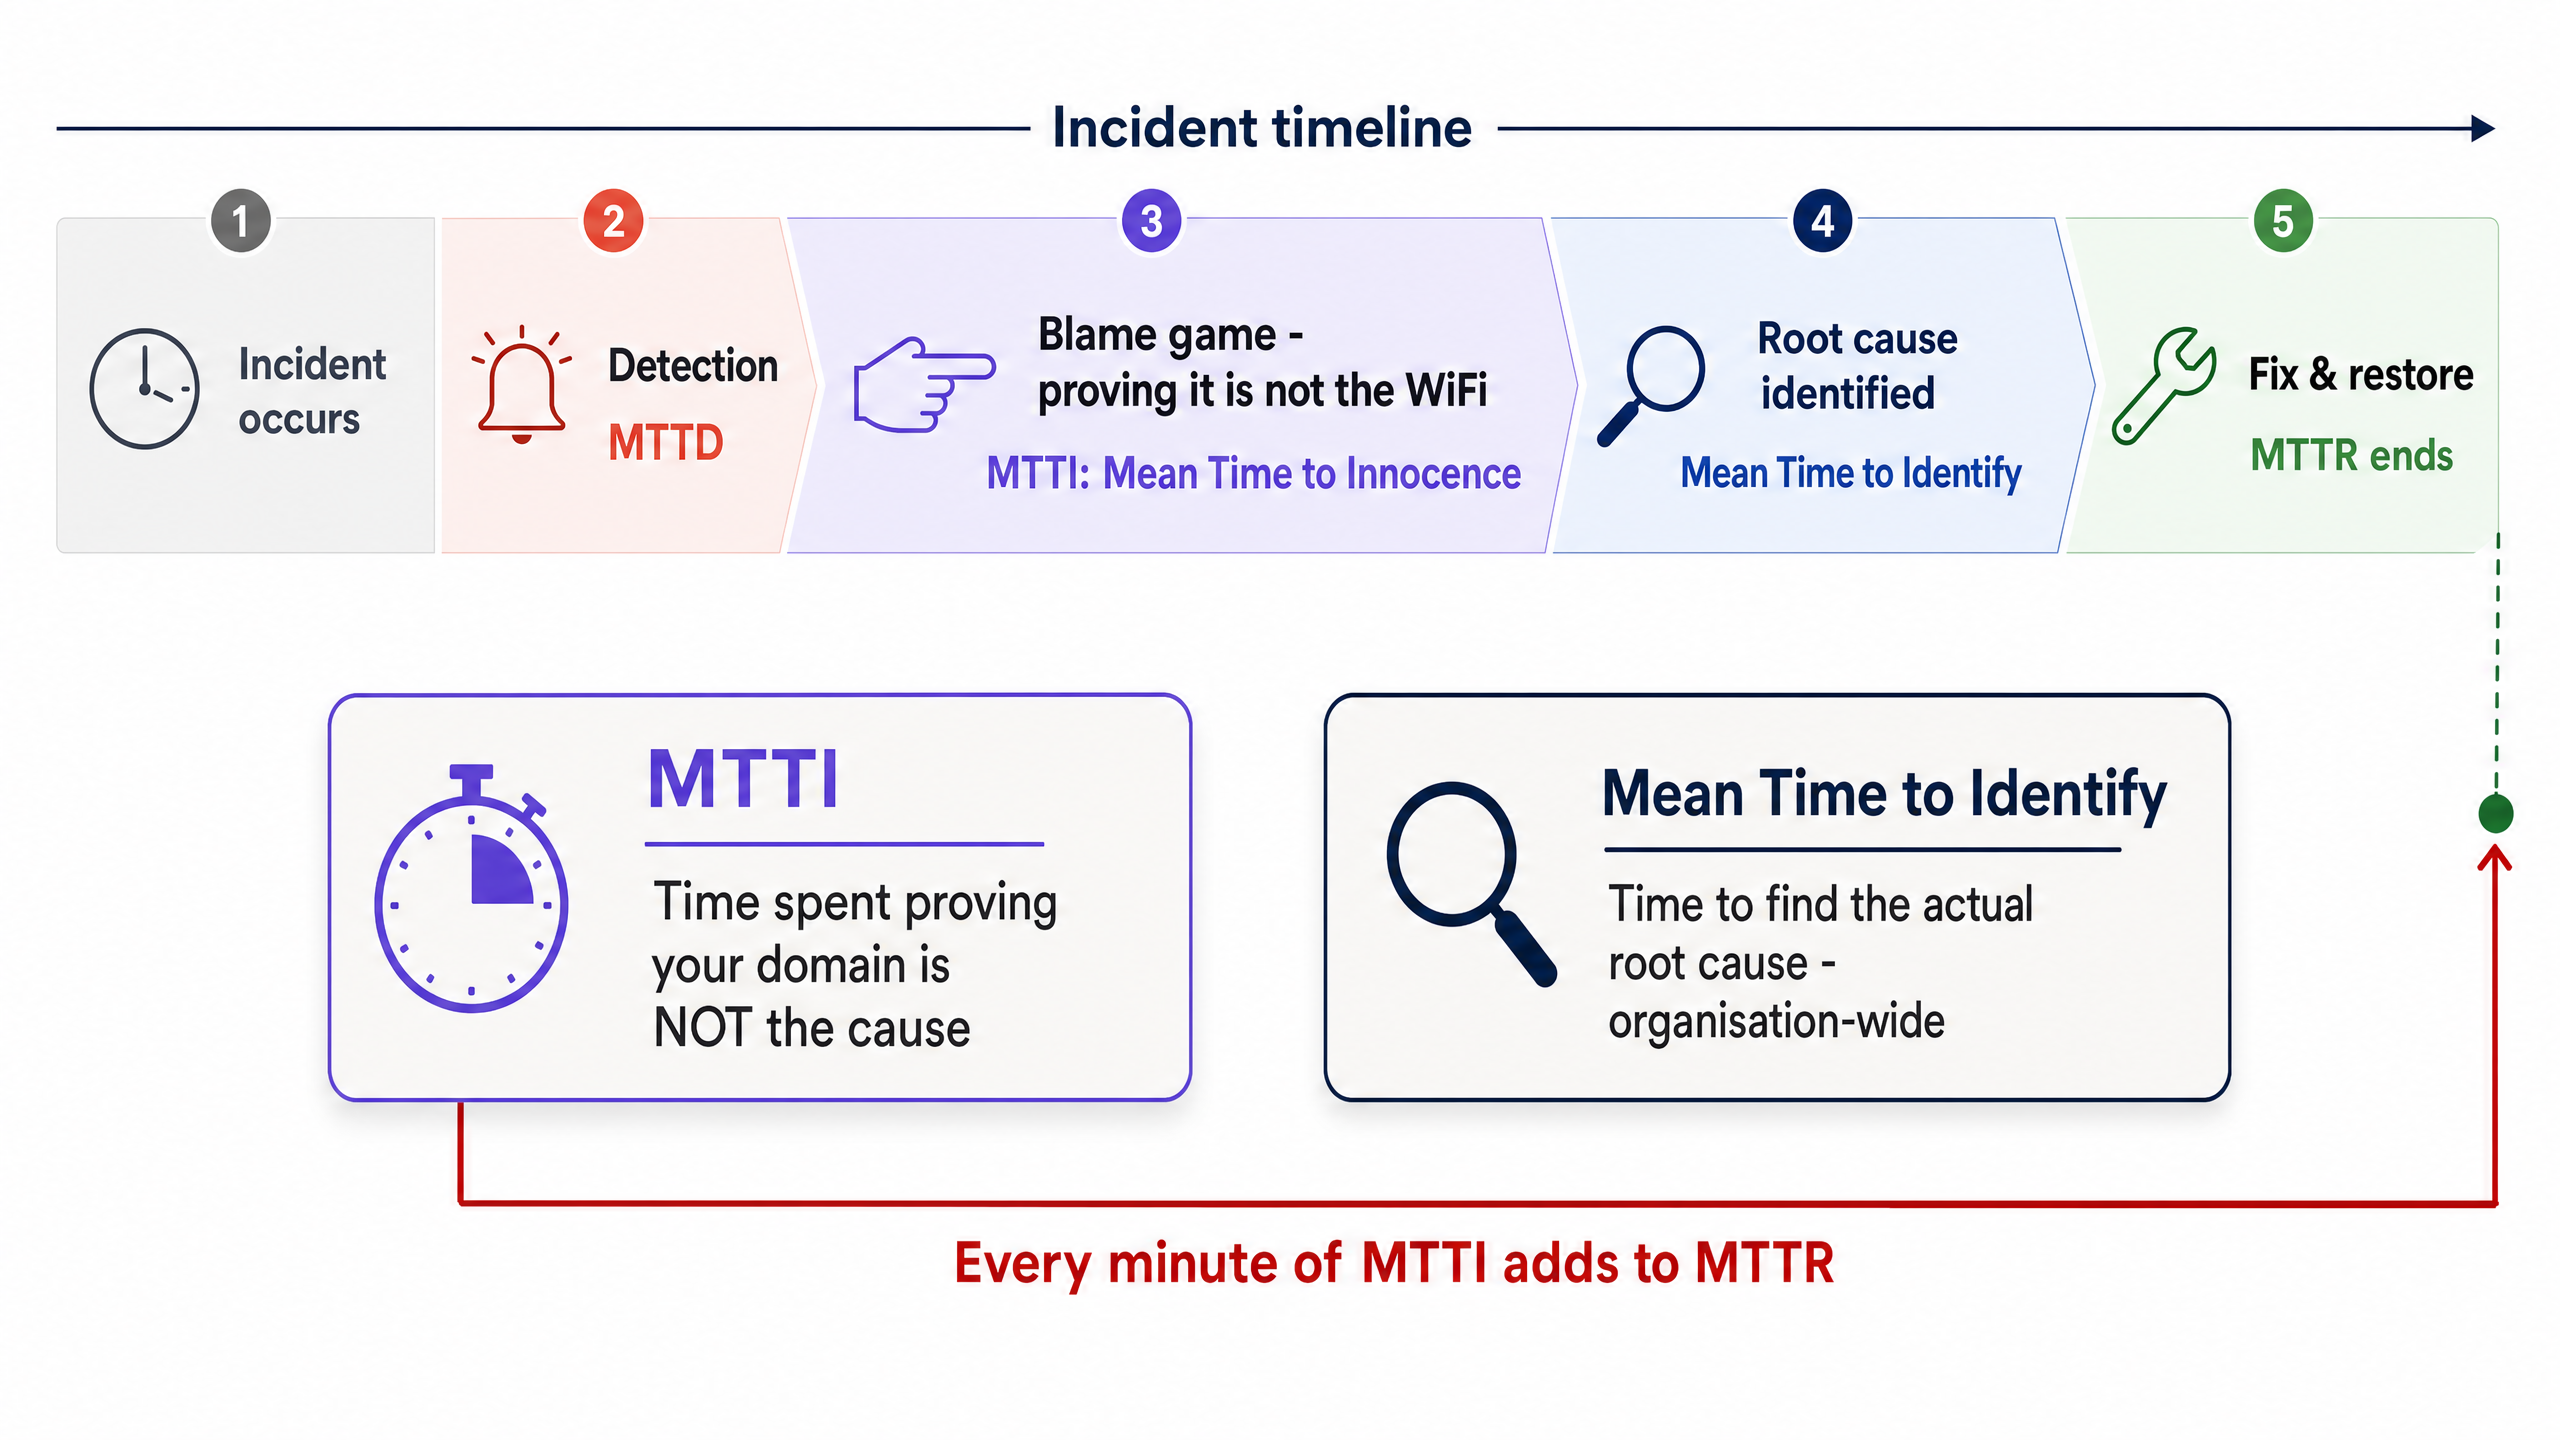
È fondamentale distinguere l'MTTI dal Mean Time to Identify. Il Mean Time to Identify è una metrica a livello aziendale che traccia il tempo necessario per individuare la reale causa principale di un disservizio. L'MTTI è una metrica isolata e specifica per dominio che traccia il tempo impiegato da un singolo team per dimostrare di non essere il colpevole.
Ogni minuto di MTTI si aggiunge direttamente all'MTTR. Se un fornitore di WiFi gestito impiega 40 minuti a controllare manualmente gli access point (AP) e i log degli switch prima di concludere che il problema risiede nell'ISP, l'MTTR subisce una penalizzazione di 40 minuti ancor prima che inizi l'effettiva risoluzione.
Why the WiFi Takes the Blame
In ambienti che servono 350 milioni di utenti unici in oltre 80.000 sedi attive, Purple riscontra ripetutamente lo stesso schema. Il livello WiFi viene colpevolizzato per impostazione predefinita a causa di tre realtà strutturali:
- Bias di visibilità: l'indicatore del segnale WiFi è l'unico strumento di diagnostica di rete a disposizione dell'utente medio della struttura.
- Prossimità al perimetro: essendo l'ultimo hop verso il dispositivo client, il WiFi eredita i sintomi di qualsiasi guasto a monte. Un timeout DNS a livello di ISP appare identico a un guasto dell'AP dal punto di vista dell'utente.
- Lacune di telemetria: storicamente, dimostrare lo stato di salute del wireless richiedeva un intervento manuale. Se non si riesce a dimostrare il perfetto funzionamento del livello wireless in meno di due minuti, si perde la partita della comunicazione.
The Multi-Tenant Complication
In un'azienda single-tenant, i team di rete gestiscono l'intero stack, dall'AP al firewall. Negli ambienti WiFi multi-tenant, la proprietà è frammentata.
Un residente BTR paga il gestore immobiliare. Il gestore immobiliare stipula un contratto con un fornitore di WiFi gestito. Il fornitore di WiFi gestito si affida a un circuito ISP di terze parti e, spesso, alla rete di distribuzione interna dell'edificio del proprietario. Quando un residente non riesce a riprodurre video in streaming, il fornitore deve scagionare rapidamente l'hardware WiFi (Cisco Meraki, HPE Aruba, Ruckus o Juniper Mist) e isolare il guasto sul dispositivo client, sullo switch dell'edificio o sull'ISP. In caso contrario, il rapporto commerciale tra il fornitore e il gestore immobiliare rischia di essere compromesso.
Implementation Guide: The 5-Step Methodology
Per ridurre sistematicamente l'MTTI, implementa questa architettura di osservabilità a cinque livelli.
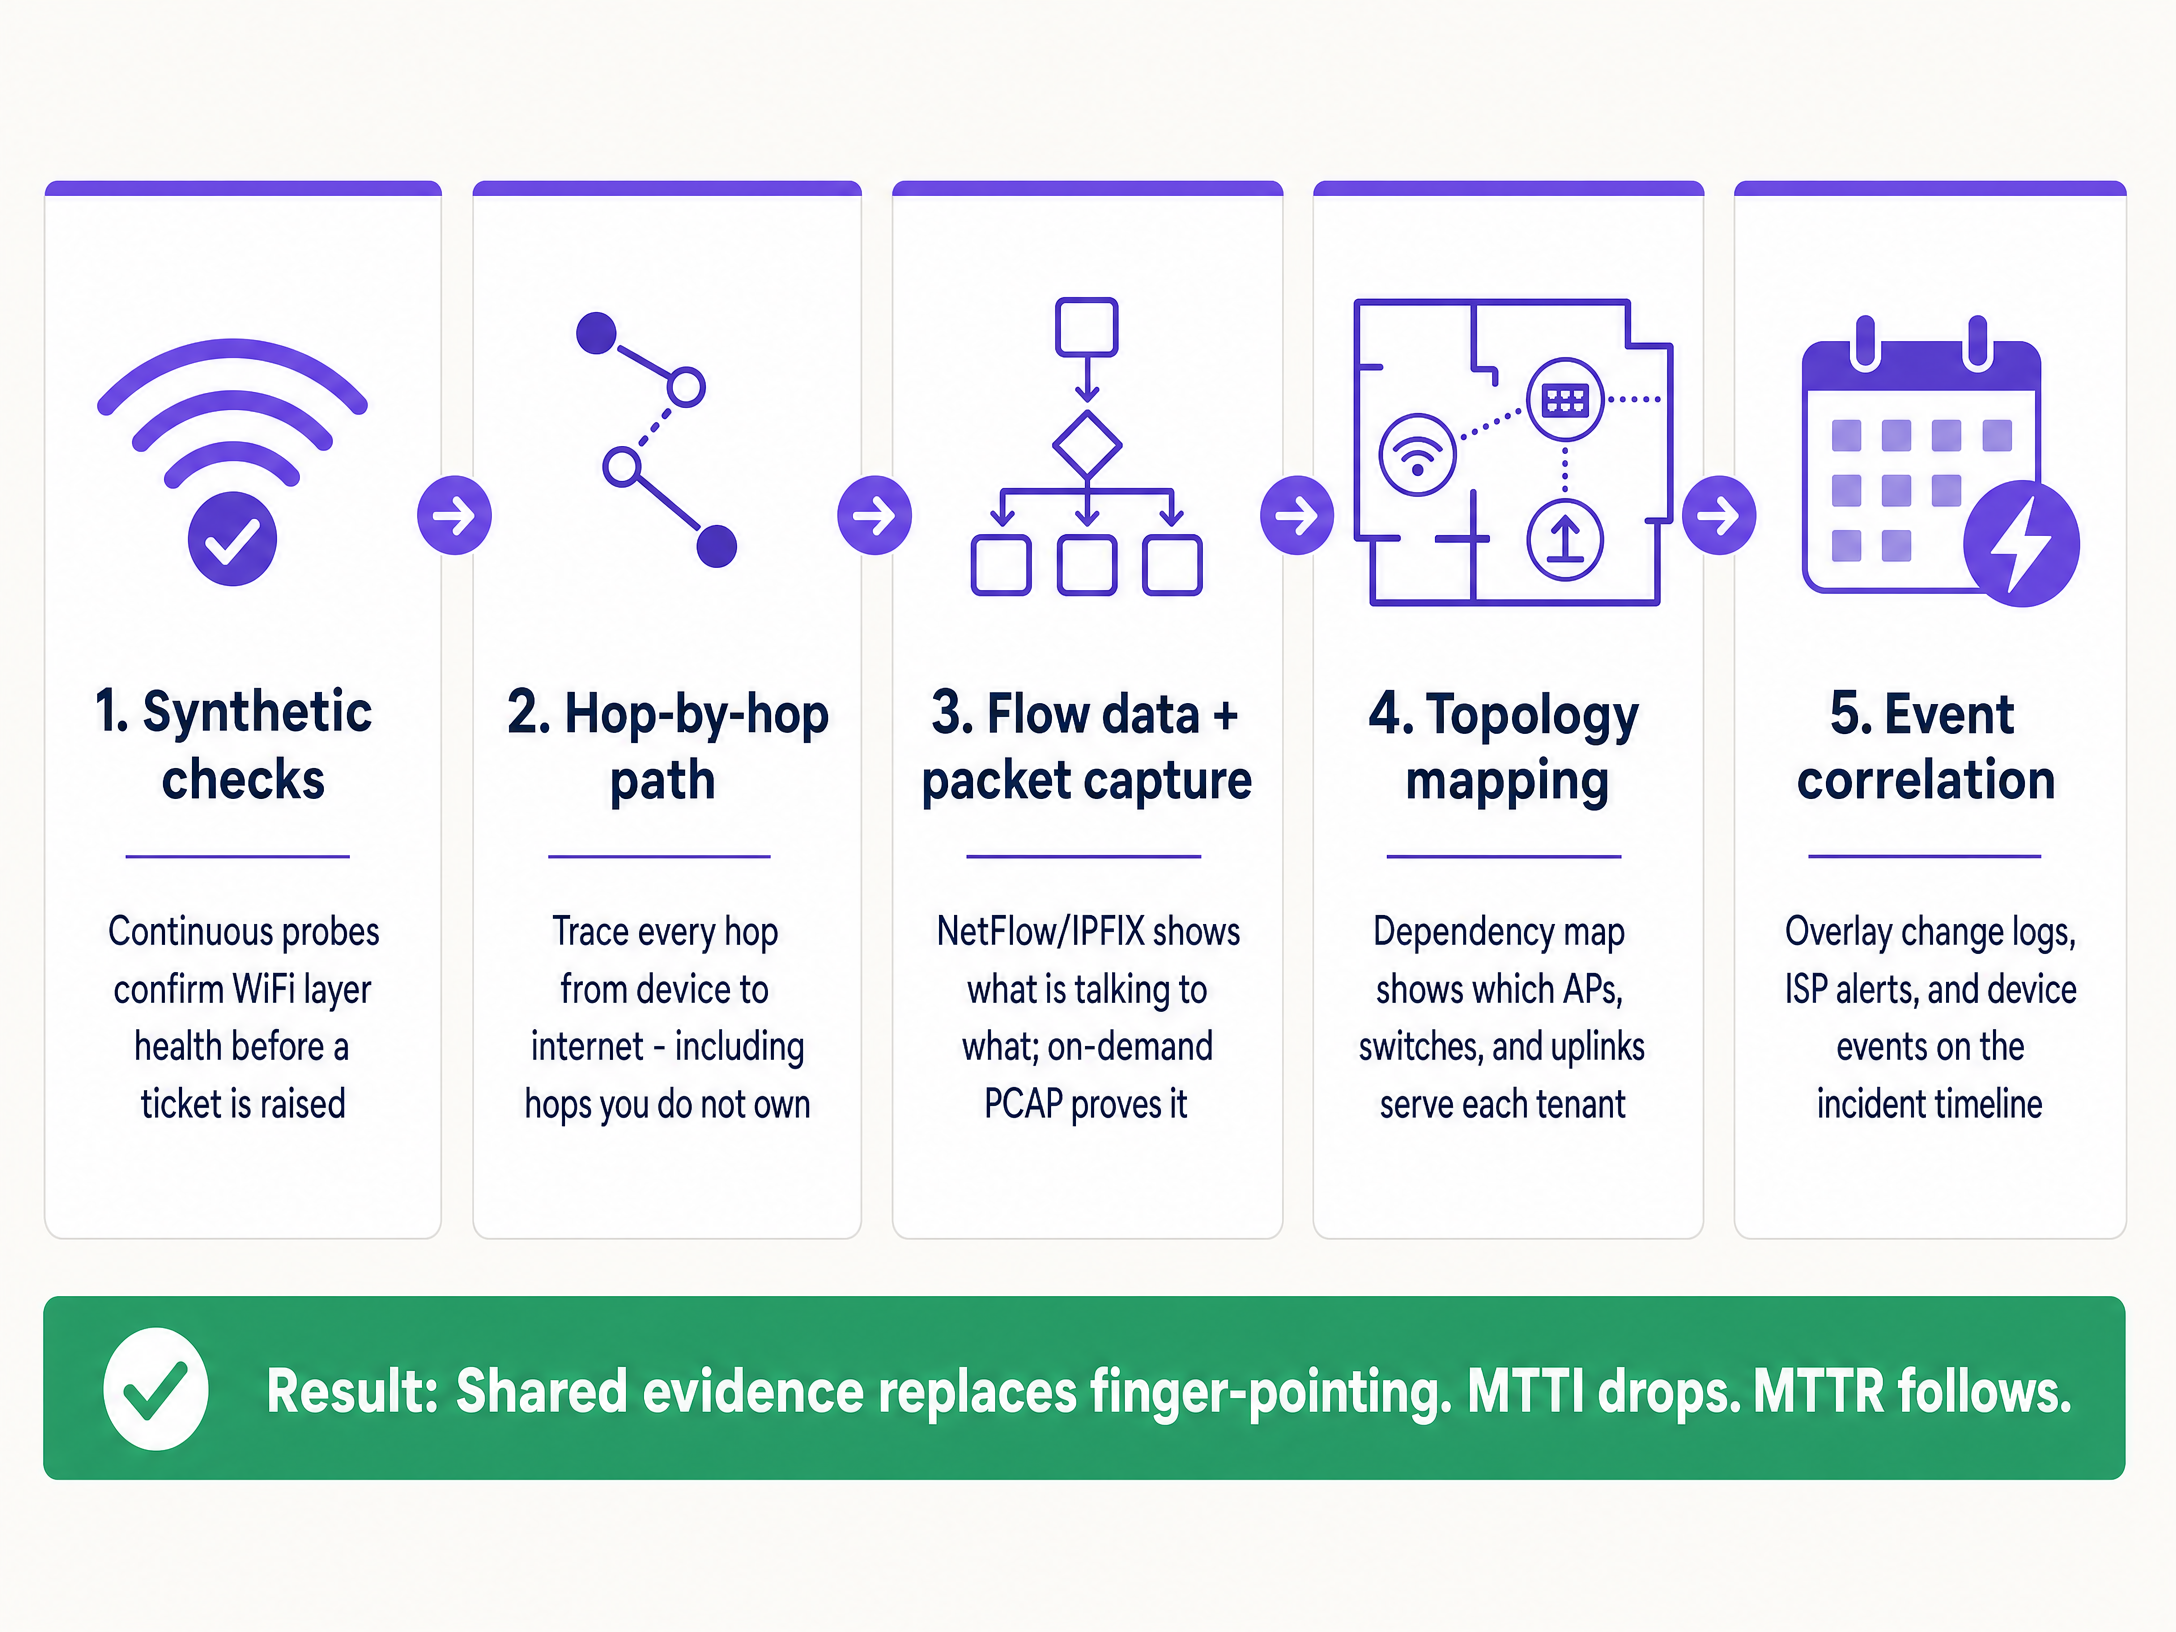
1. Continuous Synthetic Checks
Non aspettare che un utente si lamenti. Distribuisci sonde sintetiche automatizzate che emulano continuamente il comportamento degli utenti dal perimetro della rete.
- Implementazione: configura gli AP o i sensori dedicati per eseguire test pianificati per la risposta DHCP, la risoluzione DNS, la raggiungibilità HTTP e i flussi di autenticazione (come gli accessi 802.1X o tramite Captive Portal).
- Risultato: all'apertura di un ticket, controlli prima la dashboard sintetica. Se le sonde mostrano una raggiungibilità HTTP ottimale nel momento esatto del reclamo, scagioni immediatamente il livello WiFi e il circuito WAN, spostando l'attenzione sullo specifico dispositivo client o sull'applicazione di destinazione.
2. Hop-by-Hop Path Visibility
Dimostrare che l'hardware funziona correttamente non è sufficiente se non si può provare che il percorso verso Internet sia libero.
- Implementazione: utilizza strumenti di visualizzazione del percorso per tracciare il traffico dal livello di accesso attraverso la LAN, passando per il punto di demarcazione, fino alla rete dell'ISP.
- Risultato: in caso di picchi di latenza, un tracciamento del percorso rivela esattamente quale nodo ha introdotto il ritardo. Se gli hop da uno a quattro (il tuo dominio) mostrano una latenza di 2 ms e l'hop cinque (il router di bordo dell'ISP) mostra una latenza di 150 ms e il 12% di perdita di pacchetti, hai una prova definitiva da presentare all'ISP.
3. Flow Data and On-Demand Packet Capture
Quando gli utenti segnalano guasti specifici di un'applicazione, è necessaria una visibilità a livello di conversazione.
- Implementazione: esporta i dati NetFlow o IPFIX dai tuoi switch core o firewall. Assicurati che l'hardware del livello di accesso supporti l'acquisizione remota dei pacchetti on-demand (PCAP) senza richiedere la presenza di un tecnico in loco.
- Risultato: i dati di flusso dimostrano se il traffico verso un servizio specifico sta lasciando la rete in modo corretto. In caso affermativo, la rete è innocente. Se dSe sono necessarie prove forensi più approfondite, un PCAP mirato sulla VLAN specifica fornisce prove innegabili di ritrasmissioni TCP o reset lato server.
4. Mappatura della topologia e delle dipendenze
In un ambiente multi-tenant, isolare il raggio d'impatto è il modo più rapido per categorizzare un guasto.
- Implementazione: Mantieni una mappa delle dipendenze live e aggiornata dinamicamente che colleghi ogni AP al relativo switch, uplink e circuito WAN, mappata rispetto alle VLAN dei tenant.
- Risultato: Se un guasto interessa gli AP su più piani ma solo su un singolo switch, il problema è lo switch. Se interessa tutti gli AP ma solo la VLAN di un singolo tenant, si tratta di un problema di configurazione logica. Una rapida definizione dell'ambito evita di sprecare sforzi nell'analisi di un'infrastruttura funzionante.
5. Correlazione degli eventi
I dati senza contesto prolungano le indagini.
- Implementazione: Inserisci i log delle modifiche, gli avvisi di manutenzione dell'ISP, gli aggiornamenti del firmware hardware e i ticket degli utenti in un'unica visualizzazione della sequenza temporale.
- Risultato: Sovrapporre un picco di errori di autenticazione a un evento di scadenza del certificato Microsoft Entra ID verificatosi 10 minuti prima identifica immediatamente la causa radice, escludendo completamente l'hardware di rete.
Best Practice
- Standardizza lo stack hardware: Limita i deployment ai vendor enterprise canonici (Cisco Meraki, HPE Aruba, Ruckus, Juniper Mist, Ubiquiti UniFi, Cambium, Extreme, Fortinet) che espongono API per test sintetici e PCAP remoto.
- Automatizza le prove: Configura la tua piattaforma di monitoraggio per allegare automaticamente i risultati dei test sintetici e i tracciamenti dei percorsi ai ticket ITSM nel momento stesso in cui vengono creati.
- Condividi la dashboard: Fornisci ai property manager l'accesso in sola lettura a una dashboard dello stato di salute di alto livello. La trasparenza previene il gioco dello scaricabarile.
- Traccia formalmente l'MTTI: Misura il tempo che intercorre tra la creazione del ticket e il momento in cui il tuo team fornisce la prova di non colpevolezza. Trattalo come un KPI primario insieme all'MTTR.
Risoluzione dei problemi e mitigazione dei rischi
- Rischio: Il loop 'Nessun guasto rilevato': Gli utenti segnalano problemi, ma i controlli sintetici mostrano verde.
- Mitigazione: Il problema è probabilmente specifico del dispositivo o correlato a interferenze RF (interferenza co-canale o ostruzione fisica). Utilizza l'analisi lato client per verificare l'RSSI e la cronologia di roaming del dispositivo specifico.
- Rischio: Rifiuto dell'ISP: L'ISP si rifiuta di accettare il guasto nonostante le tue prove.
- Mitigazione: Fornisci tracciamenti del percorso hop-by-hop che mostrino l'indirizzo IP esatto in cui inizia la perdita di pacchetti. Condividi i PCAP che dimostrano un'uscita pulita dal tuo punto di demarcazione. I dati concreti costringono a un'escalation oltre il supporto di Livello 1.
- Rischio: Errori del Captive Portal: Gli utenti incolpano il WiFi quando il portale non si carica.
- Mitigazione: Isola l'identity provider. Verifica lo stato dell'integrazione (Microsoft Entra ID, Okta, Google Workspace). Se la rete consente il traffico di pre-autenticazione ma l'IdP va in timeout, la rete non è colpevole.
ROI e impatto aziendale
La riduzione dell'MTTI offre un valore aziendale misurabile che va ben oltre il semplice risparmio di ore di ingegneria.
- MTTR ridotto: Eliminare 40 minuti di scaricabarile da un incidente riduce direttamente i tempi di inattività, proteggendo i ricavi negli ambienti retail e hospitality .
- Conformità SLA: Una più rapida discolpa evita che vengano applicate penali ingiuste al provider WiFi gestito quando il guasto risiede nell'ISP o nell'infrastruttura dell'edificio.
- Fidelizzazione dei clienti: Nel settore del WiFi multi-tenant, i property manager rinnovano i contratti con i provider che offrono trasparenza e risposte rapide. Le prove condivise creano fiducia; le argomentazioni difensive la distruggono.
- Ottimizzazione delle risorse: Gli ingegneri di rete di Livello 3, altamente retribuiti, dedicano il loro tempo alla progettazione di soluzioni, anziché a dimostrare manualmente che la rete funzioni correttamente.
Definizioni chiave
Mean Time to Innocence (MTTI)
The average time required for a specific IT team to prove, using objective data, that their domain or infrastructure is not the root cause of a reported incident.
Critical for managed WiFi providers who must defend their service against property managers and ISPs.
Mean Time to Identify
The organisation-wide metric tracking the total time elapsed from incident detection to the discovery of the actual root cause.
MTTI is a subset of this metric. Reducing MTTI directly reduces the overall time to identify.
Synthetic Checks
Automated, continuous tests that emulate user traffic (e.g., DNS lookups, HTTP requests) to proactively monitor network health.
Used to prove the WiFi layer was functioning correctly at the exact moment a user complained.
Hop-by-Hop Path Visibility
Telemetry that traces network traffic node-by-node from the client to the destination, measuring latency and loss at each specific router or switch.
Essential for proving a fault lies in an ISP network or a landlord's distribution switch, rather than the managed WiFi hardware.
Flow Data (NetFlow/IPFIX)
Network protocol data that provides a summary of traffic conversations, showing source, destination, protocol, and volume.
Used to prove that specific application traffic is successfully leaving the local network.
On-Demand Packet Capture (PCAP)
The ability to remotely record raw network traffic from an access point or switch for forensic analysis.
The ultimate proof used to demonstrate server-side errors or client device misbehaviour.
Blast Radius
The scope of impact of a specific incident (e.g., one user, one AP, one switch, one tenant, or the entire building).
Determining the blast radius via topology mapping is the fastest way to exclude healthy infrastructure from an investigation.
Event Correlation
The practice of overlaying different data streams (logs, alerts, updates) on a single timeline to identify cause and effect.
Used to prove that a network outage was caused by a third-party change, such as an unannounced ISP maintenance window.
Esempi pratici
A 350-room hotel reports that in-room WiFi is slow across the entire property. The front desk blames the managed WiFi provider. How do you exonerate the network and find the root cause?
- Check the synthetic probes: DNS and HTTP reachability tests show the APs have a clean connection to the internet. 2. Review the topology map: The issue affects all APs across all switches, ruling out edge hardware. 3. Execute a path trace: The trace shows 2ms latency within the hotel LAN, but 180ms latency at the third hop (the ISP's aggregation router). 4. Export the evidence: Send the path trace screenshot to the hotel manager and the ISP.
A national retailer reports point-of-sale (POS) terminals in one region are dropping connections to the payment processor. The network team is blamed for a firewall or routing misconfiguration.
- Isolate the blast radius: Confirm only POS terminals (specific VLAN) are affected; guest WiFi and back-office systems are healthy. 2. Analyse flow data: NetFlow confirms traffic destined for the payment processor's IP range is successfully leaving the store routers. 3. Capture packets: An on-demand PCAP on the POS VLAN reveals the payment processor's server is sending TCP resets (RST). 4. Share the PCAP with the payment processor's support team.
Domande di esercitazione
Q1. A tenant in a coworking space complains they cannot access their corporate VPN. Other tenants are browsing the internet without issue. What is the most efficient way to prove the WiFi network is not at fault?
Suggerimento: Consider the blast radius and the specific type of traffic failing.
Visualizza risposta modello
First, use the topology map to confirm the blast radius is limited to one user or one specific service, ruling out a general AP or switch failure. Second, analyse flow data (NetFlow/IPFIX) for that client's IP address. If the flow data shows the VPN traffic (e.g., UDP 500 or TCP 443) is leaving the network cleanly, the WiFi and LAN are innocent. The issue is either the client's VPN configuration or the corporate firewall blocking the connection.
Q2. Your monitoring dashboard shows an AP has gone offline, but the property manager insists the WiFi is broken because the ISP is down. How do you prove the issue is internal power, not the ISP?
Suggerimento: Look for correlation between infrastructure state and external events.
Visualizza risposta modello
Use event correlation and topology mapping. If the topology map shows only one AP is offline while others on the same switch are functioning, the ISP circuit is clearly active. Event correlation might show a PoE (Power over Ethernet) failure log from the switch port connected to that specific AP. This proves the issue is local hardware or cabling, not the WAN circuit.
Q3. A stadium operations director claims the WiFi failed during halftime because ticket scanners stopped working. You need to exonerate the network in under two minutes. What telemetry do you use?
Suggerimento: You need historical proof of health at the exact moment of the reported failure.
Visualizza risposta modello
Pull the historical data from the continuous synthetic checks. Show the operations director the dashboard confirming that during the exact 15-minute halftime window, the APs were successfully resolving DNS and reaching the ticketing server's IP address with low latency. This immediately proves the wireless network was healthy and shifts the investigation to the ticketing application servers, which likely buckled under the sudden load.
Continua a leggere questa serie
La guida aziendale a SCEP: implementare il Simple Certificate Enrollment Protocol per la sicurezza automatizzata del WiFi nei campus
Questa guida di riferimento tecnico fornisce un modello architetturale definitivo e una strategia di implementazione passo-passo per l'implementazione dei certificati WiFi aziendali tramite SCEP. Copre le differenze cruciali tra SCEP e PKCS, l'esatta sequenza di implementazione necessaria per il successo e le strategie reali di mitigazione del rischio per i leader IT.
Perché il mio WiFi per gli ospiti non si connette? Risoluzione dei problemi del Captive Portal
Questa guida di riferimento tecnico autorevole spiega i meccanismi alla base del rilevamento del Captive Portal e descrive in dettaglio le sei principali modalità di errore che impediscono la connessione del WiFi per gli ospiti. Fornisce ai responsabili IT e agli architetti di rete un framework pratico di risoluzione dei problemi per risolvere i problemi di reindirizzamento HTTP, i conflitti DNS e le sfide di randomizzazione MAC.
Come implementare SCEP per la registrazione automatizzata dei certificati WiFi
Questa guida spiega come implementare SCEP (Simple Certificate Enrollment Protocol) per la registrazione automatizzata dei certificati WiFi nelle sedi aziendali. Copre l'intero progetto architetturale - dalla progettazione PKI e integrazione MDM alla sequenza di implementazione obbligatoria in tre fasi - e mostra ai responsabili IT e agli architetti di rete come eliminare le credenziali condivise, automatizzare la gestione del ciclo di vita dei certificati e soddisfare i requisiti PCI DSS e GDPR su scala.