證明清白的時間:如何證明問題不在 WiFi
證明清白的時間(MTTI)是定義 IT 團隊花費多少時間來證明網路問題並非其責任的關鍵指標。本指南詳細介紹了五步驟的可觀測性方法,以消除多租戶環境中的推諉現象,用共同證據取代互相指責,從而降低平均修復時間(MTTR)。
收聽此指南
查看播客逐字稿
📚 核心系列的一部分:多租戶 WiFi:完整指南 →
Executive Summary
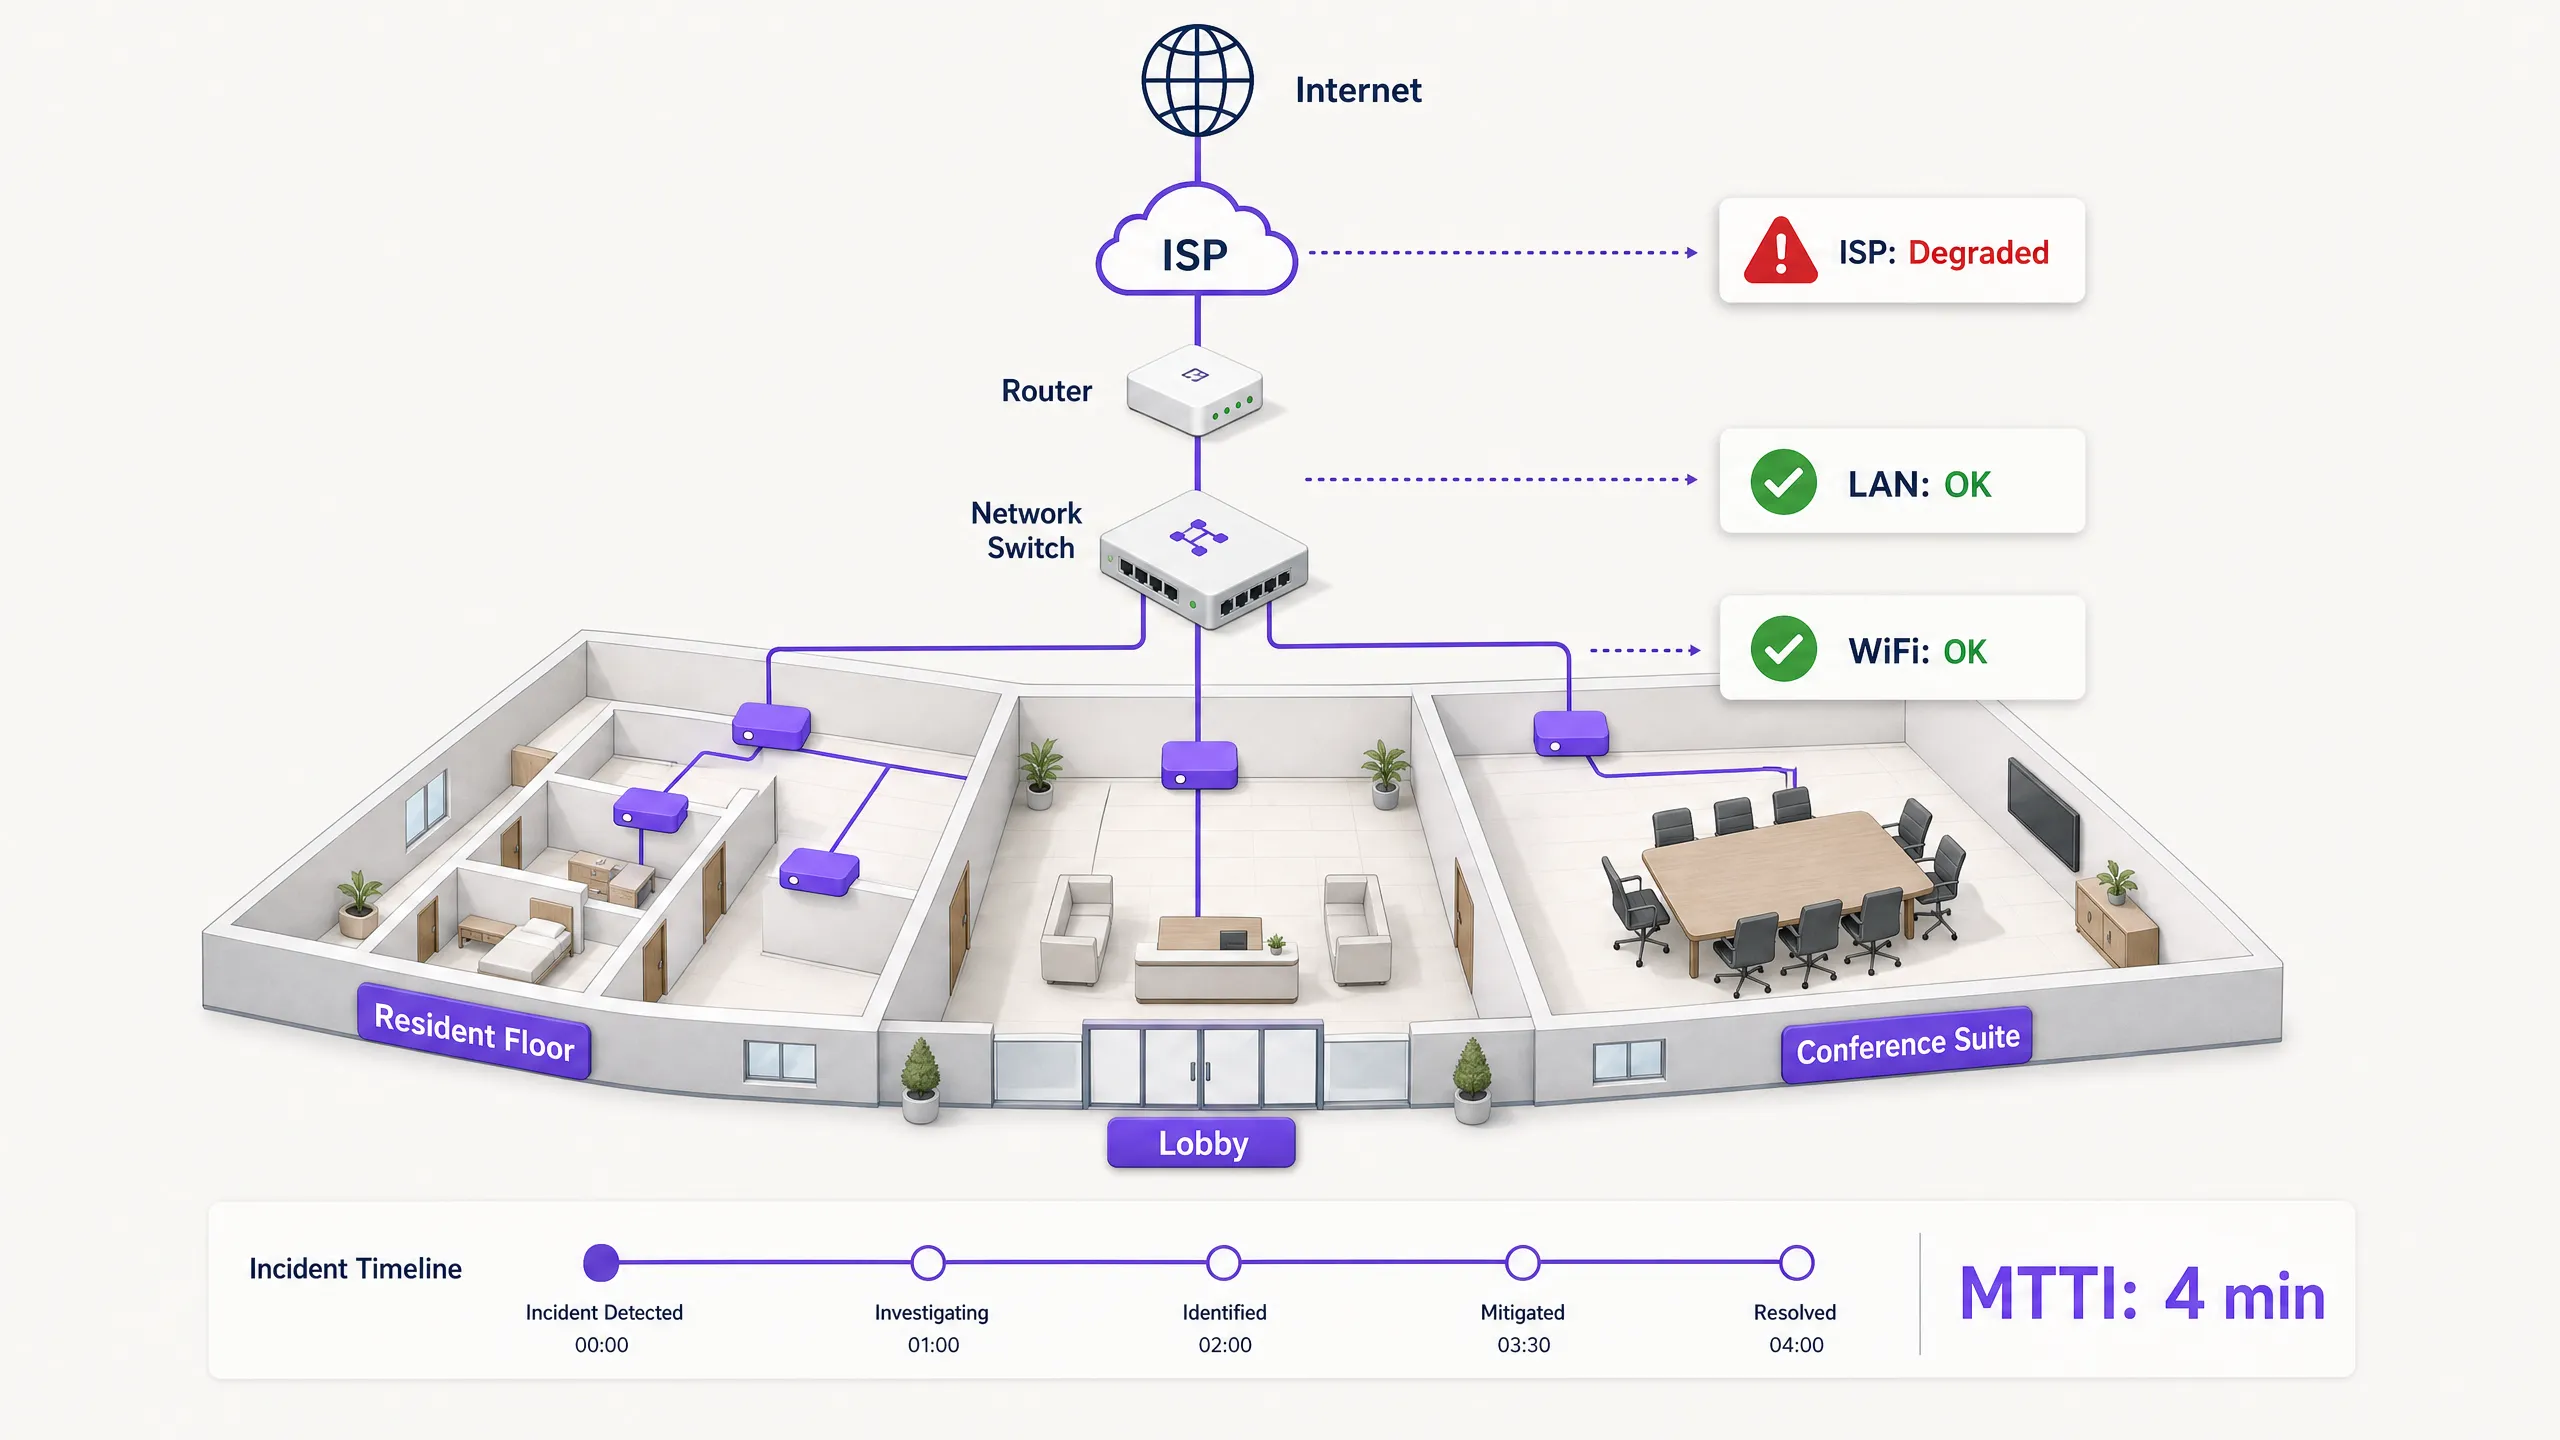
When connectivity drops in a multi-tenant environment, the WiFi gets blamed first. It is the visible edge of the network, the last hop before the device, and the easiest target for frustrated users. For IT managers, network architects, and venue operations directors, this creates a persistent operational tax: the time spent proving innocence.
Mean time to innocence (MTTI) measures the average elapsed time between an incident being reported and a team's ability to demonstrate that their domain is not the root cause. In complex environments like build-to-rent (BTR) blocks, hotels, or conference centres, the network is fragmented across property managers, managed WiFi providers, and internet service providers (ISPs). Without definitive telemetry, MTTI inflates mean time to resolution (MTTR) as teams argue over responsibility rather than fixing the fault.
This guide details a five-step observability methodology to systematically reduce MTTI. By deploying continuous synthetic checks, hop-by-hop path visibility, flow data analysis, topology mapping, and event correlation, you can replace adversarial finger-pointing with shared evidence. The goal is not to win the blame game faster, but to end it entirely.
Technical Deep-Dive: The Mechanics of MTTI
The Distinction Between MTTI and Mean Time to Identify
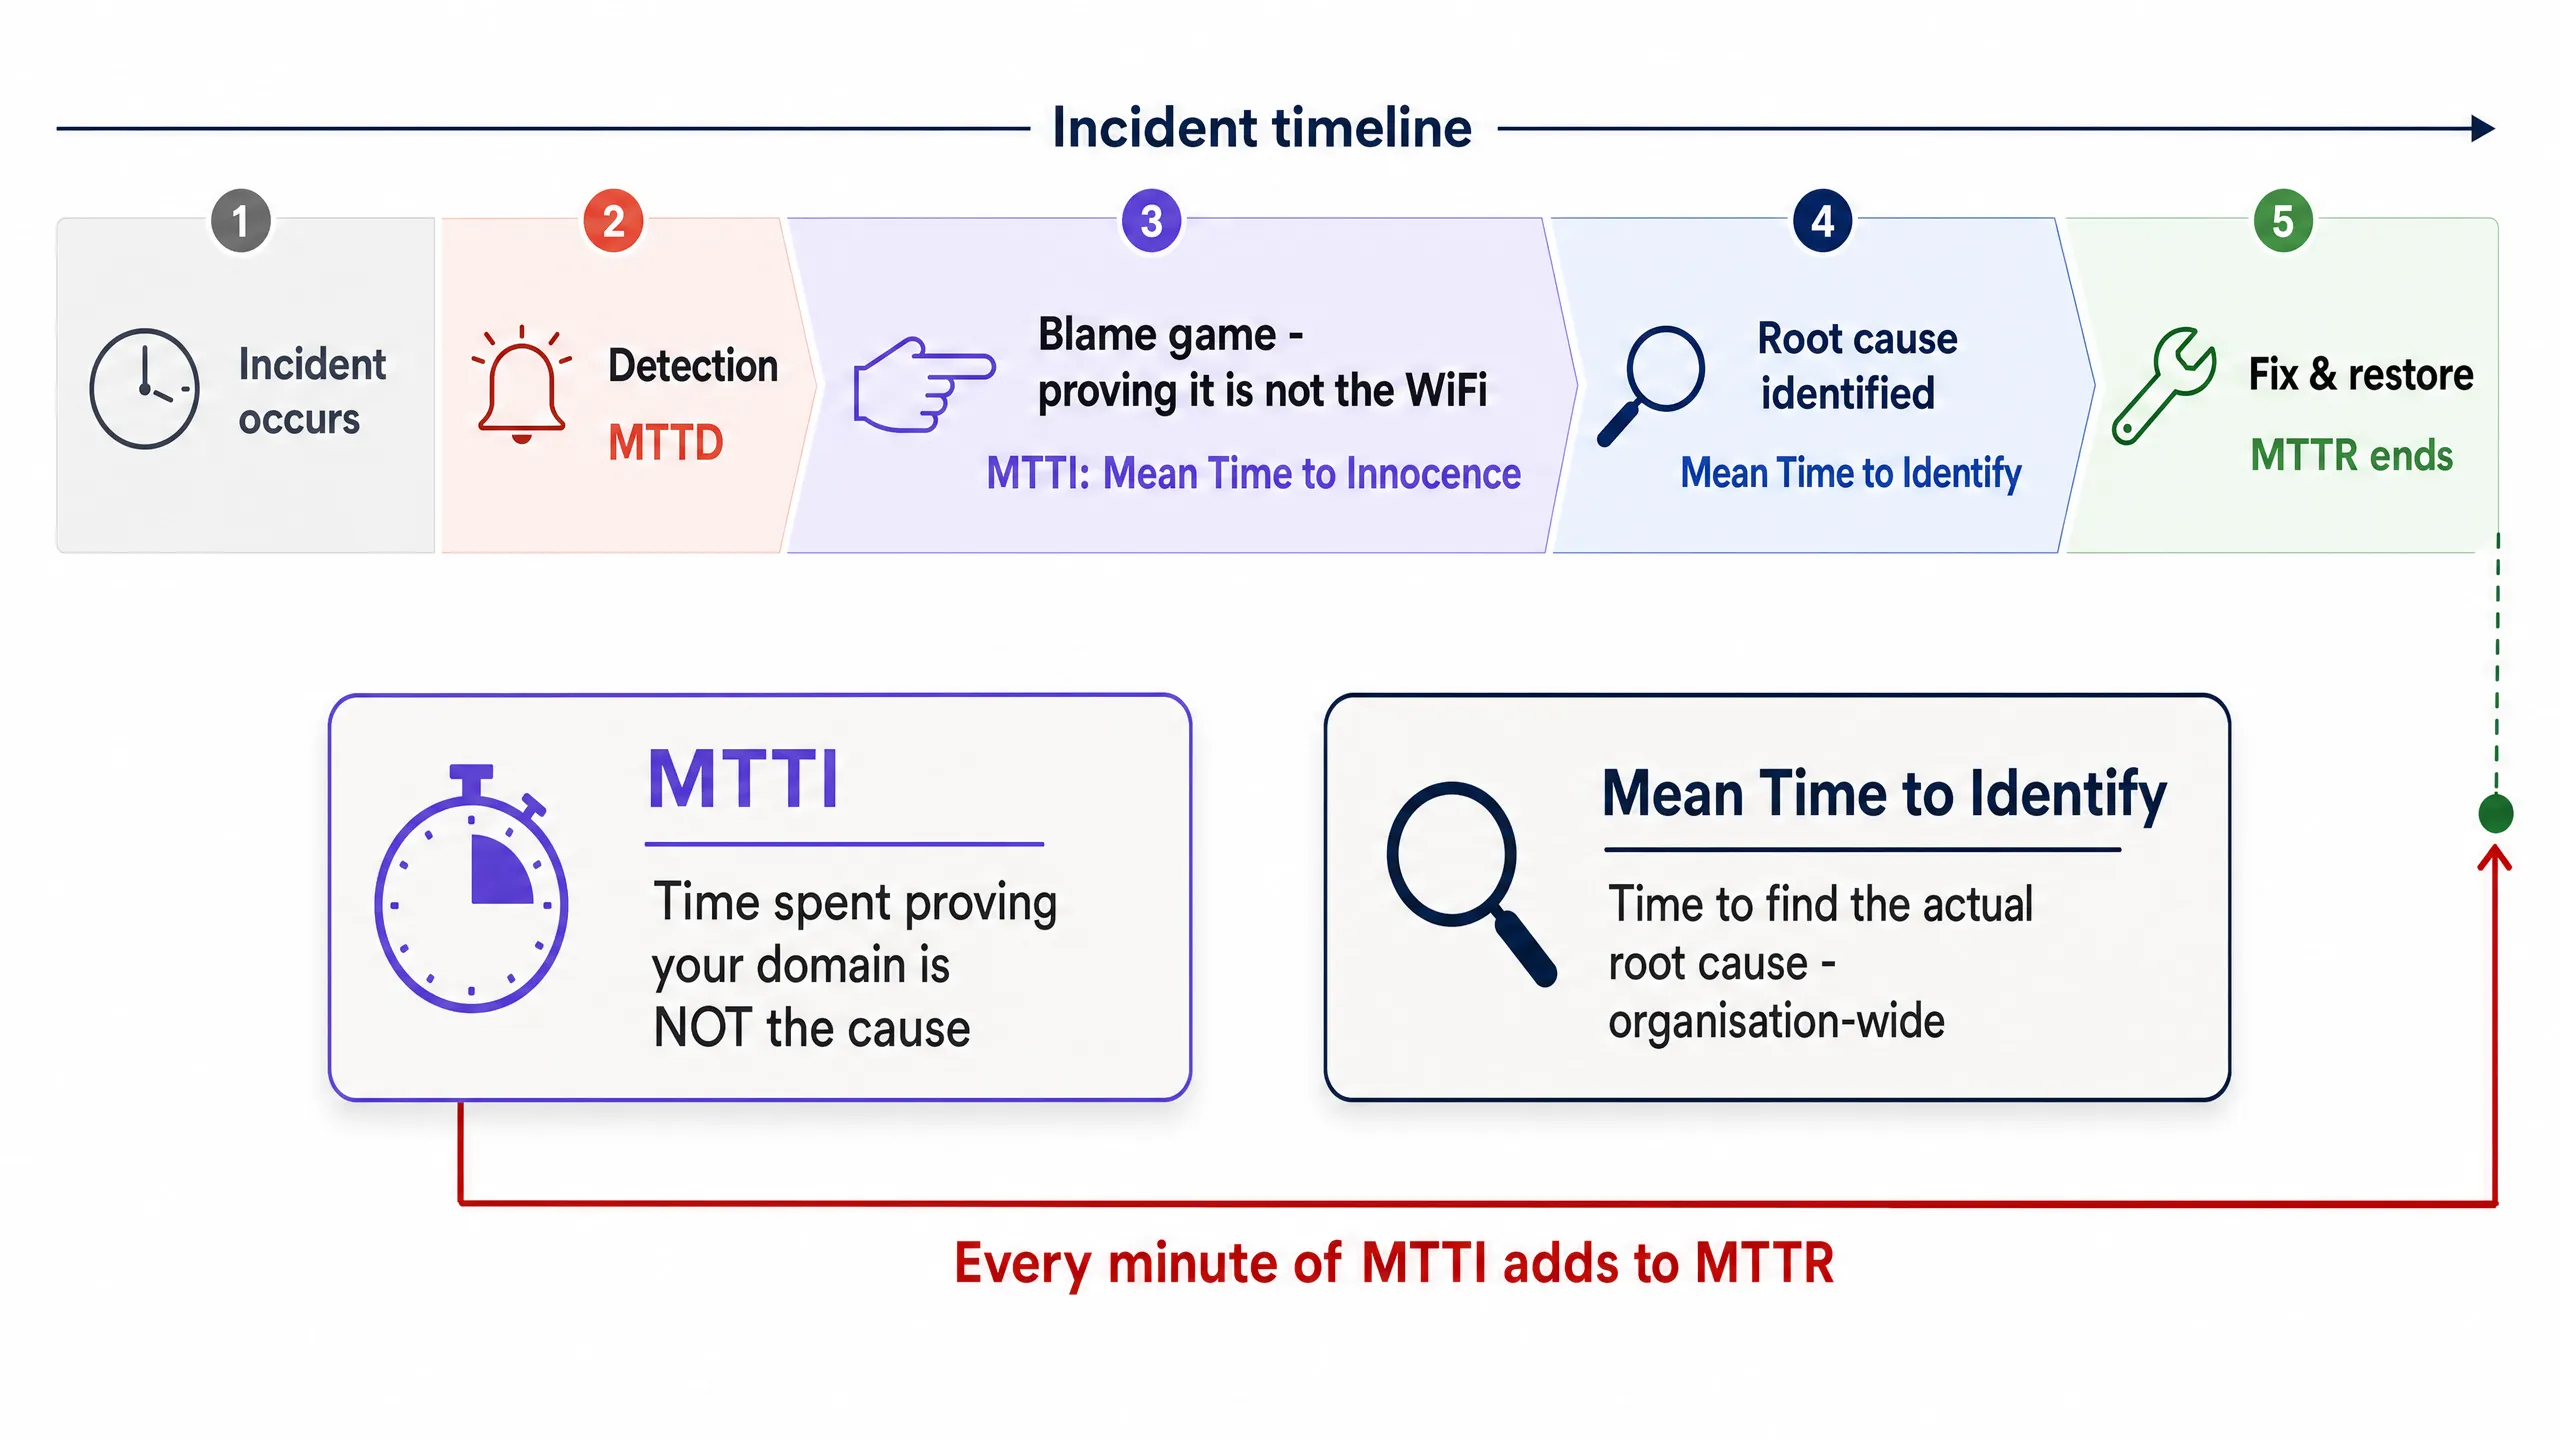
It is vital to separate MTTI from mean time to identify. Mean time to identify is an organisation-wide metric tracking how long it takes to find the actual root cause of an outage. MTTI is a siloed, domain-specific metric tracking how long it takes one team to prove they are not the culprit.
Every minute of MTTI adds directly to MTTR. If a managed WiFi provider spends 40 minutes manually checking access points (APs) and switch logs before concluding the issue lies with the ISP, the MTTR has a 40-minute penalty built in before the actual remediation even begins.
Why the WiFi Takes the Blame
In environments serving 350 million unique users across 80,000+ live venues, Purple sees the same pattern repeatedly. The WiFi layer is blamed by default due to three structural realities:
- Visibility bias: The WiFi signal indicator is the only network diagnostic tool available to the average venue user.
- Edge proximity: As the final hop to the client device, WiFi inherits the symptoms of every upstream failure. A DNS timeout at the ISP looks identical to an AP failure from the user's perspective.
- Telemetry gaps: Historically, proving wireless health required manual intervention. If you cannot show a clean bill of health for the wireless layer in under two minutes, you lose the narrative.
The Multi-Tenant Complication
In a single-tenant enterprise, network teams own the stack from the AP to the firewall. In Multi-Tenant WiFi environments, ownership is fractured.
A BTR resident pays the property manager. The property manager contracts a managed WiFi provider. The managed WiFi provider relies on a third-party ISP circuit and, often, the landlord's in-building distribution network. When a resident cannot stream video, the provider must rapidly exonerate the WiFi hardware (Cisco Meraki, HPE Aruba, Ruckus, or Juniper Mist) and isolate the fault to the client device, the building switch, or the ISP. Failure to do so damages the commercial relationship between the provider and the property manager.
Implementation Guide: The 5-Step Methodology
To systematically reduce MTTI, implement this five-layer observability architecture.
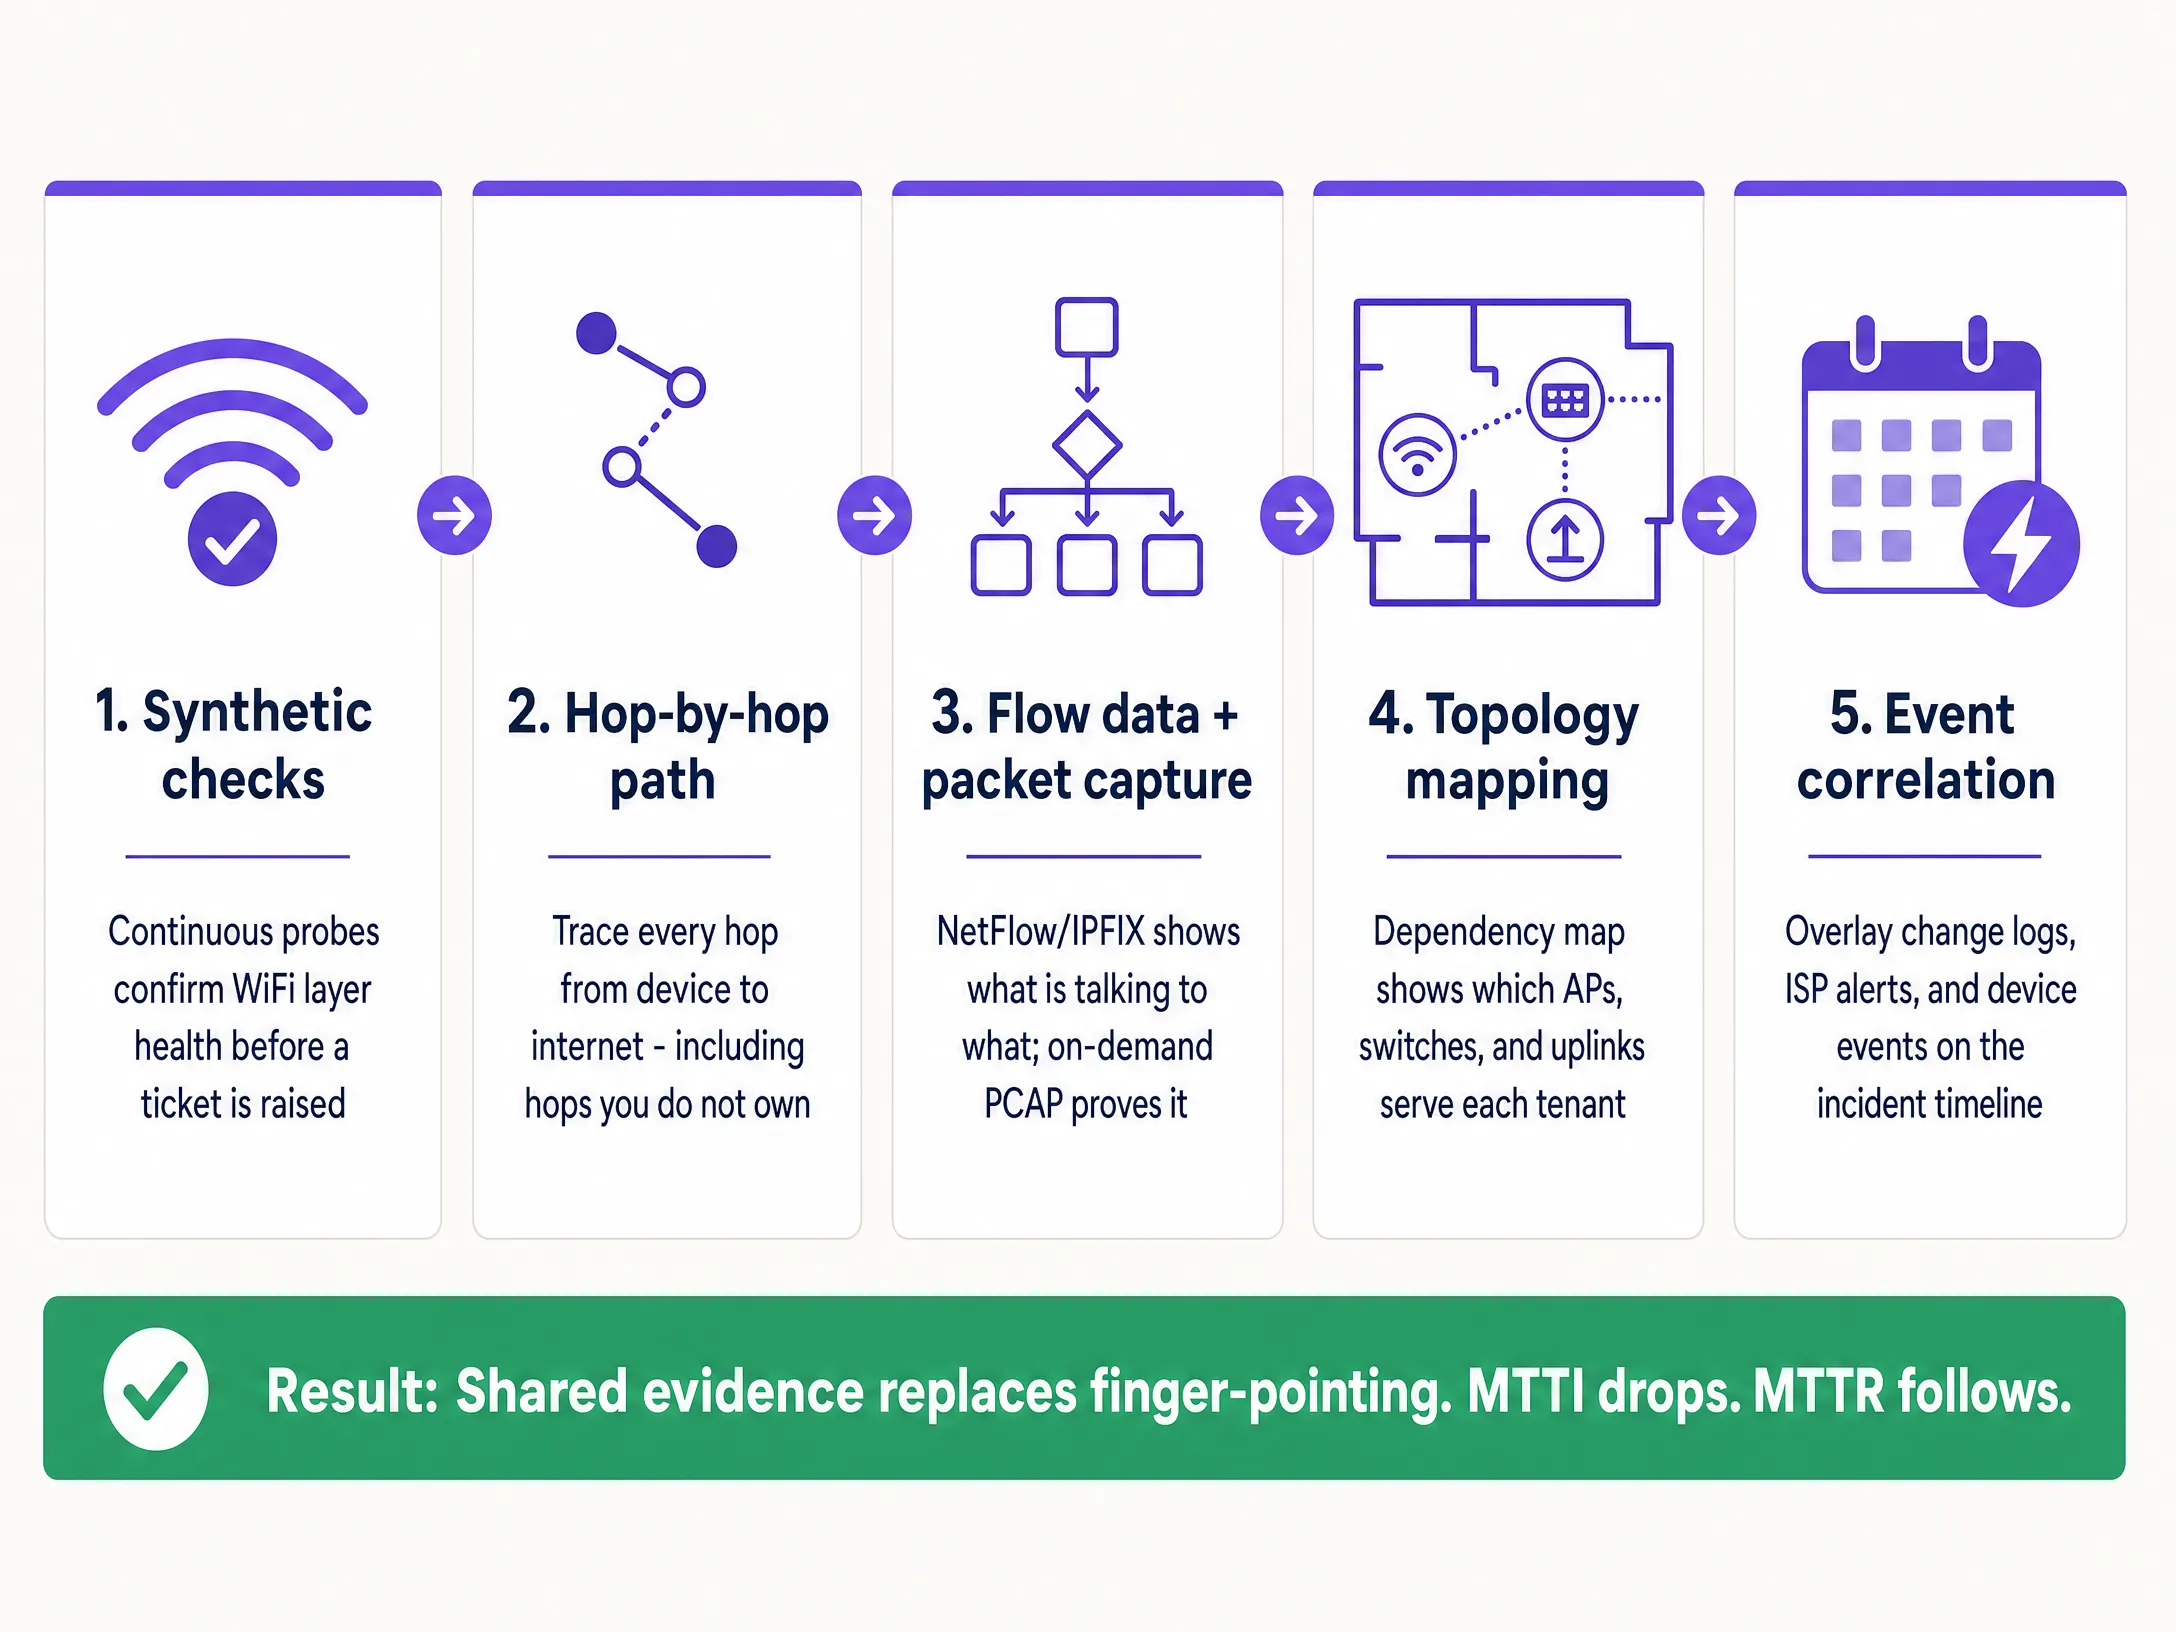
1. Continuous Synthetic Checks
Do not wait for a user to complain. Deploy automated synthetic probes that continuously emulate user behaviour from the network edge.
- Implementation: Configure APs or dedicated sensors to run scheduled tests for DHCP response, DNS resolution, HTTP reachability, and authentication flows (such as 802.1X or Captive Portal logins).
- Outcome: When a ticket is raised, you check the synthetic dashboard first. If the probes show clean HTTP reachability at the exact time of the complaint, you immediately exonerate the WiFi layer and the WAN circuit, shifting focus to the specific client device or the target application.
2. Hop-by-Hop Path Visibility
Proving your hardware is healthy is insufficient if you cannot prove the path to the internet is clear.
- Implementation: Use path visualisation tools to trace traffic from the access layer across the LAN, through the demarcation point, and into the ISP network.
- Outcome: When latency spikes, a path trace reveals exactly which node introduced the delay. If hops one through four (your domain) show 2ms latency, and hop five (the ISP edge router) shows 150ms latency and 12% packet loss, you have definitive proof to hand to the ISP.
3. Flow Data and On-Demand Packet Capture
When users report application-specific failures, you need conversation-level visibility.
- Implementation: Export NetFlow or IPFIX data from your core switches or firewalls. Ensure your access layer hardware supports remote, on-demand packet capture (PCAP) without requiring an engineer on site.
- Outcome: Flow data proves whether traffic to a specific service is leaving your network cleanly. If it is, the network is innocent. If deeper forensic proof is required, a targeted PCAP on the specific VLAN provides undeniable evidence of TCP retransmissions or server-side resets.
4. Topology and Dependency Mapping
In a multi-tenant environment, isolating the blast radius is the fastest way to categorise a fault.
- Implementation: Maintain a live, dynamically updated dependency map linking every AP to its switch, uplink, and WAN circuit, mapped against tenant VLANs.
- Outcome: If a fault affects APs across multiple floors but only on a single switch, the issue is the switch. If it affects all APs but only one tenant's VLAN, it is a logical configuration issue. Rapid scoping prevents wasted effort investigating healthy infrastructure.
5. Event Correlation
Data without context prolongs investigations.
- Implementation: Feed change logs, ISP maintenance alerts, hardware firmware updates, and user tickets into a single timeline view.
- Outcome: Overlaying a spike in authentication failures with a Microsoft Entra ID certificate expiration event that occurred 10 minutes prior immediately identifies the root cause, bypassing the network hardware entirely.
Best Practices
- Standardise the Hardware Stack: Limit deployments to canonical enterprise vendors (Cisco Meraki, HPE Aruba, Ruckus, Juniper Mist, Ubiquiti UniFi, Cambium, Extreme, Fortinet) that expose APIs for synthetic testing and remote PCAP.
- Automate the Evidence: Configure your monitoring platform to automatically attach synthetic test results and path traces to ITSM tickets the moment they are created.
- Share the Dashboard: Provide property managers with read-only access to a high-level health dashboard. Transparency preempts the blame game.
- Track MTTI Formally: Measure the time between ticket creation and the moment your team provides evidence of innocence. Treat it as a primary KPI alongside MTTR.
Troubleshooting & Risk Mitigation
- Risk: The 'No Fault Found' Loop: Users report issues, but synthetic checks show green.
- Mitigation: The issue is likely device-specific or related to RF interference (co-channel interference or physical obstruction). Use client-side analytics to check the specific device's RSSI and roaming history.
- Risk: ISP Denial: The ISP refuses to accept the fault despite your evidence.
- Mitigation: Provide hop-by-hop path traces showing the exact IP address where packet loss begins. Share PCAPs demonstrating clean egress from your demarcation point. Hard data forces escalation past Level 1 support.
- Risk: Captive Portal Failures: Users blame the WiFi when the portal fails to load.
- Mitigation: Isolate the identity provider. Check the status of the integration (Microsoft Entra ID, Okta, Google Workspace). If the network allows pre-authentication traffic but the IdP times out, the network is innocent.
ROI & Business Impact
Reducing MTTI delivers measurable business value beyond simply saving engineering hours.
- Reduced MTTR: Stripping 40 minutes of finger-pointing from an incident directly reduces downtime, protecting revenue in retail and hospitality environments.
- SLA Compliance: Faster exoneration prevents unfair penalties being levied against the managed WiFi provider when the fault lies with the ISP or the building infrastructure.
- Client Retention: In the Multi-Tenant WiFi sector, property managers renew contracts with providers who offer transparency and rapid answers. Shared evidence builds trust; defensive arguments destroy it.
- Resource Optimisation: Highly paid Level 3 network engineers spend their time engineering solutions, rather than manually proving the network is functioning correctly.
關鍵定義
平均證明無罪時間 (Mean Time to Innocence, MTTI)
特定 IT 團隊使用客觀數據證明其網域或基礎設施並非回報事件之根本原因所需的平均時間。
對於必須向物業經理和 ISP 證明其服務無誤的託管 WiFi 供應商而言至關重要。
平均識別時間 (Mean Time to Identify)
追蹤從偵測到事件到發現實際根本原因所經歷之總時間的組織級指標。
MTTI 是此指標的子集。縮短 MTTI 可直接減少整體的識別時間。
模擬測試 (Synthetic Checks)
模擬使用者流量(例如 DNS 查詢、HTTP 請求)以主動監控網路健康狀況的自動化持續測試。
用於證明在使用者投訴的確切時刻,WiFi 層運作正常。
逐躍路徑可視性 (Hop-by-Hop Path Visibility)
逐個節點追蹤從用戶端到目的地的網路流量,並測量每個特定路由器或交換器之延遲與丟包的遙測技術。
對於證明故障存在於 ISP 網路或房東的分發交換器,而非託管 WiFi 硬體中至關重要。
流量數據 (NetFlow/IPFIX)
提供流量對話摘要的網路協定數據,顯示來源、目的地、協定和流量大小。
用於證明特定應用程式流量已成功離開本地網路。
隨選封包擷取 (On-Demand Packet Capture, PCAP)
從存取點或交換器遠端記錄原始網路流量以進行鑑識分析的能力。
用於證明伺服器端錯誤或用戶端裝置異常行為的終極證據。
爆炸半徑 (Blast Radius)
特定事件的影響範圍(例如:單一使用者、單一 AP、單一交換器、單一租戶或整棟建築)。
透過拓撲對照確定爆炸半徑,是從調查中排除健康基礎設施的最快方法。
事件關聯 (Event Correlation)
在單一時間軸上重疊不同的數據流(日誌、警報、更新)以識別因果關係的實踐方法。
用於證明網路中斷是由第三方變更(例如未通知的 ISP 維護期)所引起。
範例
一家擁有 350 間客房的飯店回報,全館的客房內 WiFi 速度都很慢。前台將責任歸咎於託管 WiFi 供應商。您要如何證明網路無誤並找出根本原因?
- 檢查主動式探測:DNS 和 HTTP 可達性測試顯示 AP 與網際網路的連線正常。2. 審查拓撲圖:此問題影響了所有交換器上的所有 AP,排除了邊緣硬體的問題。3. 執行路徑追蹤:追蹤顯示飯店 LAN 內的延遲為 2 毫秒,但在第三跳(ISP 的聚合路由器)延遲達到 180 毫秒。4. 匯出證據:將路徑追蹤螢幕截圖傳送給飯店經理和 ISP。
一家全國性零售商回報,某一區域的銷售點(POS)終端機與付款處理商的連線中斷。網路團隊被指責為防火牆或路由設定錯誤。
- 隔離受影響範圍:確認僅 POS 終端機(特定 VLAN)受到影響;訪客 WiFi 和後勤系統皆正常。2. 分析流量數據:NetFlow 確認目的地為付款處理商 IP 範圍的流量已成功離開商店路由器。3. 擷取封包:在 POS VLAN 上進行隨選 PCAP 擷取,顯示付款處理商的伺服器正在傳送 TCP 重設(RST)。4. 與付款處理商的支援團隊分享 PCAP。
練習題
Q1. 共享工作空間中的某個租戶抱怨無法存取其企業 VPN。其他租戶則能正常瀏覽網際網路。證明 WiFi 網路沒有問題最有效率的方法是什麼?
提示:考慮影響範圍(blast radius)以及失敗的特定流量類型。
查看標準答案
首先,使用拓撲圖確認影響範圍僅限於單一使用者或特定服務,排除一般的 AP 或交換器故障。其次,分析該用戶端 IP 位址的流量數據(NetFlow/IPFIX)。如果流量數據顯示 VPN 流量(例如 UDP 500 或 TCP 443)已正常離開網路,則 WiFi 和 LAN 是無辜的。問題出在用戶端的 VPN 設定,或是企業防火牆阻擋了該連線。
Q2. 您的監控儀表板顯示某個 AP 已離線,但物業經理堅持認為 WiFi 壞了是因為 ISP 斷線。您如何證明問題是內部電源,而非 ISP?
提示:尋找基礎設施狀態與外部事件之間的關聯性。
查看標準答案
使用事件關聯與拓撲對照。如果拓撲圖顯示只有一個 AP 離線,而同一台交換器上的其他 AP 運作正常,則 ISP 線路顯然是正常的。事件關聯可能會顯示連接到該特定 AP 的交換器連接埠有 PoE(乙太網路供電)故障記錄。這證明了問題出在本地硬體或佈線,而非 WAN 線路。
Q3. 體育場營運總監聲稱,由於驗票機停止運作,中場休息期間 WiFi 發生故障。您需要在兩分鐘內證明網路無誤。您會使用什麼遙測數據?
提示:您需要該報告故障確切時刻的網路健康狀況歷史證明。
查看標準答案
從持續的主動模擬測試(synthetic checks)中提取歷史數據。向營運總監展示儀表板,確認在確切的 15 分鐘中場休息期間,AP 成功解析了 DNS,並以低延遲連線至票務伺服器的 IP 位址。這立即證明了無線網路是健康的,並將調查方向轉移到票務應用程式伺服器,後者很可能是在瞬間的高負載下崩潰了。
繼續閱讀本系列
為多租戶辦公大樓設計 WiFi 網路
本指南為 IT 經理、網路架構師和 CTO 提供了一個與廠商無關的藍圖,用於在多租戶辦公大樓中設計具備擴充性、安全且隔離的 WiFi 網路。內容涵蓋 IEEE 802.1Q 下的 VLAN 區隔、透過 802.1X 和 RADIUS 進行的動態 VLAN 分配、高密度環境的 RF 規劃,以及 GDPR 和 PCI DSS 規範下的合規性考量。場域營運商和建築經理將能從中獲得具可行性的架構指引、真實案例研究,以及在部署前應避免的設定陷阱。
共享 WiFi 基礎設施的法律與合規要求
本權威技術參考指南概述了部署和管理共享 WiFi 基礎設施的關鍵法律、法規和架構要求。它為 IT 經理、網路架構師和場地營運商提供了實用的框架,以確保使用企業標準實現強大的數據保護、嚴格的支付安全合規性以及高效能的租戶隔離。
共同工作空間中的頻寬管理與服務品質 (QoS)
本指南為 IT 經理、網路架構師和場域營運總監提供權威的技術參考,介紹如何在共同工作環境中部署強健的頻寬管理與服務品質 (QoS) 架構。內容詳細說明網路分段、流量優先級排序、與廠商無關的設定以及實際的 ROI 指標,以提供企業級的連線品質。本指南涵蓋 IEEE 802.11e/WMM 標準、VLAN 設計、單一用戶限速以及具備可衡量業務成效的疑難排解策略。