
Mean Time to Innocence: Wie Sie beweisen, dass es nicht am WiFi liegt
Die Mean Time to Innocence (MTTI) ist die entscheidende Kennzahl dafür, wie viel Zeit IT-Teams damit verbringen, zu beweisen, dass ein Netzwerkproblem nicht ihre Schuld ist. Dieser Leitfaden beschreibt eine fünfstufige Observability-Methodik, um gegenseitige Schuldzuweisungen in Multi-Tenant-Umgebungen zu eliminieren und das Fingerzeigen durch gemeinsame Beweise zu ersetzen, um die Mean Time to Resolution (MTTR) zu senken.
Diesen Leitfaden anhören
Podcast-Transkript ansehen
📚 Teil unserer Kernserie: Multi-Tenant WiFi Guide →
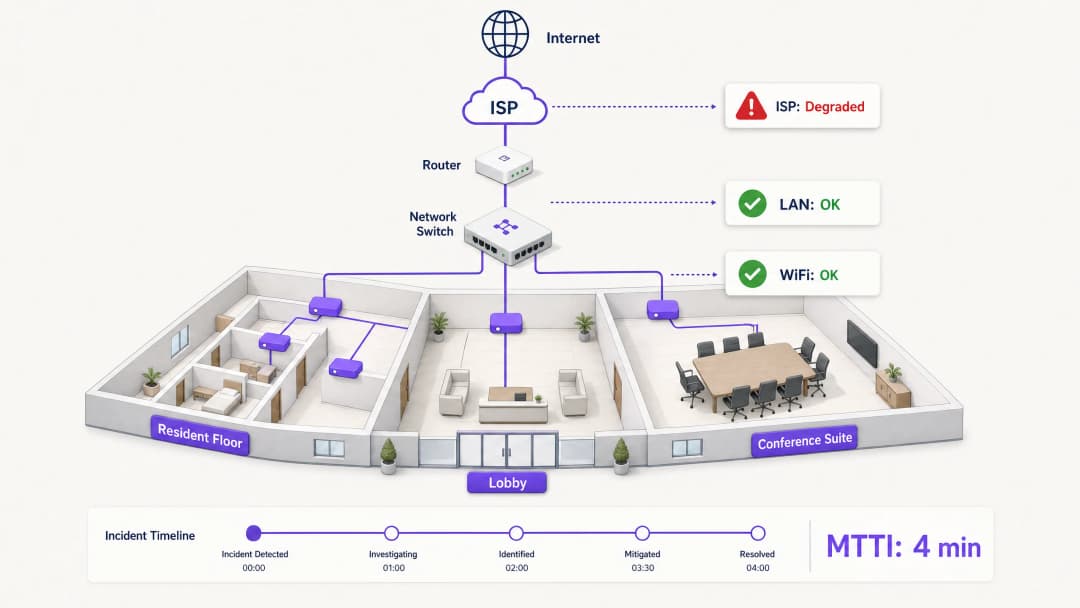
Executive Summary
When connectivity drops in a multi-tenant environment, the WiFi gets blamed first. It is the visible edge of the network, the last hop before the device, and the easiest target for frustrated users. For IT managers, network architects, and venue operations directors, this creates a persistent operational tax: the time spent proving innocence.
Mean time to innocence (MTTI) measures the average elapsed time between an incident being reported and a team's ability to demonstrate that their domain is not the root cause. In complex environments like build-to-rent (BTR) blocks, hotels, or conference centres, the network is fragmented across property managers, managed WiFi providers, and internet service providers (ISPs). Without definitive telemetry, MTTI inflates mean time to resolution (MTTR) as teams argue over responsibility rather than fixing the fault.
This guide details a five-step observability methodology to systematically reduce MTTI. By deploying continuous synthetic checks, hop-by-hop path visibility, flow data analysis, topology mapping, and event correlation, you can replace adversarial finger-pointing with shared evidence. The goal is not to win the blame game faster, but to end it entirely.
Technical Deep-Dive: The Mechanics of MTTI
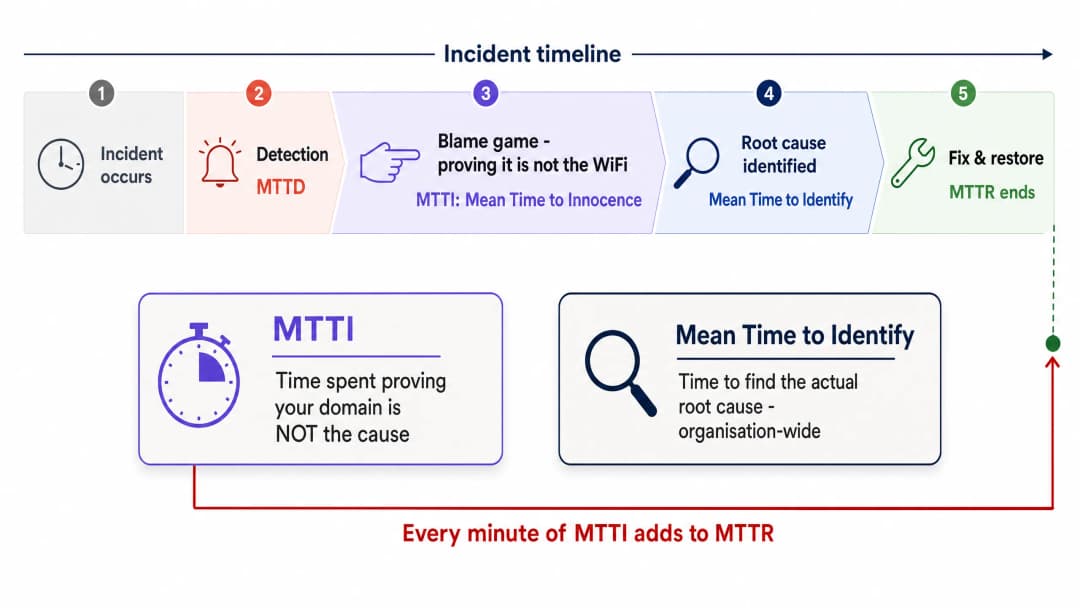
The Distinction Between MTTI and Mean Time to Identify
It is vital to separate MTTI from mean time to identify. Mean time to identify is an organisation-wide metric tracking how long it takes to find the actual root cause of an outage. MTTI is a siloed, domain-specific metric tracking how long it takes one team to prove they are not the culprit.
Every minute of MTTI adds directly to MTTR. If a managed WiFi provider spends 40 minutes manually checking access points (APs) and switch logs before concluding the issue lies with the ISP, the MTTR has a 40-minute penalty built in before the actual remediation even begins.
Why the WiFi Takes the Blame
In environments serving 350 million unique users across 80,000+ live venues, Purple sees the same pattern repeatedly. The WiFi layer is blamed by default due to three structural realities:
- Visibility bias: The WiFi signal indicator is the only network diagnostic tool available to the average venue user.
- Edge proximity: As the final hop to the client device, WiFi inherits the symptoms of every upstream failure. A DNS timeout at the ISP looks identical to an AP failure from the user's perspective.
- Telemetry gaps: Historically, proving wireless health required manual intervention. If you cannot show a clean bill of health for the wireless layer in under two minutes, you lose the narrative.
The Multi-Tenant Complication
In a single-tenant enterprise, network teams own the stack from the AP to the firewall. In Multi-Tenant WiFi environments, ownership is fractured.
A BTR resident pays the property manager. The property manager contracts a managed WiFi provider. The managed WiFi provider relies on a third-party ISP circuit and, often, the landlord's in-building distribution network. When a resident cannot stream video, the provider must rapidly exonerate the WiFi hardware (Cisco Meraki, HPE Aruba, Ruckus, or Juniper Mist) and isolate the fault to the client device, the building switch, or the ISP. Failure to do so damages the commercial relationship between the provider and the property manager.
Implementation Guide: The 5-Step Methodology
To systematically reduce MTTI, implement this five-layer observability architecture.
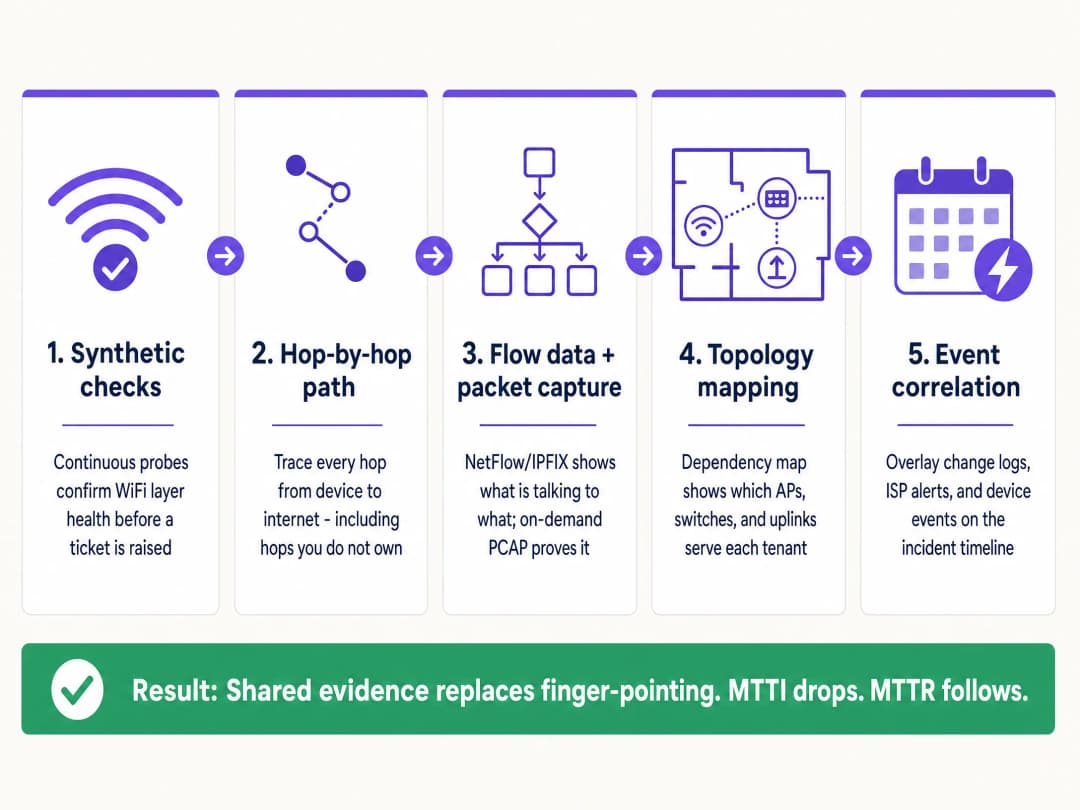
1. Continuous Synthetic Checks
Do not wait for a user to complain. Deploy automated synthetic probes that continuously emulate user behaviour from the network edge.
- Implementation: Configure APs or dedicated sensors to run scheduled tests for DHCP response, DNS resolution, HTTP reachability, and authentication flows (such as 802.1X or Captive Portal logins).
- Outcome: When a ticket is raised, you check the synthetic dashboard first. If the probes show clean HTTP reachability at the exact time of the complaint, you immediately exonerate the WiFi layer and the WAN circuit, shifting focus to the specific client device or the target application.
2. Hop-by-Hop Path Visibility
Proving your hardware is healthy is insufficient if you cannot prove the path to the internet is clear.
- Implementation: Use path visualisation tools to trace traffic from the access layer across the LAN, through the demarcation point, and into the ISP network.
- Outcome: When latency spikes, a path trace reveals exactly which node introduced the delay. If hops one through four (your domain) show 2ms latency, and hop five (the ISP edge router) shows 150ms latency and 12% packet loss, you have definitive proof to hand to the ISP.
3. Flow Data and On-Demand Packet Capture
When users report application-specific failures, you need conversation-level visibility.
- Implementation: Export NetFlow or IPFIX data from your core switches or firewalls. Ensure your access layer hardware supports remote, on-demand packet capture (PCAP) without requiring an engineer on site.
- Outcome: Flow data proves whether traffic to a specific service is leaving your network cleanly. If it is, the network is innocent. If deeper forensic proof is required, a targeted PCAP on the specific VLAN provides undeniable evidence of TCP retransmissions or server-side resets.
4. Topology and Dependency Mapping
In a multi-tenant environment, isolating the blast radius is the fastest way to categorise a fault.
- Implementation: Maintain a live, dynamically updated dependency map linking every AP to its switch, uplink, and WAN circuit, mapped against tenant VLANs.
- Outcome: If a fault affects APs across multiple floors but only on a single switch, the issue is the switch. If it affects all APs but only one tenant's VLAN, it is a logical configuration issue. Rapid scoping prevents wasted effort investigating healthy infrastructure.
5. Event Correlation
Data without context prolongs investigations.
- Implementation: Feed change logs, ISP maintenance alerts, hardware firmware updates, and user tickets into a single timeline view.
- Outcome: Overlaying a spike in authentication failures with a Microsoft Entra ID certificate expiration event that occurred 10 minutes prior immediately identifies the root cause, bypassing the network hardware entirely.
Best Practices
- Standardise the Hardware Stack: Limit deployments to canonical enterprise vendors (Cisco Meraki, HPE Aruba, Ruckus, Juniper Mist, Ubiquiti UniFi, Cambium, Extreme, Fortinet) that expose APIs for synthetic testing and remote PCAP.
- Automate the Evidence: Configure your monitoring platform to automatically attach synthetic test results and path traces to ITSM tickets the moment they are created.
- Share the Dashboard: Provide property managers with read-only access to a high-level health dashboard. Transparency preempts the blame game.
- Track MTTI Formally: Measure the time between ticket creation and the moment your team provides evidence of innocence. Treat it as a primary KPI alongside MTTR.
Troubleshooting & Risk Mitigation
- Risk: The 'No Fault Found' Loop: Users report issues, but synthetic checks show green.
- Mitigation: The issue is likely device-specific or related to RF interference (co-channel interference or physical obstruction). Use client-side analytics to check the specific device's RSSI and roaming history.
- Risk: ISP Denial: The ISP refuses to accept the fault despite your evidence.
- Mitigation: Provide hop-by-hop path traces showing the exact IP address where packet loss begins. Share PCAPs demonstrating clean egress from your demarcation point. Hard data forces escalation past Level 1 support.
- Risk: Captive Portal Failures: Users blame the WiFi when the portal fails to load.
- Mitigation: Isolate the identity provider. Check the status of the integration (Microsoft Entra ID, Okta, Google Workspace). If the network allows pre-authentication traffic but the IdP times out, the network is innocent.
ROI & Business Impact
Reducing MTTI delivers measurable business value beyond simply saving engineering hours.
- Reduced MTTR: Stripping 40 minutes of finger-pointing from an incident directly reduces downtime, protecting revenue in retail and hospitality environments.
- SLA Compliance: Faster exoneration prevents unfair penalties being levied against the managed WiFi provider when the fault lies with the ISP or the building infrastructure.
- Client Retention: In the Multi-Tenant WiFi sector, property managers renew contracts with providers who offer transparency and rapid answers. Shared evidence builds trust; defensive arguments destroy it.
- Resource Optimisation: Highly paid Level 3 network engineers spend their time engineering solutions, rather than manually proving the network is functioning correctly.
Schlüsseldefinitionen
Mean Time to Innocence (MTTI)
Die durchschnittliche Zeit, die ein bestimmtes IT-Team benötigt, um anhand objektiver Daten nachzuweisen, dass sein Bereich oder seine Infrastruktur nicht die Ursache für einen gemeldeten Vorfall ist.
Kritisch für Managed-WiFi-Anbieter, die ihren Service gegenüber Hausverwaltungen und ISPs verteidigen müssen.
Mean Time to Identify
Die unternehmensweite Kennzahl, die die gesamte Zeitspanne von der Erkennung eines Vorfalls bis zur Entdeckung der tatsächlichen Ursache erfasst.
Die MTTI ist eine Teilmenge dieser Kennzahl. Eine Reduzierung der MTTI verkürzt direkt die gesamte Zeit bis zur Identifizierung.
Synthetic Checks
Automatisierte, kontinuierliche Tests, die den Benutzerverkehr emulieren (z. B. DNS-Abfragen, HTTP-Anfragen), um den Netzwerkzustand proaktiv zu überwachen.
Wird verwendet, um zu beweisen, dass die WiFi-Ebene genau in dem Moment korrekt funktionierte, als sich ein Benutzer beschwerte.
Hop-by-Hop Path Visibility
Telemetrie, die den Netzwerkverkehr Knoten für Knoten vom Client zum Ziel verfolgt und Latenz sowie Paketverlust an jedem spezifischen Router oder Switch misst.
Unerlässlich für den Nachweis, dass ein Fehler im ISP-Netzwerk oder im Verteiler-Switch des Vermieters liegt und nicht in der Managed-WiFi-Hardware.
Flow Data (NetFlow/IPFIX)
Netzwerkprotokolldaten, die eine Zusammenfassung der Datenverkehrsverbindungen liefern und Quelle, Ziel, Protokoll und Volumen anzeigen.
Wird verwendet, um zu beweisen, dass der Datenverkehr einer bestimmten Anwendung das lokale Netzwerk erfolgreich verlässt.
On-Demand Packet Capture (PCAP)
Die Möglichkeit, den rohen Netzwerkverkehr von einem Access Point oder Switch für forensische Analysen aus der Ferne aufzuzeichnen.
Der ultimative Beweis, um serverseitige Fehler oder Fehlverhalten von Client-Geräten nachzuweisen.
Blast Radius
Der Umfang der Auswirkungen eines bestimmten Vorfalls (z. B. ein Benutzer, ein AP, ein Switch, ein Mieter oder das gesamte Gebäude).
Die Bestimmung des Schadensradius über die Topologie-Zuordnung ist der schnellste Weg, um funktionierende Infrastruktur aus einer Untersuchung auszuschließen.
Event Correlation
Die Praxis, verschiedene Datenströme (Protokolle, Warnmeldungen, Updates) auf einer einzigen Zeitachse zu überlagern, um Ursache und Wirkung zu identifizieren.
Wird verwendet, um zu beweisen, dass ein Netzwerkausfall durch die Änderung eines Drittanbieters verursacht wurde, beispielsweise durch ein unangekündigtes ISP-Wartungsfenster.
Ausgearbeitete Beispiele
Ein Hotel mit 350 Zimmern meldet, dass das WiFi in den Zimmern auf dem gesamten Gelände langsam ist. Die Rezeption gibt dem Managed-WiFi-Anbieter die Schuld. Wie entlasten Sie das Netzwerk und finden die Ursache?
- Synthetische Tests prüfen: DNS- und HTTP-Erreichbarkeitstests zeigen, dass die APs eine einwandfreie Verbindung zum Internet haben. 2. Topologie-Karte prüfen: Das Problem betrifft alle APs über alle Switches hinweg, was Edge-Hardware ausschließt. 3. Pfadverfolgung (Path Trace) ausführen: Der Trace zeigt eine Latenz von 2 ms im Hotel-LAN, aber 180 ms Latenz beim dritten Hop (dem Aggregations-Router des ISP). 4. Beweise exportieren: Senden Sie den Screenshot der Pfadverfolgung an den Hotelmanager und den ISP.
Ein nationaler Einzelhändler meldet, dass Point-of-Sale-Terminals (POS) in einer Region die Verbindung zum Zahlungsabwickler verlieren. Dem Netzwerkteam wird eine Firewall- oder Routing-Fehlkonfiguration vorgeworfen.
- Schadensradius (Blast Radius) isolieren: Bestätigen Sie, dass nur POS-Terminals (spezifisches VLAN) betroffen sind; das Gäste-WiFi und die Back-Office-Systeme funktionieren einwandfrei. 2. Flow-Daten analysieren: NetFlow bestätigt, dass der für den IP-Bereich des Zahlungsabwicklers bestimmte Datenverkehr die Filial-Router erfolgreich verlässt. 3. Pakete erfassen: Ein On-Demand-PCAP im POS-VLAN zeigt, dass der Server des Zahlungsabwicklers TCP-Resets (RST) sendet. 4. Teilen Sie das PCAP mit dem Support-Team des Zahlungsabwicklers.
Übungsfragen
Q1. Ein Mieter in einem Coworking-Space beschwerst sich, dass er nicht auf sein Firmen-VPN zugreifen kann. Andere Mieter surfen problemlos im Internet. Was ist der effizienteste Weg, um zu beweisen, dass das WiFi-Netzwerk nicht schuld ist?
Hinweis: Berücksichtigen Sie den Schadensradius und die spezifische Art des fehlerhaften Datenverkehrs.
Musterlösung anzeigen
Verwenden Sie zunächst die Topologie-Karte, um zu bestätigen, dass der Schadensradius auf einen Benutzer oder einen bestimmten Dienst beschränkt ist, wodurch ein allgemeiner AP- oder Switch-Ausfall ausgeschlossen wird. Analysieren Sie zweitens die Flow-Daten (NetFlow/IPFIX) für die IP-Adresse dieses Clients. Wenn die Flow-Daten zeigen, dass der VPN-Verkehr (z. B. UDP 500 oder TCP 443) das Netzwerk sauber verlässt, sind WiFi und LAN unschuldig. Das Problem liegt entweder an der VPN-Konfiguration des Clients oder an der Unternehmens-Firewall, die die Verbindung blockiert.
Q2. Ihr Monitoring-Dashboard zeigt, dass ein AP offline gegangen ist, aber die Hausverwaltung besteht darauf, dass das WiFi defekt ist, weil der ISP ausgefallen ist. Wie beweisen Sie, dass das Problem an der internen Stromversorgung und nicht am ISP liegt?
Hinweis: Suchen Sie nach Korrelationen zwischen dem Infrastrukturstatus und externen Ereignissen.
Musterlösung anzeigen
Nutzen Sie Ereigniskorrelation und Topologie-Zuordnung. Wenn die Topologie-Karte zeigt, dass nur ein AP offline ist, während andere am selben Switch funktionieren, ist die ISP-Leitung eindeutig aktiv. Die Ereigniskorrelation könnte ein PoE-Fehlerprotokoll (Power over Ethernet) des Switch-Ports anzeigen, der mit diesem spezifischen AP verbunden ist. Dies beweist, dass das Problem an der lokalen Hardware oder Verkabelung liegt und nicht an der WAN-Leitung.
Q3. Ein Stadionbetriebsleiter behauptet, das WiFi sei in der Halbzeitpause ausgefallen, weil die Ticket-Scanner nicht mehr funktionierten. Sie müssen das Netzwerk in weniger als zwei Minuten entlasten. Welche Telemetriedaten nutzen Sie?
Hinweis: Sie benötigen einen historischen Nachweis über den einwandfreien Zustand genau im Moment des gemeldeten Ausfalls.
Musterlösung anzeigen
Rufen Sie die historischen Daten der kontinuierlichen synthetischen Tests ab. Zeigen Sie dem Betriebsleiter das Dashboard, das bestätigt, dass die APs genau während des 15-minütigen Halbzeitfensters erfolgreich DNS auflösten und die IP-Adresse des Ticket-Servers mit geringer Latenz erreichten. Dies beweist sofort, dass das drahtlose Netzwerk einwandfrei funktionierte, und verlagert die Untersuchung auf die Server der Ticket-Anwendung, die wahrscheinlich unter der plötzlichen Last zusammengebrochen sind.
Weiterlesen in dieser Reihe
Entwurf von WiFi Netzwerken für Bürogebäude mit mehreren Mietern
Dieser Leitfaden bietet IT-Managern, Netzwerkarchitekten und CTOs ein herstellerneutrales Konzept für den Entwurf skalierbarer, sicherer und isolierter WiFi Netzwerke in Bürogebäuden mit mehreren Mietern. Er behandelt VLAN-Segmentierung nach IEEE 802.1Q, dynamische VLAN-Zuweisung über 802.1X und RADIUS, RF-Planung für Umgebungen mit hoher Dichte sowie Compliance-Anforderungen unter GDPR und PCI-DSS. Betreiber von Veranstaltungsorten und Gebäudemanager finden hier praxisnahe Architektur-Richtlinien, reale Fallstudien und Konfigurationsfehler, die es vor der Bereitstellung zu vermeiden gilt.
Rechtliche und Compliance-Anforderungen für gemeinsam genutzte WiFi-Infrastrukturen
Dieser maßgebliche technische Leitfaden beschreibt die kritischen rechtlichen, regulatorischen und architektonischen Anforderungen für die Bereitstellung und Verwaltung gemeinsam genutzter WiFi-Infrastrukturen. Er bietet IT-Managern, Netzwerkarchitekten und Standortbetreibern praxisnahe Frameworks zur Gewährleistung eines robusten Datenschutzes, strenger Compliance bei der Zahlungssicherheit und einer leistungsstarken Mandantentrennung unter Verwendung von Enterprise-Standards.
Bandbreitenmanagement und Quality of Service (QoS) in Co-Working-Bereichen
Ein maßgebliches technisches Referenzhandbuch für IT-Manager, Netzwerkarchitekten und Betriebsleiter von Standorten zur Implementierung robuster Frameworks für Bandbreitenmanagement und Quality of Service (QoS) in Co-Working-Umgebungen. Dieses Handbuch beschreibt Netzwerksegmentierung, Datenverkehrspriorisierung, herstellerneutrale Konfigurationen und praxisnahe ROI-Kennzahlen für die Bereitstellung von Enterprise-Grade-Konnektivität. Es behandelt IEEE 802.11e/WMM-Standards, VLAN-Design, Ratenbegrenzung pro Benutzer sowie Fehlerbehebungsstrategien mit messbaren Geschäftsergebnissen.