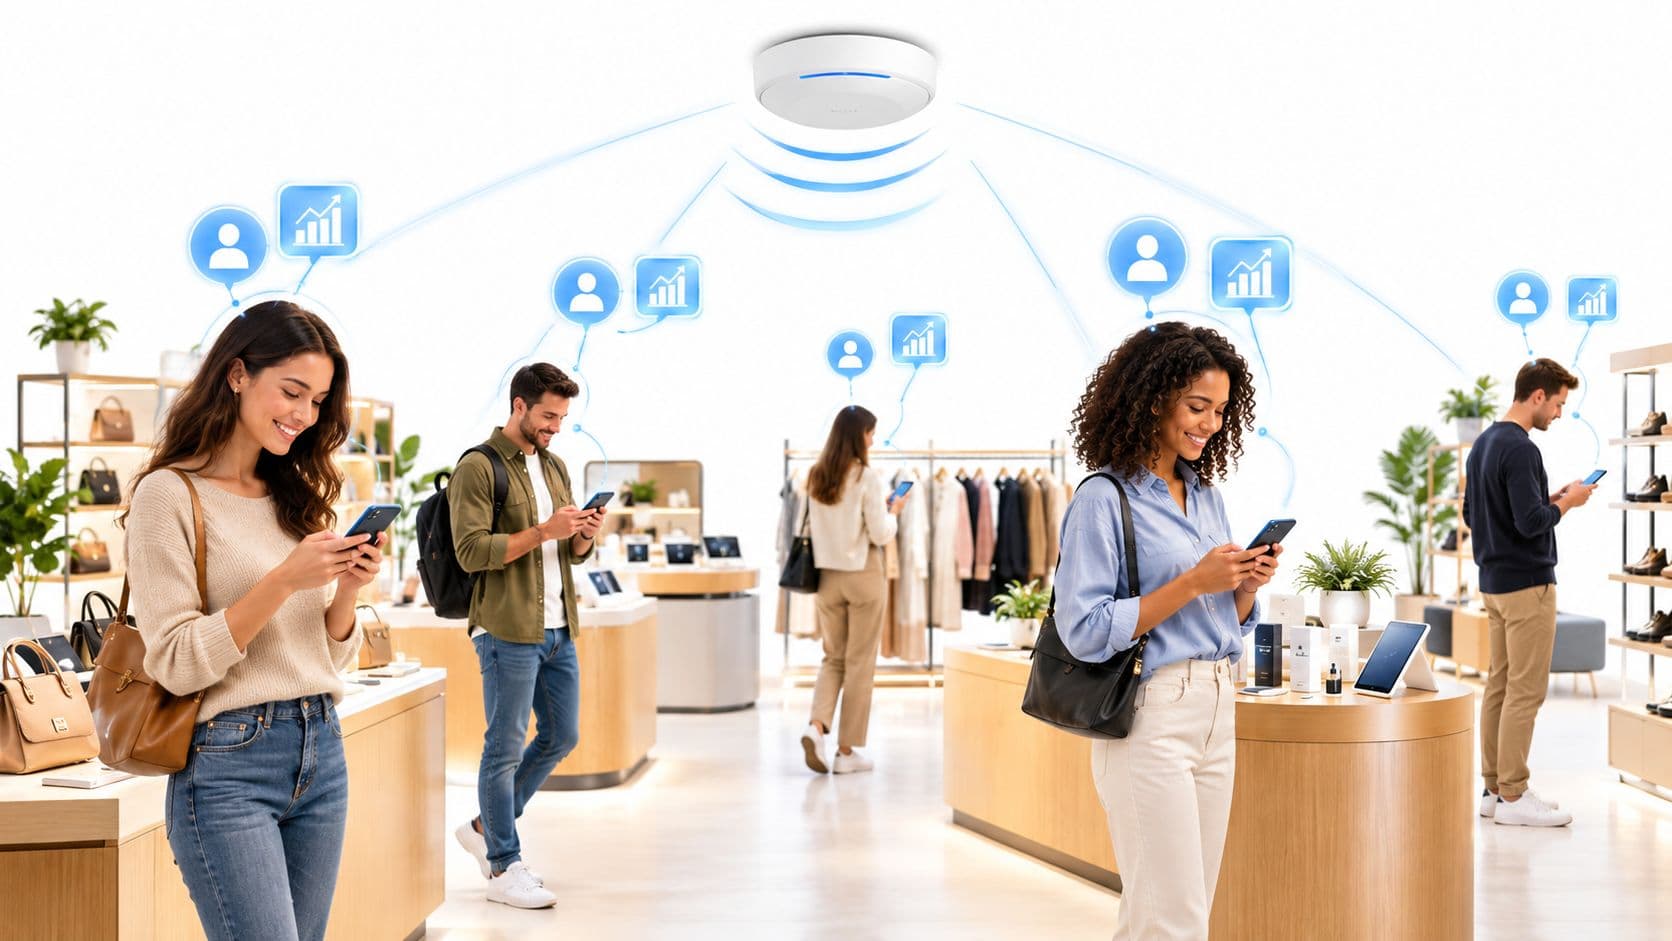

Imagine evaluating an eCommerce business without tracking visitor numbers, bounce rates, or conversion funnels. Operating a digital store without web analytics is unthinkable. Yet, for decades, operators of physical venues - including department stores, shopping centres, transport terminals, stadiums, and healthcare facilities - operated in near-total blindness regarding visitor behaviour.
Historically, brick-and-mortar analytics were restricted to manual clicker counts, infrared beam breakers, or crude turnstile records. These legacy tools reported how many bodies crossed a threshold, but they could not determine direction, visit frequency, dwell duration, or customer identity.
Today, enterprise WiFi analytics and spatial intelligence platforms transform existing wireless infrastructure into a continuous location intelligence sensor. Physical venue managers can now track, measure, and optimize offline spaces with the exact same mathematical rigor as web analytics.
Mapping digital web analytics to physical venue metrics
The foundational concepts of digital web analytics translate directly into physical space measurements. Understanding this parity allows commercial teams, marketers, and IT directors to speak a common data language.
| Digital Web Metric | Physical Space Equivalent | Measurement Method | Operational Application |
|---|---|---|---|
| Impressions / Search Traffic | Perimeter Footfall (Passers-by) | Unassociated WiFi probe frames detected outside venue boundary | Window display evaluation & outdoor advertising placement |
| Click-Through Rate (CTR) | Capture / Walk-Through Rate | Ratio of threshold entrants vs total perimeter passers-by | Storefront A/B testing & entrance layout optimization |
| Session Duration | Dwell Time (Minutes) | Continuous RSSI signal presence across internal AP zones | Merchandise engagement & concession sales correlation |
| Bounce Rate | Walk-Out / Rapid Exits | Entrants whose dwell time is under 3 minutes | Queuing bottlenecks, crowding issues, and staff shortages |
| Page Views & User Flows | Zone Trajectories & Heatmaps | Multi-AP RSSI trilateration and BLE beacon proximity | Aisle architecture, tenant lease pricing, and signage design |
| Newsletter / Form Conversion | Captive Portal CRM Opt-In | Guest WiFi onboarding registration with explicit consent | Automated SMS/email remarketing and loyalty programs |
How physical space analytics works technically
Capturing spatial intelligence in physical environments requires translating radio frequency physics into clean, deduplicated statistical data points. Physical analytics platforms operate on two parallel architectural tiers:
1. Passive presence detection via RSSI trilateration
Mobile smartphones continuously transmit 802.11 management frames, known as probe requests, seeking familiar wireless networks. Enterprise access points listen across the 2.4 GHz, 5 GHz, and 6 GHz spectrums to detect these transmissions.
When an AP hears a probe frame, it records the device identifier alongside the Received Signal Strength Indicator (RSSI) in decibel-milliwatts (dBm). By calculating the signal differential between three or more access points, the location engine computes an estimated physical coordinate (x, y, z):
- Perimeter filter (-85 dBm to -75 dBm): Identifies pedestrians moving past the exterior of the property.
- Threshold crossing (-70 dBm to -60 dBm): Confirms that a visitor has entered through the front doors or entry turnstiles.
- Zone proximity (-55 dBm and stronger): Pinpoints device dwell within a specific retail aisle, concession lounge, or gate area.
2. Overcoming MAC address randomisation
To prevent unauthorized device fingerprinting, modern smartphone operating systems (iOS Private WiFi Address and Android Randomized MAC) rotate unassociated MAC addresses at periodic intervals. While this prevents tracking anonymous individuals over long multi-week periods without consent, enterprise analytics engines employ statistical modeling to maintain high aggregate accuracy:
- Session windowing algorithms: Correlate burst timing, sequence numbers, and signal strength vectors to track single visit sessions accurately.
- Aggregate trend analysis: Delivers 95%+ precision for total hourly footfall, median dwell time, and zone density distribution.
- Deterministic authentication: When visitors log in through the venue captive portal, their device is authenticated, allowing compliant first-party profile creation across subsequent visits.
Core operational use cases for venue analytics
Physical space analytics moves far beyond simple footfall reporting. Multi-site operators utilize location data to solve complex commercial and operational challenges:
1. Dynamic staffing and labor optimization
In retail and hospitality, staff payroll represents one of the largest operating expenses. Under-staffing leads to long checkout lines and high bounce rates; over-staffing creates wasted payroll. By comparing historical footfall and dwell heatmaps against sales transaction timestamps, managers align staff rosters with real peak traffic hours, reducing wasted labor hours by up to 14%.
2. Quantifying tenant value and concession leasing
For shopping mall operators, airport concession managers, and stadium organizers, real estate leasing value depends on foot traffic exposure. WiFi spatial heatmaps provide verifiable data on foot traffic density across specific walkways, allowing property managers to justify premium rental rates for high-traffic anchor zones.
3. A/B testing physical store layouts and displays
In digital marketing, A/B testing is routine. In physical venues, WiFi analytics makes offline split testing possible. Retailers can modify window displays, reposition promotional end-caps, or test new entrance configurations in select stores while using other branches as control groups, measuring the precise impact on capture rate and dwell duration.
4. Automated visitor remarketing and loyalty activation
By connecting guest WiFi authentication with location intelligence, venues trigger automated marketing workflows based on real physical behaviour. For example, a customer who visits three times in a month without making a concession purchase can automatically receive a digital voucher via SMS or email when their device connects to the network.
Multi-vendor hardware compatibility
Deploying physical venue analytics does not require installing expensive proprietary hardware sensors across your buildings. Purple integrates directly into enterprise wireless access points and network controllers via cloud APIs and native syslog data streams:
| Network Vendor | Supported Architecture | Telemetry Protocol | Deployment Type |
|---|---|---|---|
| Cisco Catalyst / DNA Spaces | Catalyst 9800 WLC, CMX, Spaces | Cloud REST API & Streaming gRPC | Zero hardware cloud connector |
| Cisco Meraki | MR Series Access Points | Scanning API (JSON POST) & RADIUS | Native Dashboard Webhook |
| HPE Aruba Networking | Aruba Central, AOS-10, AirWave | Websocket Telemetry & ALE API | Zero hardware cloud connector |
| Ruckus Wireless (CommScope) | SmartZone (vSZ/SZ), Ruckus One | SPOT Location API & Syslog | Direct API Integration |
| Juniper Mist | Mist AP Series (vBLE Array) | Location Webhooks & Cloud API | Cloud-to-Cloud Integration |
| Extreme Networks | ExtremeCloud IQ (XIQ) | Presence API & RADIUS | Cloud API Connector |
Data privacy and regulatory compliance
Collecting physical location data requires strict adherence to international privacy regulations, including GDPR (Europe and UK), CCPA/CPRA (California), and LGPD (Brazil). Operating a compliant physical analytics deployment requires three core architectural safeguards:
- Cryptographic hashing and anonymization: Unassociated MAC addresses are hashed using irreversible cryptographic algorithms with rotating salts before database storage, ensuring raw hardware addresses cannot be reverse-engineered.
- Explicit captive portal consent: Personal identifiers (names, email addresses, phone numbers) are only captured when guests explicitly opt in on the captive portal, backed by unbundled checkboxes and clear terms of service.
- Automated data subject access requests (DSAR): Enterprise platforms provide automated portal tools allowing consumers to view, export, or delete their historical visit profiles in compliance with data privacy mandates.
Summary: Transforming physical venues into intelligent spaces
Physical space analytics bridges the longstanding intelligence gap between online digital properties and brick-and-mortar venues. By converting passive RF signals and guest captive portal authentication into structured metrics - including footfall volume, capture rates, dwell times, and bounce rates - organizations unlock the data needed to streamline operations and boost revenue.
Whether you manage a national retail chain, an international airport terminal, or a university campus, your existing enterprise wireless network is ready to deliver actionable spatial intelligence.
To evaluate your venue network compatibility, design a custom location architecture blueprint, or explore how Purple powers location analytics for over 80,000 venues worldwide, speak to our technical team today or explore our comprehensive WiFi analytics guide.