Interactive planning tool
Customer footfall & location analytics ROI calculator
Estimate your physical visitor tracking coverage, captive portal lead acquisition, and projected revenue gains from WiFi location analytics.
12 sites
Multi-venue estates can track customer cross-pollination.
18,000
Total visitors entering the venue physical footprint.
22%
Guest portals typically see 18% to 35% of visitors log in.
£48
Customer transaction value used to calculate re-engagement yield.
25 mins
Longer dwell times enable richer zone pathway and heat map tracking.
6
Footfall counts visits. This divides them into distinct people, so a returning customer is not counted as a new CRM record.
Technical deployment blueprint
Hardware density recommendation~3 enterprise access points per venue (36 total) deployed across perimeter entryways and core dwell zones.
Location tracking methodologyDual-layer RSSI probe trilateration for unassociated devices (counts are estimates, since phones randomise their MAC addresses) combined with authenticated captive portal sessions. MAC addresses are personal data under UK GDPR, so they are hashed and reported in aggregate.
Pillar guidance & integrationExplore comprehensive best practices in our WiFi analytics guide and guest WiFi guide.
Deploy footfall analytics on your existing WiFi network
Purple is hardware-agnostic and connects directly to Cisco Meraki, HPE Aruba, Ruckus, Juniper Mist, Ubiquiti UniFi, Cambium, Extreme and Fortinet. Speak with our venue analytics specialists to benchmark footfall across your locations.
Useful? Link to this tool
Interactive planning tool
Footfall tracking technology and ROI advisor
Evaluate sensor architectures, calculate passer-by versus in-store footfall, and project data capture ROI.
Estimated annual data value
£328,961
Optimal footfall stack: cloud WiFi presence analytics plus captive identity
Measure storefront window-to-entrance conversion, optimise merchandise floor layouts, and re-engage browsing shoppers.
Hardware deployment cost
Zero additional hardware
Meraki Scanning API location streamingTotal monthly probed devices
13,200
88% detection coverageOptical people counter capex
£1,800
1 doorway sensors required| Measurement technology | Primary use case | Spatial coverage | Dwell time tracking | Repeat visitor identity |
|---|---|---|---|---|
| WiFi presence analytics (Purple) | Whole-venue journeys, dwell time, CRM opt-ins | 100% of WiFi coverage area | Continuous across all zones | Consented email/phone identity |
| 3D stereo overhead cameras | Precise doorway line-crossing counts | 3 - 5m entrance threshold only | Limited to camera field of view | None (anonymous count only) |
| Thermal people counters | Basic doorway heat-signature counting | Direct doorway line | None | None |
| Bluetooth low energy (BLE) beacons | Micro-proximity trigger (e.g. within 1m) | Localised radius (1 - 10m) | Zone-specific | Requires mobile app installed |
Useful? Link to this tool
Customer footfall tracking measures the volume, movement patterns, dwell time, and visit frequency of people navigating a physical venue. For retail stores, shopping centres, transport hubs, restaurants, and event stadiums, footfall data bridges the visibility gap between offline physical spaces and digital analytics.
Historically, venue managers relied on manual tally clickers or basic doorway beam counters to estimate foot traffic. In modern enterprise environments, footfall measurement has evolved into comprehensive location intelligence - analyzing outside passerby volume, storefront capture rates, multi-zone dwell times, and repeat visitor loyalty without manual counting.
This guide evaluates the six primary footfall tracking technologies available today, details their accuracy, coverage, and cost profiles, and explains how cloud WiFi presence analytics overlays onto existing network access points to deliver real-time venue intelligence.
---
## Direct answer: how is customer footfall tracked?
Customer footfall is tracked by deploying physical or wireless sensors that detect when individuals enter, move through, and exit designated zones. The six core technologies used across commercial spaces are:
1. **WiFi Presence and Location Analytics:** Detects probe requests and RSSI signal strength emitted by mobile devices to measure passerby traffic, entrance conversion, zone dwell time, and repeat visits across the entire venue.
2. **3D Stereo Overhead Optical Cameras:** Mounts above entrance doorways to count bi-directional line crossings with 98%+ precision.
3. **Thermal Imaging Sensors:** Detects body heat signatures passing under doorway thresholds to provide anonymous entrance counts.
4. **Bluetooth Low Energy (BLE) Beacons:** Transmits localized radio signals for sub-metre micro-location and proximity interactions via branded mobile applications.
5. **Time-of-Flight (ToF) and LiDAR Sensors:** Uses pulsed laser arrays to generate real-time 3D spatial occupancy meshes in high-density environments.
6. **Infrared (IR) Break-Beam Counters:** Uses horizontal light beams across narrow doorways for basic single-file entry counting.
---
## The 6 customer footfall tracking technologies compared
### 1. WiFi Presence and Location Analytics
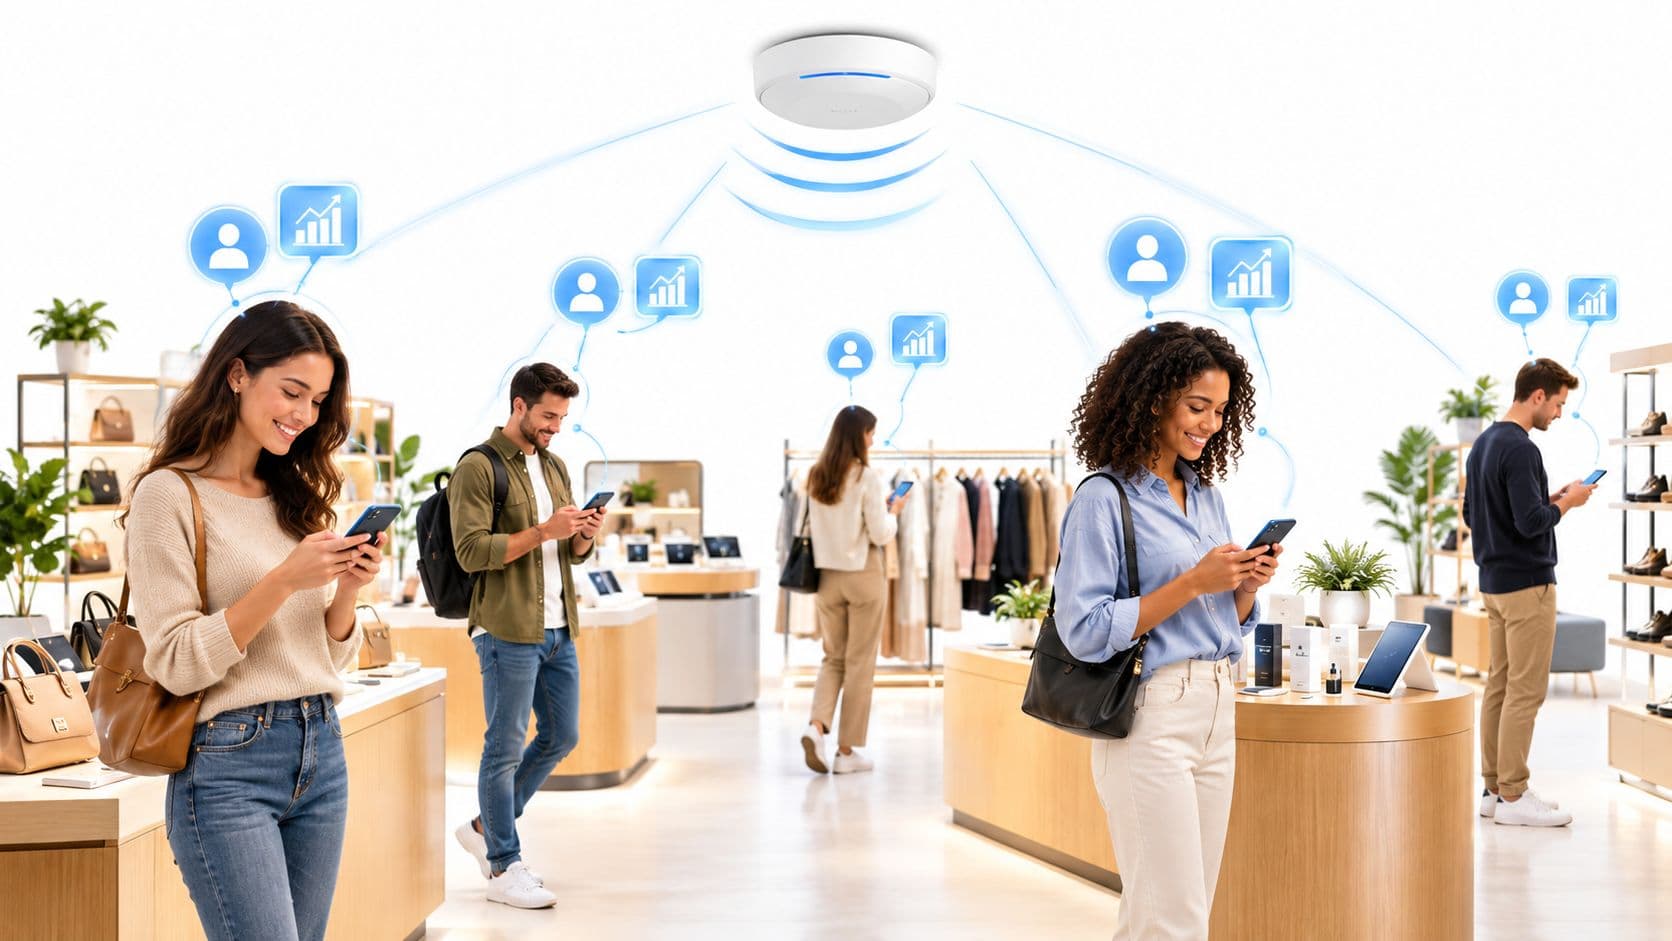
WiFi presence analytics uses your venue's existing wireless access points (APs) to capture 802.11 management frames - known as probe requests - broadcast by smartphones searching for available networks.
* **How it works:** When a mobile device approaches a venue, its WiFi radio periodically emits probe requests containing signal strength (RSSI) telemetry. Cloud analytics platforms like [Purple WiFi Analytics](/wifi-analytics-guide) process these signals across multiple APs, using mathematical trilateration and signal attenuation algorithms to determine visitor proximity, entrance capture, zone-level dwell time, and return visit frequency.
* **Spatial coverage:** Whole-venue coverage (100% of the WiFi footprint, both indoors and outdoor perimeter corridors).
* **Hardware requirement:** Zero additional hardware required if the venue already operates enterprise APs from Cisco Meraki, HPE Aruba Networking, Ruckus CommScope, Juniper Mist, Ubiquiti UniFi, Fortinet, or Extreme Networks.
* **Key advantage:** Captures the full visitor journey across multiple zones, tracks dwell times from 1 minute to several hours, measures outside passerby vs inside capture rates, and links with [guest WiFi captive portals](/captive-portal-guide) to generate consented CRM marketing profiles.
### 2. 3D Stereo Overhead Optical Cameras
3D stereo video counters are specialized ceiling-mounted devices equipped with dual optical lenses that create a depth-mapped field of view directly above doorways.
* **How it works:** Computer vision algorithms track the physical heads and shoulders of people crossing virtual tripwires, distinguishing between adults, children, shopping trolleys, and directional flow (in versus out).
* **Accuracy:** Extremely high (98% to 99%) for entrance line-crossing.
* **Limitations:** Line-of-sight restricted to the immediate doorway threshold (3 to 5 metres). Cannot measure in-store pathway circulation, aisle dwell time, cross-venue journeys, or repeat visitor frequency. High hardware capex (£1,200 to £2,500 per entrance door installed).
### 3. Thermal Imaging Sensors
Thermal people counters detect heat emitted by human bodies passing underneath ceiling-mounted thermal sensors.
* **How it works:** The sensor maps temperature differentials between human heat signatures and the background floor surface, registering a count when a heat source moves across an entrance boundary line.
* **Key advantage:** Inherently privacy-preserving because no identifiable facial features or optical images are captured.
* **Limitations:** Sensitive to environmental temperature shifts (e.g. glass storefronts in direct sunlight or open entrance air curtains), cannot track dwell times across wide floors, and provides no individual repeat visitor attribution.
### 4. Bluetooth Low Energy (BLE) Beacons
BLE technology relies on small, battery-operated radio transmitters placed at fixed points throughout a venue.
* **How it works:** Beacons emit continuous Bluetooth advertising signals. When a visitor with a compatible mobile app enters the beacon's range (1 to 10 metres), the app detects the signal and registers an interaction or triggers a location-aware push notification.
* **Key advantage:** High spatial precision for micro-location (e.g. standing directly in front of a specific retail cosmetic display or museum exhibit).
* **Limitations:** Requires the visitor to have installed a dedicated venue application with Bluetooth and location permissions enabled. Bluetooth beacon detection rates drop significantly for unmanaged general public footfall.
### 5. Time-of-Flight (ToF) and LiDAR Sensors
Time-of-Flight (ToF) optical sensors and LiDAR scanners emit invisible pulsed light beams and calculate the time taken for photons to bounce back from physical objects.
* **How it works:** By measuring millions of return points per second, LiDAR generates a real-time point-cloud mesh of physical space, tracking the exact speed, trajectory, and separation of individuals without capturing facial video.
* **Key advantage:** Operates in complete darkness, immune to lighting variations, and offers high accuracy in ultra-dense transit hubs and airport security queues.
* **Limitations:** Substantial infrastructure capex, specialized optical calibration requirements, and complex network data pipelines.
### 6. Infrared (IR) Break-Beam Counters
Infrared beam sensors represent the most basic electronic people-counting technology, consisting of a transmitter and receiver mounted horizontally across an entrance doorway.
* **How it works:** A count is registered whenever a person breaks the infrared light beam while walking through the doorway.
* **Key advantage:** Inexpensive and simple battery-powered installation for small single-door independent boutiques.
* **Limitations:** Inaccurate in high-traffic corridors where groups walk side-by-side (multiple people breaking the beam simultaneously register as one person), vulnerable to beam misalignment, and unable to measure dwell time or customer loyalty.
---
## Technology comparison matrix: accuracy, coverage, and cost
The table below summarizes how the six footfall tracking technologies compare across core operational criteria:
| Technology | Counting Accuracy | Spatial Coverage Area | Dwell Time Tracking | Repeat Visitor Identification | Hardware Capex | Deployment Complexity |
| :--- | :--- | :--- | :--- | :--- | :--- | :--- |
| **WiFi Presence Analytics (Purple)** | 88% - 94% (Probed) / 100% (Connected) | **Whole-Venue & Perimeter** | **Continuous across all zones** | **Yes (Consented CRM & hashed tokens)** | **Zero (Overlays on existing APs)** | **Low (Cloud API activation)** |
| **3D Stereo Overhead Cameras** | 98% - 99% | Entrance threshold only (3-5m) | Limited to doorway FOV | No (Anonymous counts) | High (£1,200 - £2,500 / door) | Medium (Ceiling cabling & mounting) |
| **Thermal People Counters** | 92% - 95% | Entrance doorway line | None | No | Medium (£800 - £1,500 / door) | Medium (Overhead wiring) |
| **BLE Beacons** | 90% - 95% (App users) | Micro-radius (1-10m) | Zone-specific (with app) | Yes (App user ID only) | Low to Medium (Battery beacons) | Medium (Beacon maintenance & SDK) |
| **Time-of-Flight / LiDAR** | 97% - 99% | Medium-range zones (10-30m) | Zone-level tracking | No | Very High (£3,000+ / sensor) | High (Optical calibration & compute) |
| **Infrared Break-Beam** | 70% - 80% | Narrow doorway only | None | No | Very Low (£100 - £300 / door) | Very Low (Battery stick-on) |
---
## Key footfall metrics every retail and venue operator must track
Measuring customer footfall is not just about raw entry headcounts. Modern venue intelligence combines spatial presence with behavioral metrics to drive actionable business outcomes:
### 1. Storefront capture rate (passerby conversion)
The ratio of people who walk past a venue versus those who actually turn and enter the store.
30636\text{Capture Rate (\%)} = \left( \frac{\text{In-Store Entrances}}{\text{Outside Passerby Footfall}} \right) \times 10030636
Tracking capture rate helps retail operations evaluate window display effectiveness, promotional merchandising, and exterior signage performance.
### 2. Dwell time distribution across zones
Total time spent by visitors inside specific commercial zones. WiFi presence analytics segments visitors into distinct intent cohorts:
* **Bouncers (< 5 minutes):** Quick visits, lost shoppers, or immediate exits.
* **Active Browsers (5 to 25 minutes):** Standard retail shopping and browsing behavior.
* **High-Intent / High-Value Visitors (> 25 minutes):** In-depth fitting room trials, sit-down dining, or assisted sales consultations.
### 3. Flow analysis and floor heatmaps
Visualizing the primary pathways visitors take from entry to checkout. Heatmaps identify dead zones with low visitor traffic, optimize aisle layouts, and provide physical tenant traffic attribution for shopping malls and transport hubs.
### 4. Repeat visit frequency and customer loyalty
Measuring how often unique visitors return over weekly, monthly, or quarterly periods. Correlating repeat physical footfall with point-of-sale (POS) spend allows operators to calculate true offline customer lifetime value (LTV).
### 5. Multi-location cross-pollination
For restaurant chains, hotel groups, and multi-store retailers, location analytics reveals how many customers visit multiple branches across a city or national portfolio.
---
## Privacy, GDPR compliance, and MAC randomisation
Operating ethical, legal footfall tracking requires strict adherence to international privacy regulations, including GDPR in Europe, the UK Data Protection Act, and CCPA/CPRA in the United States.
### How MAC randomisation works
Modern mobile operating systems - including Apple iOS 14+ (Private WiFi Address) and Android 10+ (MAC Randomization) - generate rotating, synthetic MAC addresses when scanning for unassociated WiFi networks. This prevents unauthorized third parties from tracking a device's global movements across public spaces.
### Privacy-safe presence analytics
Enterprise analytics platforms like Purple handle MAC randomisation in compliance with privacy laws:
* **Aggregate crowd counting:** Mathematical filtering algorithms detect and group rotating probe frames to measure aggregate crowd density and dwell trends without reconstructing private personal identities.
* **One-way cryptographic hashing:** All captured hardware identifiers are immediately hashed using salted cryptographic algorithms (SHA-256) before storage, ensuring no raw hardware MAC addresses remain in analytics databases.
* **Captive portal consent bridge:** When a visitor chooses to connect to the venue's [guest WiFi network](/guest-wifi-guide), they agree to transparent terms of service and privacy notices. This provides lawful GDPR Article 6 consent, allowing the platform to link physical visit frequency to their verified, opt-in CRM customer profile.
---
## 5-step deployment roadmap: turning existing WiFi into location intelligence
Transforming your physical venue into an intelligent, data-driven space does not require costly sensor installations:
1. **Audit existing wireless access points:** Verify that your venue operates enterprise-grade APs (such as Cisco Meraki MR, HPE Aruba, Ruckus, Juniper Mist, or Ubiquiti UniFi) with scanning radio capabilities.
2. **Connect cloud location APIs:** Enable northbound location data feeds or scanning APIs to stream anonymised presence telemetry to [Purple WiFi Analytics](/guest-wifi-marketing-analytics-platform).
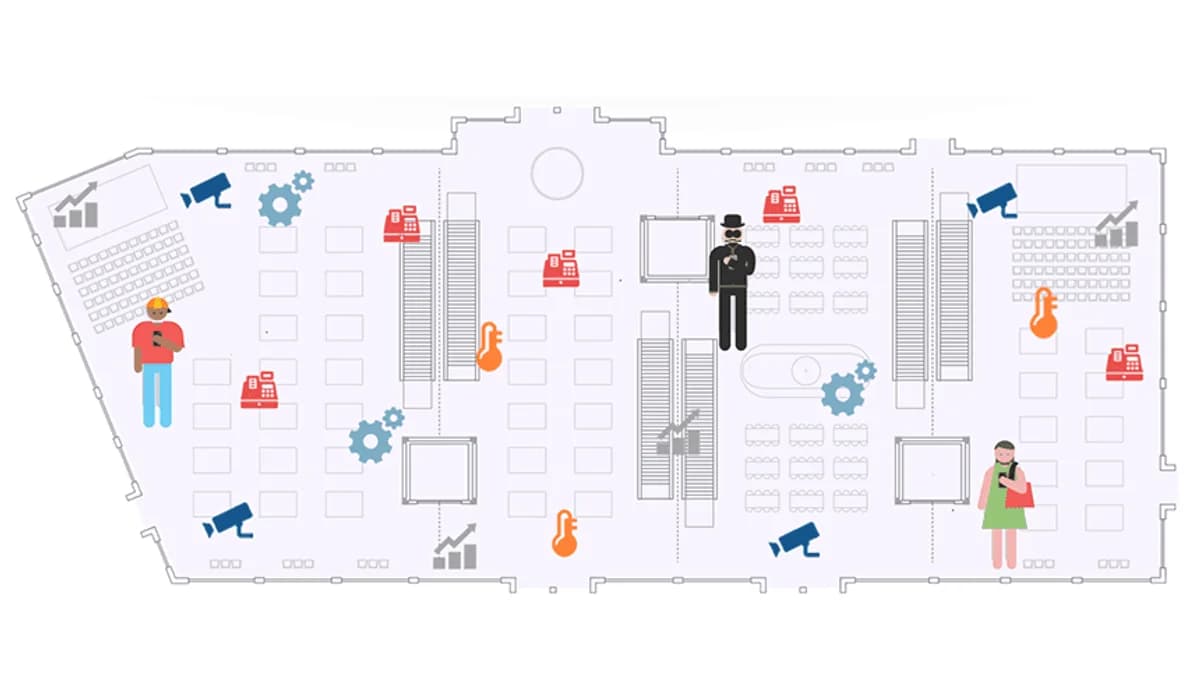
3. **Map physical venue zones:** Define polygon boundaries for entrance corridors, outside passerby sidewalks, main sales floors, dining areas, and checkout queues within the management portal.
4. **Deploy branded captive portal onboarding:** Launch a customized [captive portal splash screen](/captive-portal-guide) with social login, SMS verification, or email sign-in to capture opt-in customer records.
5. **Automate omnichannel marketing and CRM workflows:** Connect real-time footfall triggers to your CRM and marketing platforms (such as Salesforce, HubSpot, Klaviyo, or Mailchimp) to send automated welcome offers, post-visit review requests, and churn-prevention loyalty incentives.
---
## Frequently asked questions about customer footfall tracking
### How accurate is WiFi footfall tracking compared to optical people counters?
Overhead 3D optical cameras achieve 98% to 99% accuracy at counting line crossings through a specific doorway. WiFi presence analytics achieves 88% to 94% accuracy for overall crowd trends and 100% precision for connected users. While optical cameras count raw doorway crossings, WiFi analytics captures the entire customer journey across all floor zones, measures multi-hour dwell times, and identifies repeat visitors across multiple dates.
### Does footfall tracking work if visitors do not connect to the guest WiFi?
Yes. WiFi presence analytics detects probe request frames broadcast by smartphones that have WiFi turned on, even if the device never connects to the venue's SSID. This allows venues to measure outside passerby traffic, entrance conversion rates, and zone dwell times across unassociated visitors.
### How does Apple and Android MAC address randomisation affect footfall data?
When devices are not connected to WiFi, modern operating systems rotate their MAC addresses during probe scanning. Cloud analytics platforms use statistical smoothing and deduplication algorithms to calculate accurate aggregate footfall volume, dwell trends, and peak occupancy without compromising individual user privacy.
### Is customer footfall tracking legal under GDPR and CCPA?
Yes, provided the system is designed with privacy-by-design principles. Passive WiFi presence analytics processes anonymised, hashed telemetry for legitimate operational interest without storing personal data. For individualized tracking and marketing communication, venues capture explicit opt-in consent through a compliant guest WiFi captive portal.
### How do retailers calculate footfall capture rate?
Footfall capture rate is calculated by dividing the total number of people who enter a store by the total number of passerby foot traffic walking past the storefront during the same time window, multiplied by 100. For example, if 1,200 people enter a store from a corridor of 10,000 passersby, the capture rate is 12%.
---
## Turn physical footfall into actionable customer intelligence
Measuring customer footfall is the first step toward optimizing physical venue operations, increasing retail conversion, and building long-term customer loyalty.
By overlaying [Purple WiFi Analytics](/wifi-analytics-guide) onto your existing wireless network, you gain complete visibility into visitor volume, dwell times, and zone circulation without investing in proprietary camera hardware.
[Speak to a Purple venue specialist today](/speak-to-an-expert) to see how our cloud location analytics platform turns physical footfall into measurable business growth.