
Using Packet Capture (PCAP) to Diagnose Slow WiFi Performance
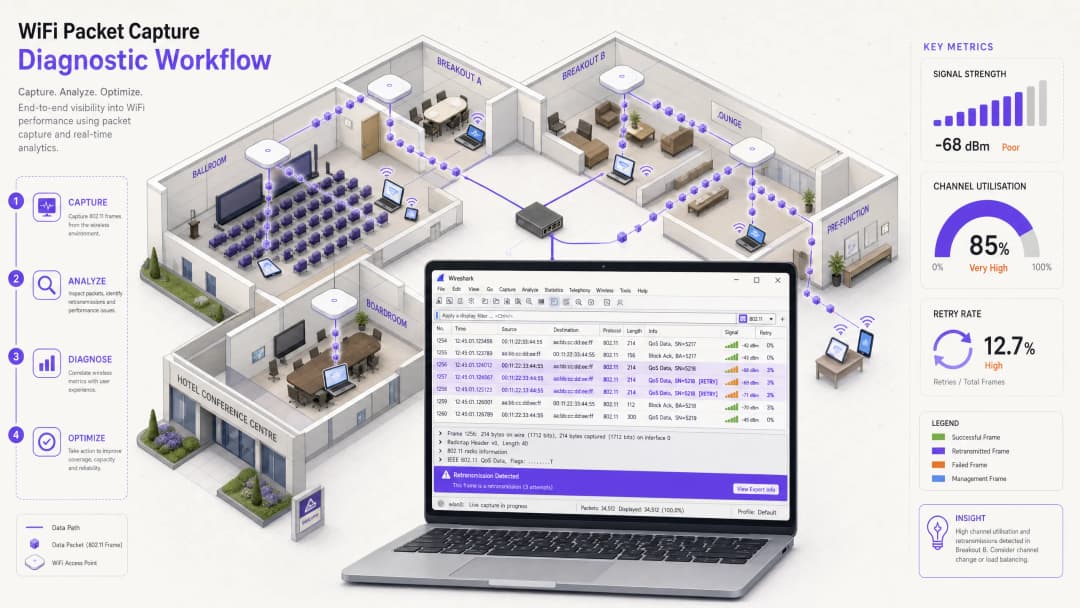
This technical reference guide provides IT managers, network architects, and venue operations directors with a structured, packet-level methodology to diagnose and resolve slow enterprise WiFi performance using Packet Capture (PCAP) analysis. By dissecting raw 802.11 frames - including retransmission rates, airtime utilization, and physical layer metadata - teams can isolate RF-layer bottlenecks from wired or application issues with precision. Applicable across high-density venues including hotels, retail chains, stadiums, and convention centers, this guide delivers actionable diagnostic workflows, real-world case studies, and configuration remediation steps to reclaim network capacity and protect guest experience.
Video overview
Listen to this guide
View podcast transcript
Part of our core series: Guest WiFi Guide →
Executive Summary
For Chief Technology Officers (CTOs), network architects, and venue operations directors, "slow WiFi" is a persistent threat to operational efficiency and guest satisfaction. While standard network management dashboards provide high-level health scores, they often obscure the root causes of wireless performance degradation. To troubleshoot chronic performance issues in high-density environments - such as hotel conference centers, shopping malls, and stadiums - IT teams must look beyond superficial metrics and directly analyze wireless frames.
Leveraging packet capture (PCAP) analysis is the definitive and most accurate method, allowing network engineering teams to perform a deep-dive analysis of the communication between client devices and access points at the physical and data link layers. This technical reference guide outlines a structured, vendor-neutral methodology for capturing and analyzing 802.11 frames. By focusing on critical indicators such as frame retransmission rates, channel utilization, and airtime starvation, network administrators can isolate wireless physical-layer issues from wired backhaul or application bottlenecks. By implementing these diagnostic methodologies, while also utilizing enterprise-grade solutions such as Guest WiFi and WiFi Analytics, a troublesome network utility can be transformed into a high-performance and high-ROI business asset.
Technical Deep-Dive
802.11 Medium and the Necessity of Monitor Mode
To accurately diagnose wireless performance, network architects must understand that the wireless medium is fundamentally different from a switched wired network. Wireless is a shared, half-duplex medium where only a single device can transmit on a channel at any given millisecond. Furthermore, standard wireless network interface cards (NICs) operate in "managed" or "station" mode, meaning they discard any frame not explicitly addressed to their own MAC address. To capture the complete picture of wireless communication, the capturing station must use an adapter configured in Monitor Mode.
Monitor Mode vs Promiscuous Mode: While promiscuous mode in wired networks allows the NIC to capture all packets on the local broadcast domain, it does not work for wireless frame headers. Monitor mode allows a wireless adapter to passively sniff all 802.11 frames in the air on a specific channel, enabling the capture of management and control frames, as well as data payloads, without being associated with an AP.
802.11 Frame Structure and the Radiotap Header
Every wireless packet captured in monitor mode is prepended with a Radiotap Header by the capturing driver. This header does not travel over the air; instead, it provides crucial physical-layer metadata captured by the sniffing radio NIC. Key physical-layer metrics include the channel and frequency (verifying that the capture was taken on the intended channel), signal strength in dBm (RSSI), and the data rate at which the specific frame was transmitted.
Beneath the Radiotap header lies the 802.11 MAC header, which classifies frames into three primary types:
| Frame Type | Primary Subtypes | Role in Performance Diagnostics |
|---|---|---|
| Management | Beacon, Probe Request/Response, Association, Deauthentication | High volume indicates coverage gaps, aggressive roaming, or legacy client overhead. |
| Control | ACK, Block ACK, RTS, CTS | Retransmissions (lack of ACK) indicate collisions or interference. RTS/CTS diagnoses hidden nodes. |
| Data | QoS Data, Null Function | High proportion of low-rate data frames indicates airtime starvation. |
Frame Retransmissions and Airtime Starvation
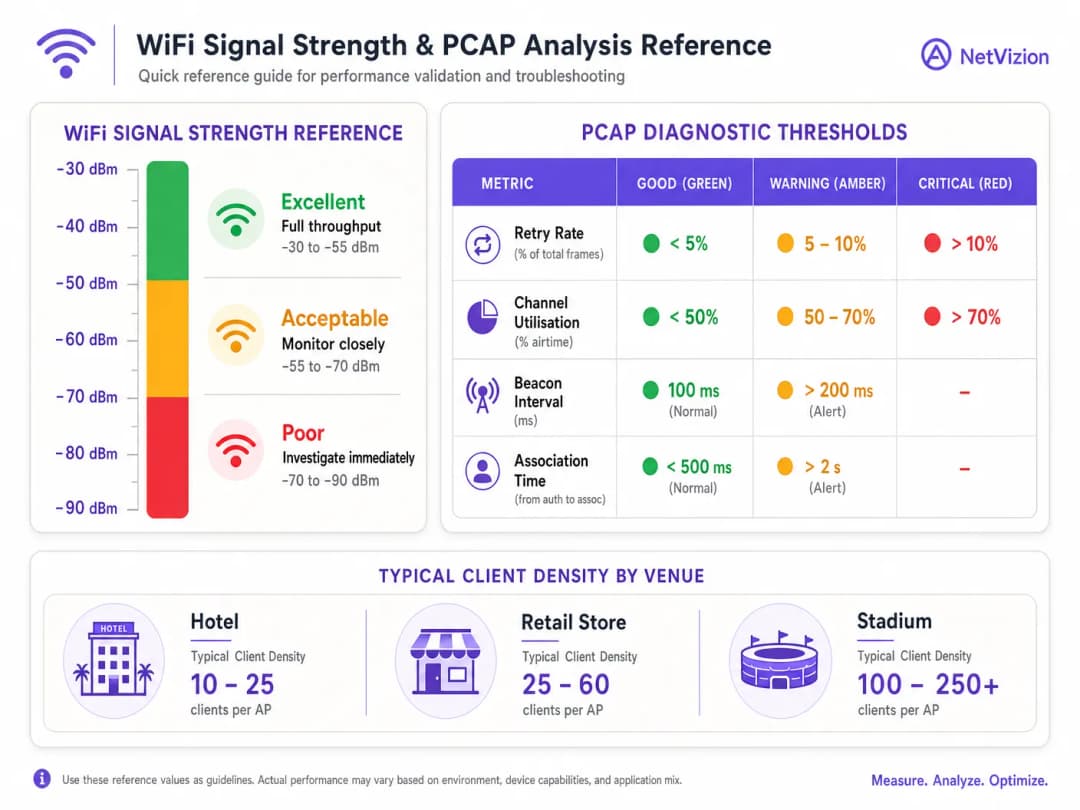
Since 802.11 lacks collision detection during transmission, it relies on positive acknowledgment. Every unicast frame must be acknowledged by the receiving radio with a control ACK frame. If the sender does not receive an ACK within a specific timeout window, it increments its retry counter and retransmits the frame. In a healthy enterprise deployment, the 802.11 Retry Rate should remain below 5%. A retry rate exceeding 10% causes a compounding degradation in throughput and latency.
Airtime starvation occurs when client devices with weak signal strength or legacy capabilities transmit data at low rates, such as 1 Mbps or 6 Mbps. Because these low-rate frames take significantly longer to transmit compared to high-rate 802.11ac/ax frames, a single distant client can consume a disproportionate share of the available airtime, starving nearby high-speed clients of the medium. This is one of the most common and misdiagnosed causes of slow WiFi in Hospitality and Retail environments.
Implementation Guide
Step-by-Step Wireless Packet Capture Workflow
To independently analyze and diagnose slow WiFi performance using PCAP, network engineering teams should follow this structured five-step diagnostic workflow.
 Step 1: Capture Setup and Channel Locking. Use a dedicated external USB wireless adapter that supports monitor mode. Identify the channel of the poorly performing AP using a site survey tool or the AP controller dashboard. Configure the sniffing adapter to monitor mode and lock it to that specific channel and channel width. Position the capturing laptop close to the affected client device to ensure the sniffer experiences the same RF environment.
Step 2: Verify Physical-Layer Health. Before analyzing higher-layer protocols, verify the physical-layer characteristics within the Radiotap header. Ensure the client's RSSI is at least -67 dBm and the noise floor is below -95 dBm, providing an SNR of 28 dB or greater to support high-density voice and data. Check if the client is transmitting at a low MCS (Modulation and Coding Scheme) index; if frames are consistently sent below MCS 2, the client is suffering from poor signal quality or physical obstructions.
Step 3: Filter and Analyze 802.11 Frames. Open the PCAP in Wireshark and apply specific display filters to categorize the issue. To isolate a specific client MAC address, use wlan.addr == [Client_MAC]. To filter for retransmissions, use wlan.fc.retry == 1. To monitor management frame overhead, use wlan.fc.type == 0. To inspect channel utilization, navigate to Statistics > I/O Graph and plot total packets per second against retry packets per second.
Step 4: Identify the Root Cause. Analyze the filtered data against established performance thresholds. A high retry rate exceeding 10% despite good signal strength indicates frame collisions caused by a Hidden Node issue or non-WiFi interference. Low data rates coupled with high airtime consumption indicate Airtime Starvation caused by legacy clients or distant devices. Excessive probe requests and responses indicate "sticky client" behavior or poor AP coverage boundaries.
Step 5: Apply Remediation and Retest. Based on the identified root cause, implement the appropriate configuration changes. Disable legacy data rates (1, 2, 5.5, 11 Mbps) and set the minimum basic rate to 12 Mbps or 24 Mbps. For hidden node issues, configure the RTS/CTS threshold on the AP. Adjust AP transmit power to mitigate co-channel interference. Run a follow-up PCAP to verify that the retry rate has dropped below 5% and average data rates have increased. For a deep-dive guide on authentication and access control, see How to Implement 802.1X Authentication with Cloud RADIUS.
Got questions about your specific setup?
Our team works with venue operators, IT managers, and network engineers across 80,000 venues. Book a 20-minute call and we will show you how others like you solved it.
Best Practices
When diagnosing enterprise networks, solutions architects should adhere to industry-standard, vendor-neutral best practices to ensure accurate diagnostics and long-term stability.
Leverage Intelligent and Triggered Captures. Continuous, full-packet capture across hundreds of APs requires prohibitive amounts of storage. Instead, leverage modern network management platforms that support triggered PCAPs. When a client experiences an association failure, high DHCP latency, or excessive 802.11 retries, platforms like Cisco Catalyst Center or Aruba Central can automatically trigger a rolling-buffer PCAP. This approach is highly relevant for Healthcare and Transportation environments where network reliability is mission-critical.
Isolate Wireless vs Wired Performance Bottlenecks. Always verify whether a "slow WiFi" complaint is genuinely a wireless issue. Compare the HTTP response time or TCP round-trip time (RTT) with the 802.11 retry rate in your PCAP. If the TCP RTT is high but the 802.11 retry rate is low (under 3%), the bottleneck lies in the wired network, DHCP server, DNS resolution, or WAN gateway. If the 802.11 retry rate is high (above 10%), the issue is strictly within the wireless RF domain.
Maintain Compliance and Security During Captures. Capturing raw wireless packets in public spaces or corporate environments can expose sensitive user data, potentially violating privacy regulations like the CCPA/CPRA or security standards like PCI DSS. In secure environments utilizing WPA3 or WPA2 Enterprise, data payloads are encrypted over the air, which is sufficient for physical and MAC-layer troubleshooting while protecting user privacy. When capturing for performance troubleshooting, configure your capture tool to truncate the payload to the first 128 bytes using tcpdump -s 128 to preserve only the Radiotap, 802.11, and IP headers, excluding actual user data.
Reference Vendor Guidance and Standards. For enterprise deployments, align your PCAP methodology with IEEE 802.11 standards and vendor-specific guidance. For Cisco-based environments, refer to Cisco Wireless APs: 2026 Guide to Products & Deployment for platform-specific capture procedures. For access control and authentication diagnostics, 10 Best Network Access Control (NAC) Solutions for 2026 provides context for integrating PCAP findings with broader security management.
Troubleshooting and Mitigation
The table below outlines common wireless failure modes identified via PCAP, their packet-level indicators, and recommended mitigation steps:
| Failure Mode | PCAP Indicators | Root Cause | Mitigation Steps |
|---|---|---|---|
| Hidden Node Problem | High retry rate on data frames despite high RSSI. | Two clients can communicate with the AP but are hidden from each other due to distance or obstacles, causing simultaneous transmissions. | Enable RTS/CTS thresholds on the AP; reposition APs to eliminate physical obstructions. |
| Co-Channel Interference | Channel utilization >70% driven by a high volume of Beacons from multiple BSSIDs on the same channel. | Too many APs on the same channel or excessively wide channel widths. | Implement a systematic channel plan; reduce channel widths to 20 or 40 MHz; adjust AP transmit power. |
| Sticky Client Behavior | Client remains associated with a distant AP (low RSSI, low data rates) despite being close to an AP offering a stronger signal. | Client roaming algorithm is passive; AP transmit power is too high. | Adjust AP transmit power; set minimum basic data rates to 12 or 24 Mbps; implement 802.11v/k/r roaming. |
| DHCP / DNS Latency | EAPOL handshake completes rapidly, but subsequent DHCP or DNS frames exhibit multi-second delays. | The wireless link is operating optimally, but upstream wired network services are bottlenecked. | Troubleshoot the wired infrastructure; verify DHCP lease times and pool sizes; implement cloud-managed authentication. |
ROI and Business Impact
Streamlining enterprise WiFi performance through precise PCAP diagnostics yields direct, measurable business benefits. In high-traffic venues such as retail chains, hotels, and public spaces, network uptime and performance are directly linked to customer satisfaction and business revenue.
By using PCAP to identify and eliminate airtime-wasting legacy devices and co-channel interference, network teams can reclaim up to 40% of their existing wireless capacity. This optimization defers expensive hardware replacement cycles, allowing venues to support higher client densities without purchasing additional APs or upgrading switch infrastructure. Across large-scale installations, adopting a systematic PCAP diagnostic methodology instead of mere guesswork reduces the Mean Time to Resolution (MTTR) by up to 60%. Engineers can rapidly isolate whether a slow application is caused by RF interference, client-side driver issues, or bottlenecks in the wired network.
For hospitality and retail operators, reliable WiFi is the foundation of customer engagement. Integrating an optimized wireless network with Purple's Guest WiFi and WiFi Analytics platforms enables businesses to capture accurate, first-party customer data, drive targeted marketing campaigns, and increase brand loyalty. In industries like Retail and Hospitality, this data collection engine transforms what is traditionally a cost center (WiFi infrastructure) into a powerful revenue-generating platform. For educational institutions, WiFi in Schools: The 2026 Administrator & IT Guide provides further context on applying these diagnostic principles in high-density, multi-device environments.
-
References
[1] Cisco Meraki: Analyzing Wireless Packet Captures [2] VIAVI Solutions: What is Packet Capture? [3] QA Cafe: Troubleshooting Slow Apps with Packet Captures [4] Purple Guide: How to Fix Slow WiFi Without Upgrading Your Internet Plan [5] Purple Guide: The Ultimate Guide to WiFi Channel Selection
Key Definitions
Monitor Mode
A specialized wireless card state that allows an adapter to passively sniff all 802.11 frames over the air on a specific channel, including management, control, and data frames, without associating with an access point.
Essential for capturing raw wireless PCAP files. Standard 'managed' mode discards frames not addressed to the host device, making it unsuitable for wireless diagnostics.
Radiotap Header
A standardized header prepended to captured 802.11 frames by the capturing driver, containing physical-layer metadata such as signal strength (RSSI), channel frequency, and transmission data rate.
Used in Wireshark to analyze the physical RF environment at the exact millisecond a frame was captured. Provides the ground truth for signal quality and data rate analysis.
Retry Rate
The percentage of transmitted 802.11 frames that have the 'Retry' bit set in their MAC header, indicating they are retransmissions due to a lack of a receiving Acknowledgment (ACK) frame.
A key metric for wireless health. Rates above 10% indicate severe interference, collisions, or hidden node issues that will degrade throughput and latency for all connected clients.
Airtime Starvation
A condition where legacy or distant client devices transmitting at low data rates (e.g., 1 or 6 Mbps) consume a disproportionate share of the available wireless airtime, leaving high-speed clients with insufficient capacity.
Diagnosed in PCAP by filtering for low data rates and high channel utilization. Resolved by disabling legacy rates and setting a minimum basic rate of 12 or 24 Mbps.
Hidden Node Problem
An RF collision scenario where two wireless client devices can communicate with the same AP but cannot hear each other, leading to simultaneous transmissions that collide at the AP.
Diagnosed by high retry rates despite excellent signal strength. Common in retail environments with metal shelving or warehouses with concrete walls. Resolved by enabling RTS/CTS thresholds.
Beacon Frame
An 802.11 management frame broadcasted periodically (typically every 100ms) by an AP to advertise its presence, SSID, supported data rates, and capabilities to nearby clients.
In high-density deployments, a large number of APs on the same channel can cause Beacon overhead to consume up to 50% of available airtime, particularly when transmitted at low basic rates.
RTS/CTS (Request to Send / Clear to Send)
A handshake mechanism used to coordinate access to the wireless medium, where a client sends an RTS frame before transmitting data, and the AP responds with a CTS frame to reserve the channel for all nearby devices.
Used to mitigate collisions caused by the Hidden Node problem in high-density or physically obstructed environments such as retail stores and warehouses.
Channel Utilization
The percentage of time that the wireless medium is busy, either due to decodable 802.11 transmissions or non-WiFi physical layer noise.
Utilization above 70% typically results in severe latency and throughput degradation for all associated clients. Measured in Wireshark via Statistics > I/O Graph.
EAPOL (Extensible Authentication Protocol over LAN)
The protocol used to transport EAP authentication messages between a wireless client and an authenticator (AP) during the 802.1X authentication process.
Delays in EAPOL exchanges visible in a PCAP indicate bottlenecks in the RADIUS authentication server, which users often misidentify as "slow WiFi" when the wireless link itself is healthy.
Worked Examples
A 200-room luxury hotel is hosting a tech conference in its main ballroom. During the keynote session, over 150 guests report that they can connect to the guest WiFi but cannot load web pages, experiencing extremely sluggish performance. Standard dashboards show 5 GHz channel utilization on Channel 36 is at 82%, but there is very little active data throughput. The on-site IT team needs to identify the root cause and implement an immediate solution.
The network architect initiates a wireless packet capture on Channel 36 using a monitor-mode adapter.
Step 1 - PCAP Analysis: The capture reveals that 45% of the total airtime is consumed by Management frames. Specifically, Beacon frames from the hotel's own APs are being transmitted at the lowest basic rate of 1 Mbps, and there is a massive flood of Probe Requests and Probe Responses from hundreds of passive client devices in the crowd.
Step 2 - Physical Layer Inspection: Examination of the Radiotap header shows that several legacy 802.11b/g devices are transmitting QoS Data frames at 2 Mbps, occupying the medium for long durations and causing airtime starvation for newer 802.11ac/ax clients.
Step 3 - Remediation: In the wireless controller, the architect disables legacy data rates (1, 2, 5.5, 11 Mbps) and sets the minimum basic rate to 12 Mbps. This forces the APs to transmit Beacons 12 times faster, immediately reclaiming over 30% of the channel's airtime. It also prevents distant clients with poor signals from associating, encouraging them to roam to closer APs. Additionally, the architect reduces the 2.4 GHz transmit power to 6 dBm and enables band steering to push dual-band clients to the cleaner 5 GHz band.
Step 4 - Verification: A post-remediation PCAP confirms that channel utilization drops to 38%, retry rates fall below 4%, and guest web pages load instantly.
A national retail chain reports that wireless Point-of-Sale (POS) terminals in the checkout lanes experience intermittent connection drops and slow transaction processing during peak shopping hours. The stores use Channel 11 on 2.4 GHz for POS terminals. A local site survey shows excellent signal strength of -52 dBm at the register, but transaction delays persist. The network team is under pressure to resolve this before the upcoming peak shopping period.
A solutions architect performs a targeted PCAP during peak hours.
Step 1 - Filter by Client MAC: The architect filters the capture for the MAC address of a failing POS terminal using wlan.addr == [POS_MAC].
Step 2 - Key Findings: The 802.11 Retry Rate for the POS terminal peaks at 24%, despite the excellent signal strength of -52 dBm. The PCAP reveals a high volume of data frames sent without receiving corresponding Control ACK frames, leading to immediate retransmissions. There are no other active BSSIDs on Channel 11, ruling out standard co-channel interference. However, the PCAP shows that a wireless inventory scanner in a backroom stockroom is transmitting to the same AP. Due to thick concrete walls, the POS terminal and the inventory scanner cannot hear each other's transmissions, but both can communicate with the AP - a classic Hidden Node Problem.
Step 3 - Remediation: The architect configures an RTS/CTS threshold of 2347 bytes on the POS SSID in the wireless controller. Before transmitting any large data frame, the POS terminal must now send an RTS frame; the AP responds with a CTS frame heard by all clients, reserving the medium and preventing collisions. Additionally, POS terminals are migrated to a dedicated, secure 5 GHz SSID, which has better penetration through shelving and less congestion.
Step 4 - Verification: A follow-up PCAP shows the POS terminal's retry rate drops to 2.5%, and transaction latency is completely eliminated.
Practice Questions
Q1. An IT manager at a large retail mall is troubleshooting intermittent connectivity drops for mobile inventory scanners. A wireless site survey shows a signal strength of -72 dBm in the back alleys of the warehouse. A monitor-mode packet capture reveals an 802.11 retry rate of 14% on the scanner's MAC address, and many data frames are transmitted at 1 Mbps. What is the most likely cause of the slow performance, and what are the two immediate remediation steps?
Hint: Consider both the signal strength threshold (-67 dBm is the minimum for reliable enterprise operations) and the impact of 1 Mbps transmission rate on airtime capacity for all other clients on the channel.
View model answer
The primary cause is a combination of poor signal coverage (indicated by -72 dBm, which is below the recommended -67 dBm threshold) and airtime starvation (caused by the scanner transmitting at 1 Mbps). Because the signal is weak, the scanner drops its data rate to maintain connection, consuming excessive airtime and driving up the retry rate to 14% due to collisions and signal degradation.
Immediate Remediation Steps: (1) Disable legacy data rates in the wireless controller and set the minimum basic rate to 12 Mbps. This will force the scanner to roam to a closer AP or prevent it from associating at such low, inefficient rates. (2) Reposition existing APs or add a new AP closer to the back alley to bring the signal strength up to at least -67 dBm, ensuring the scanner can transmit at higher MCS indexes and immediately reducing the retry rate and reclaiming airtime.
Q2. During a packet capture analysis of a slow WiFi network in a corporate office, a network engineer notices that the average TCP Round-Trip Time (RTT) is 450ms and HTTP response times average 3.2 seconds. However, the 802.11 frame retry rate is consistently under 3%, and overall channel utilization is only 22%. What does this data indicate about the location of the performance bottleneck?
Hint: Compare the RF-layer metrics (retry rate, channel utilization) with the transport and application-layer metrics (TCP RTT, HTTP response time). What does it mean when one set of metrics is healthy and the other is not?
View model answer
This data indicates that the performance bottleneck is not on the wireless network; instead, it resides on the upstream wired network, the server, or the application itself. An 802.11 retry rate under 3% and channel utilization of 22% are excellent indicators of a healthy, clean RF environment with no physical-layer interference, congestion, or collision issues. The high TCP RTT (450ms) and slow HTTP response times (3.2 seconds) must therefore be caused by delays occurring after the AP forwards traffic to the wired switch - potentially an overloaded DHCP server, slow DNS resolution, WAN gateway congestion, or a bottleneck on the application server. The network engineer can confidently declare the wireless network innocent and focus troubleshooting on the wired backhaul and server infrastructure.
Q3. A stadium operations director is preparing for an event with 15,000 expected attendees. The stadium's existing WiFi network has 5 GHz APs deployed throughout the seating bowl. A pre-event PCAP shows that even with zero active guests, the channel utilization on Channel 44 is at 35%, consisting almost entirely of Beacon frames from 40 APs within hearing range of each other. What is this phenomenon called, and how can the director resolve it before the event starts?
Hint: Think about the impact of having too many APs broadcasting on the same channel at default beacon intervals and basic rates. How much airtime does a single Beacon frame consume at 1 Mbps versus 24 Mbps?
View model answer
This phenomenon is called Management Frame Congestion (specifically, Beacon Overhead). It occurs when a high density of APs are configured on the same channel and broadcasting Beacons every 100ms at the lowest basic rate of 1 Mbps, consuming a massive portion of available airtime even with no clients connected.
Remediation Steps: (1) Optimize the channel plan by reducing the number of APs sharing Channel 44, utilizing more of the 5 GHz spectrum including DFS channels, or deploying 6 GHz if supported, ensuring APs on the same channel are physically shielded from each other. (2) Increase the minimum basic rate to 24 Mbps. By forcing Beacons to be transmitted at 24 Mbps rather than 1 Mbps, each Beacon is transmitted 24 times faster, immediately reducing the airtime consumed by management overhead from approximately 30% to under 2%, reclaiming the channel for actual data traffic.
Continue reading in this series
A Step-by-Step Guide to Diagnosing WiFi Roaming Issues
This comprehensive guide provides enterprise IT leaders and network architects with an authoritative, step-by-step methodology for diagnosing and resolving WiFi roaming issues. By combining technical deep-dives into IEEE 802.11k/v/r standards with real-world case studies and packet-level analysis, this reference equips teams to eliminate the 'sticky client' problem and deliver seamless mobile connectivity. It covers the full diagnostic workflow from RF site surveys and controller configuration audits through to over-the-air packet capture analysis and post-remediation validation.
Why Your Stadium WiFi Grinds to a Halt (And How to Fix It)
This authoritative technical guide examines the root cause of stadium WiFi congestion - the simultaneous background chatter of 50,000 devices loading programmatic advertisements and telemetry - and provides a detailed architectural blueprint for deploying edge DNS filtering as the primary mitigation strategy. Designed for IT Directors, CTOs, and Network Architects, it delivers actionable implementation guidance, real-world case studies, and measurable ROI frameworks to help venue operators reclaim bandwidth and deliver high-performance connectivity at scale.
Solving the Connected but No Internet Error on Guest WiFi
This authoritative technical reference guide explains how DNS timeouts caused by congested networks trigger the 'Connected, No Internet' error on guest WiFi. It provides network architects and IT managers with actionable implementation steps for deploying enterprise DNS filters to resolve these bottlenecks and improve guest onboarding.
Got questions about your specific setup?
Our team works with venue operators, IT managers, and network engineers across 80,000 venues. Book a 20-minute call and we will show you how others like you solved it.