Cómo Monitorizar el Tráfico de Red WiFi: Una Guía para Equipos de TI
Esta guía técnica proporciona estrategias accionables para monitorizar el tráfico WiFi empresarial, centrándose en la arquitectura, la seguridad y el rendimiento. Equipa a los equipos de TI en los sectores de hostelería, comercio minorista y público con los marcos necesarios para implementar soluciones de monitorización de red escalables y seguras.
🎧 Escuchar esta guía
Ver transcripción
Resumen Ejecutivo
Para los líderes de TI empresariales que gestionan redes en entornos de Hostelería , Comercio Minorista y Transporte , el WiFi ya no es un servicio de 'mejor esfuerzo'; es una infraestructura crítica. La monitorización de este tráfico va mucho más allá de las simples comprobaciones de tiempo de actividad. Una arquitectura de monitorización robusta requiere una visibilidad profunda del entorno RF, los flujos de autenticación y el tráfico de la capa de aplicación para garantizar tanto el rendimiento como la seguridad. Esta guía describe los requisitos técnicos y las consideraciones arquitectónicas para implementar la monitorización WiFi de nivel empresarial. Exploramos las cinco capas críticas de visibilidad de la red, la integración de plataformas de identidad y análisis como la solución Guest WiFi de Purple, y las estrategias necesarias para mitigar riesgos mientras se ofrece una experiencia de usuario fluida. Al adoptar estos marcos, los CTOs y arquitectos de red pueden pasar de la resolución de problemas reactiva a la planificación proactiva de la capacidad y la detección de amenazas.
Análisis Técnico Detallado
La monitorización efectiva del tráfico WiFi requiere un enfoque multicapa, capturando datos desde el espacio aéreo físico hasta la capa de aplicación. Confiar únicamente en el sondeo SNMP para el estado del dispositivo deja puntos ciegos significativos en la comprensión del comportamiento del usuario y la salud de la red.
Las Cinco Capas de Visibilidad
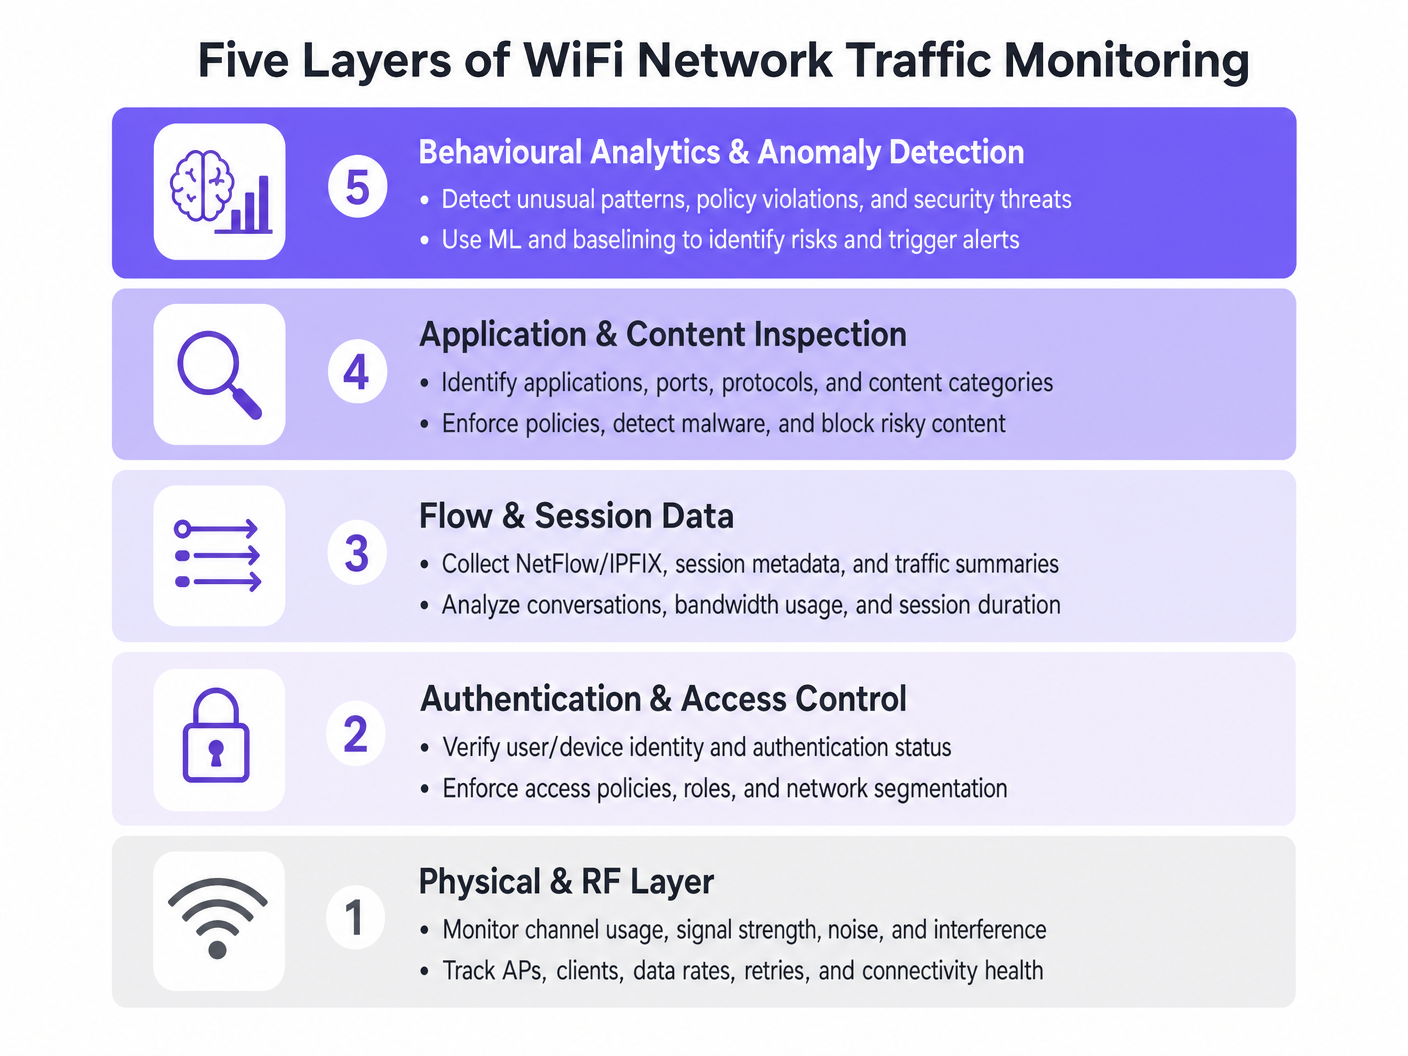
- Capa Física y RF: Esta capa fundamental implica la monitorización de la utilización del canal, las relaciones señal/ruido (SNR) y la interferencia cocanal. Las herramientas deben rastrear las tasas de datos del cliente y los porcentajes de reintentos. Las altas tasas de reintentos a menudo indican problemas de RF mucho antes de que se produzca la saturación del ancho de banda.
- Autenticación y Control de Acceso: La monitorización de los registros RADIUS y las transacciones 802.1X es crítica. Al analizar la latencia de autenticación y las tasas de fallo, los equipos pueden aislar los problemas al servicio de directorio o a la infraestructura inalámbrica. Esto es particularmente relevante al implementar Seguridad WiFi BYOD: Cómo Permitir Dispositivos Personales de Forma Segura en Su Red .
- Datos de Flujo y Sesión: La utilización de protocolos como NetFlow, IPFIX y sFlow proporciona metadatos sobre las conversaciones de red sin la sobrecarga de la captura completa de paquetes. Estos datos revelan los principales emisores, las tendencias de consumo de ancho de banda y los patrones de tráfico inusuales.
- Inspección de Aplicaciones y Contenido: La Inspección Profunda de Paquetes (DPI) a nivel de controlador de LAN inalámbrica o firewall permite a los equipos de TI identificar aplicaciones específicas (por ejemplo, distinguir entre VoIP corporativo y streaming de vídeo de consumo). Esta visibilidad es esencial para aplicar políticas de Calidad de Servicio (QoS).
- Análisis de Comportamiento y Detección de Anomalías: La capa más avanzada utiliza el aprendizaje automático para establecer una línea base del comportamiento normal de la red. Cuando un dispositivo se desvía de su línea base —como un dispositivo IoT que de repente transmite grandes volúmenes de datos— el sistema activa una alerta, facilitando una respuesta rápida a incidentes.
Integración Arquitectónica
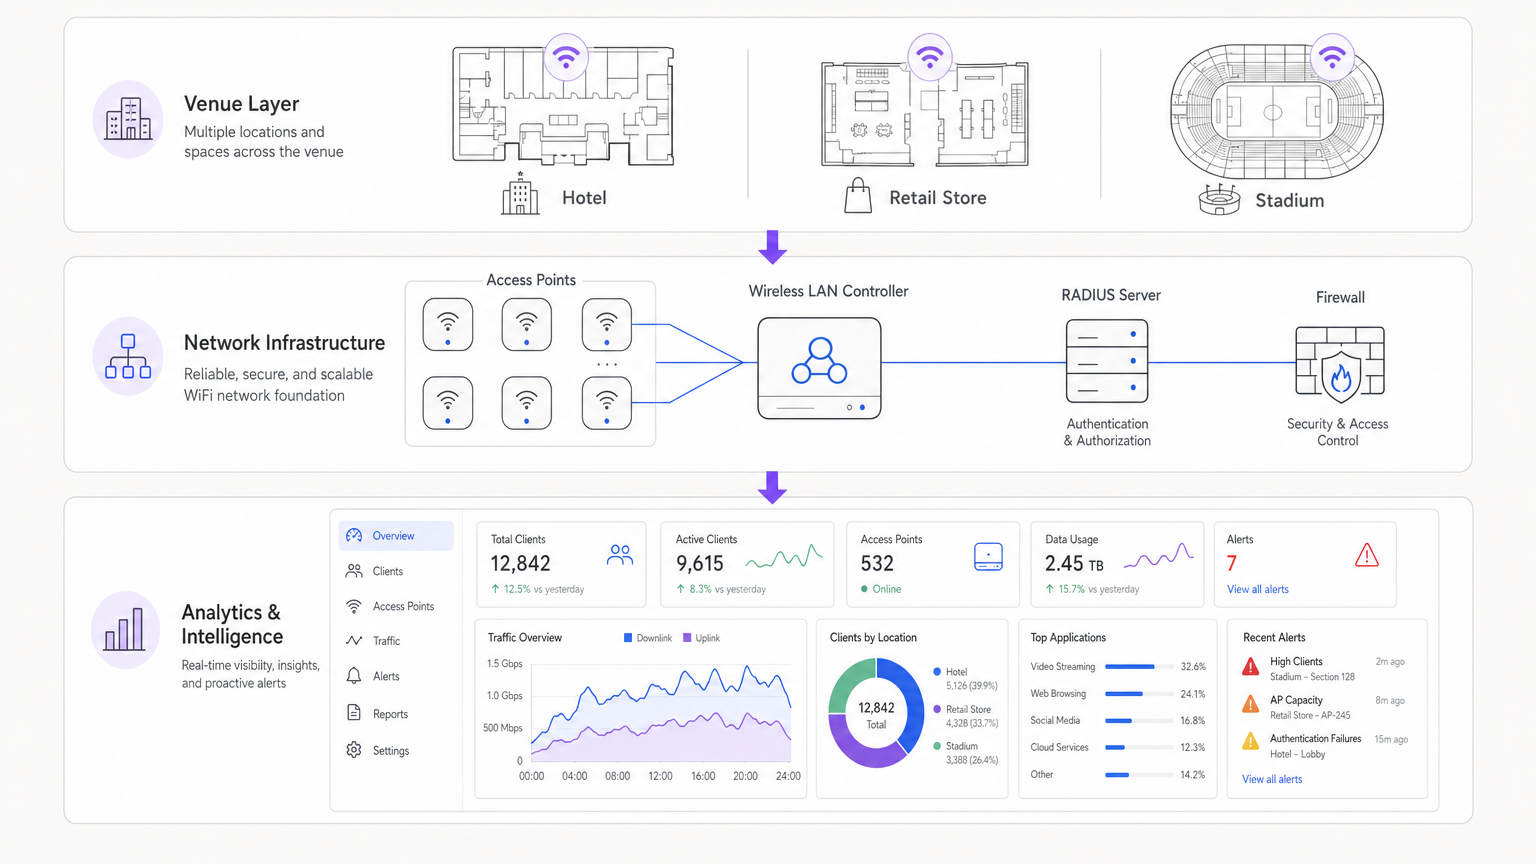
Las arquitecturas modernas centralizan los datos de telemetría de los puntos de acceso distribuidos. Ya sea utilizando una solución gestionada en la nube o un controlador local, la agregación de registros en un SIEM (Security Information and Event Management) o una plataforma de análisis dedicada es crucial. La integración de proveedores de identidad, como WiFi Analytics de Purple, enriquece los datos de red brutos con el contexto del usuario, transformando una dirección IP en un perfil de usuario accionable.
Guía de Implementación
La implementación de una solución de monitorización integral requiere una planificación cuidadosa para evitar sobrecargar los recursos de la red o generar fatiga por alertas.
Paso 1: Definir los Requisitos de Telemetría
Determine qué protocolos soporta su infraestructura. Habilite NetFlow/IPFIX en los switches y firewalls principales, y configure los puntos de acceso para reenviar syslog y métricas de RF a un colector central.
Paso 2: Implementar la Segmentación de Red
Aísle el tráfico en VLANs distintas: Corporativa, Invitados e IoT. Aplique diferentes perfiles de monitorización a cada una. Por ejemplo, la inspección profunda de paquetes podría aplicarse intensamente a la red de Invitados para hacer cumplir las políticas de uso aceptable, mientras que los datos de flujo son suficientes para el segmento IoT.
Paso 3: Configurar la Integración de Identidad
Vincule sus herramientas de monitorización de red con su backend de autenticación. Al gestionar implementaciones complejas como WiFi en Hospitales: Una Guía para Redes Clínicas Seguras , correlacionar una dirección MAC con un rol de usuario específico (por ejemplo, médico vs. paciente) es esencial para una resolución rápida de problemas.
Paso 4: Ajustar los Umbrales de Alerta
Evite umbrales estáticos que activen falsos positivos durante las horas pico. Implemente la línea base dinámica siempre que sea posible. Comience con alertas críticas (por ejemplo, controlador fuera de línea, fallos masivos de autenticación) e introduzca gradualmente alertas basadas en el rendimiento (por ejemplo, alta utilización del canal) a medida que comprenda la línea base de su red.
Mejores Prácticas
- Priorizar los Datos de Flujo sobre la Captura de Paquetes: La captura completa de paquetes consume muchos recursos y a menudo es innecesaria para la monitorización rutinaria. Confíe en NetFlow/IPFIX para el 90% de sus necesidades de visibilidad.
- Aplicar Control de Acceso Basado en Roles (RBAC): Asegúrese de que solo el personal autorizado tenga acceso a los paneles de monitorización sensibles, particularmente aquellos que muestran datos de identidad del usuario.
- Revisar Regularmente las Firmas DPI: Las firmas de aplicaciones cambian con frecuencia. Asegúrese de que sus motores DPI se actualicen automáticamente para mantener un tráfico precisoclasificación.
- Considere el hardware: Al seleccionar la infraestructura, como se describe en Su guía para un punto de acceso inalámbrico Ruckus , asegúrese de que los APs tengan la potencia de procesamiento para manejar la inspección del tráfico local sin degradar el rendimiento del cliente.
Resolución de problemas y mitigación de riesgos
Modos de fallo comunes
- Fatiga de alertas: Cuando los sistemas de monitorización generan demasiado ruido, se pierden alertas críticas. Mitigación: Implementar motores de correlación de alertas para agrupar eventos relacionados.
- Puntos ciegos en el tráfico cifrado: A medida que más tráfico se desplaza a HTTPS y TLS 1.3, la inspección de la carga útil se vuelve difícil. Mitigación: Confiar en el enrutamiento SNI (Server Name Indication), las consultas DNS y los metadatos de flujo para inferir el uso de la aplicación.
- Agotamiento de recursos: Habilitar DPI en controladores con recursos insuficientes puede causar picos de CPU y pérdida de paquetes. Mitigación: Dimensionar el hardware adecuadamente o descargar la inspección a dispositivos de seguridad dedicados.
ROI e impacto empresarial
El retorno de la inversión para una monitorización robusta de WiFi se mide en la reducción de riesgos y la eficiencia operativa. Al identificar y resolver problemas de RF antes de que afecten a los usuarios, los locales reducen los tickets de soporte y protegen las fuentes de ingresos. Además, la integración de la monitorización de red con plataformas como Purple permite a las empresas aprovechar su infraestructura para obtener información de marketing y operativa, transformando la TI de un centro de costes en un activo estratégico. Ya sea implementando en una tienda minorista o explorando Su guía para soluciones Wi-Fi empresariales en el coche , la visibilidad es clave para el rendimiento.
Escuche el resumen
Términos clave y definiciones
NetFlow / IPFIX
Network protocols used to collect IP traffic information and monitor network flow. They provide metadata about conversations (source, destination, ports) without capturing the payload.
Essential for identifying top talkers and bandwidth consumption trends without the overhead of full packet capture.
Deep Packet Inspection (DPI)
A form of computer network packet filtering that examines the data part of a packet as it passes an inspection point, searching for protocol non-compliance, viruses, spam, intrusions, or predefined criteria.
Used to identify specific applications (e.g., Netflix vs. Zoom) to enforce granular QoS policies on guest networks.
RADIUS
Remote Authentication Dial-In User Service. A networking protocol that provides centralised Authentication, Authorization, and Accounting (AAA) management.
RADIUS logs are the first place IT teams look when troubleshooting 802.1X authentication failures or latency issues.
Co-Channel Interference (CCI)
Interference caused when two or more access points are operating on the same frequency channel within range of each other, forcing them to share the airtime.
A primary cause of poor WiFi performance in dense deployments like stadiums or conference centres.
Band Steering
A feature in wireless networks that encourages dual-band clients to connect to the less congested 5GHz or 6GHz bands rather than the crowded 2.4GHz band.
Crucial for optimising RF performance and ensuring a better user experience in high-density environments.
VLAN Segmentation
The practice of dividing a physical network into multiple logical networks to isolate traffic for security and performance reasons.
Fundamental for separating secure corporate or POS traffic from untrusted guest WiFi traffic.
Quality of Service (QoS)
Technologies that manage data traffic to reduce packet loss, latency and jitter on the network, prioritising specific types of data.
Used to ensure business-critical applications (like VoIP or POS transactions) perform reliably even when the network is congested.
Alert Fatigue
The phenomenon where IT staff become desensitised to safety alerts because they are exposed to a large number of frequent alarms.
A major risk in network monitoring; mitigated by tuning thresholds and correlating events.
Casos de éxito
A 200-room hotel is experiencing intermittent connectivity issues during peak evening hours. The basic dashboard shows all APs are online, but guests report slow speeds.
- Check RF Layer: Analyse channel utilisation and co-channel interference on the 2.4GHz and 5GHz bands. High utilisation on 2.4GHz is common; ensure band steering is forcing capable clients to 5GHz.
- Review Flow Data: Identify top talkers. In this scenario, flow data reveals a small number of devices consuming 70% of the bandwidth via peer-to-peer file sharing.
- Apply Policy: Implement an application control policy via the WLAN controller to throttle P2P traffic, immediately freeing up bandwidth for other guests.
A large retail chain needs to ensure its point-of-sale (POS) terminals have priority over guest WiFi traffic during a major sales event.
- Network Segmentation: Ensure POS terminals and guest traffic are on separate VLANs and SSIDs.
- Quality of Service (QoS): Configure QoS policies on the wireless controller and upstream switches to prioritise traffic originating from the POS VLAN.
- Application Inspection: Implement DPI on the guest network to block bandwidth-heavy applications like 4K video streaming during the event.
- Monitoring: Set up specific dashboards to monitor the latency and packet loss specifically for the POS subnet.
Análisis de escenarios
Q1. Your network monitoring dashboard alerts you to a sudden, massive spike in bandwidth utilisation on the guest network at a retail location. The traffic is entirely encrypted (HTTPS). How do you determine the nature of the traffic?
💡 Sugerencia:Consider what metadata is available even when the payload is encrypted.
Mostrar enfoque recomendado
While the payload is encrypted, you can use flow data (NetFlow/IPFIX) to identify the destination IP addresses and ports. Correlating this with DNS query logs or using Server Name Indication (SNI) data from the firewall will reveal the domain names being accessed, allowing you to determine if the traffic is legitimate (e.g., a large OS update) or unauthorized.
Q2. A stadium deployment is experiencing poor performance during events. The dashboard shows high channel utilisation on the 2.4GHz band, but relatively low utilisation on the 5GHz band. What is the most appropriate configuration change?
💡 Sugerencia:Think about how to balance the load across available frequencies.
Mostrar enfoque recomendado
Implement and aggressively tune Band Steering on the wireless LAN controllers. This will force dual-band capable client devices to connect to the less congested 5GHz band, freeing up airtime on the 2.4GHz band for legacy devices that only support 2.4GHz.
Q3. You are deploying a new monitoring solution and want to avoid alert fatigue for the network operations centre (NOC). How should you approach configuring alerts for AP offline events?
💡 Sugerencia:Consider the impact of a single AP failing versus multiple APs.
Mostrar enfoque recomendado
Instead of alerting on every single AP that goes offline (which might happen briefly due to PoE resets or minor switch issues), configure the system to alert based on density or critical areas. For example, trigger an alert only if multiple APs in the same zone go offline simultaneously, or if a specifically tagged 'critical' AP (e.g., covering the main lobby) drops.
