Come Monitorare il Traffico di Rete WiFi: Una Guida per i Team IT
Questa guida tecnica fornisce strategie attuabili per il monitoraggio del traffico WiFi aziendale, concentrandosi su architettura, sicurezza e prestazioni. Fornisce ai team IT nei settori dell'ospitalità, del retail e pubblico i framework necessari per implementare soluzioni di monitoraggio di rete scalabili e sicure.
🎧 Ascolta questa guida
Visualizza trascrizione
Riepilogo Esecutivo
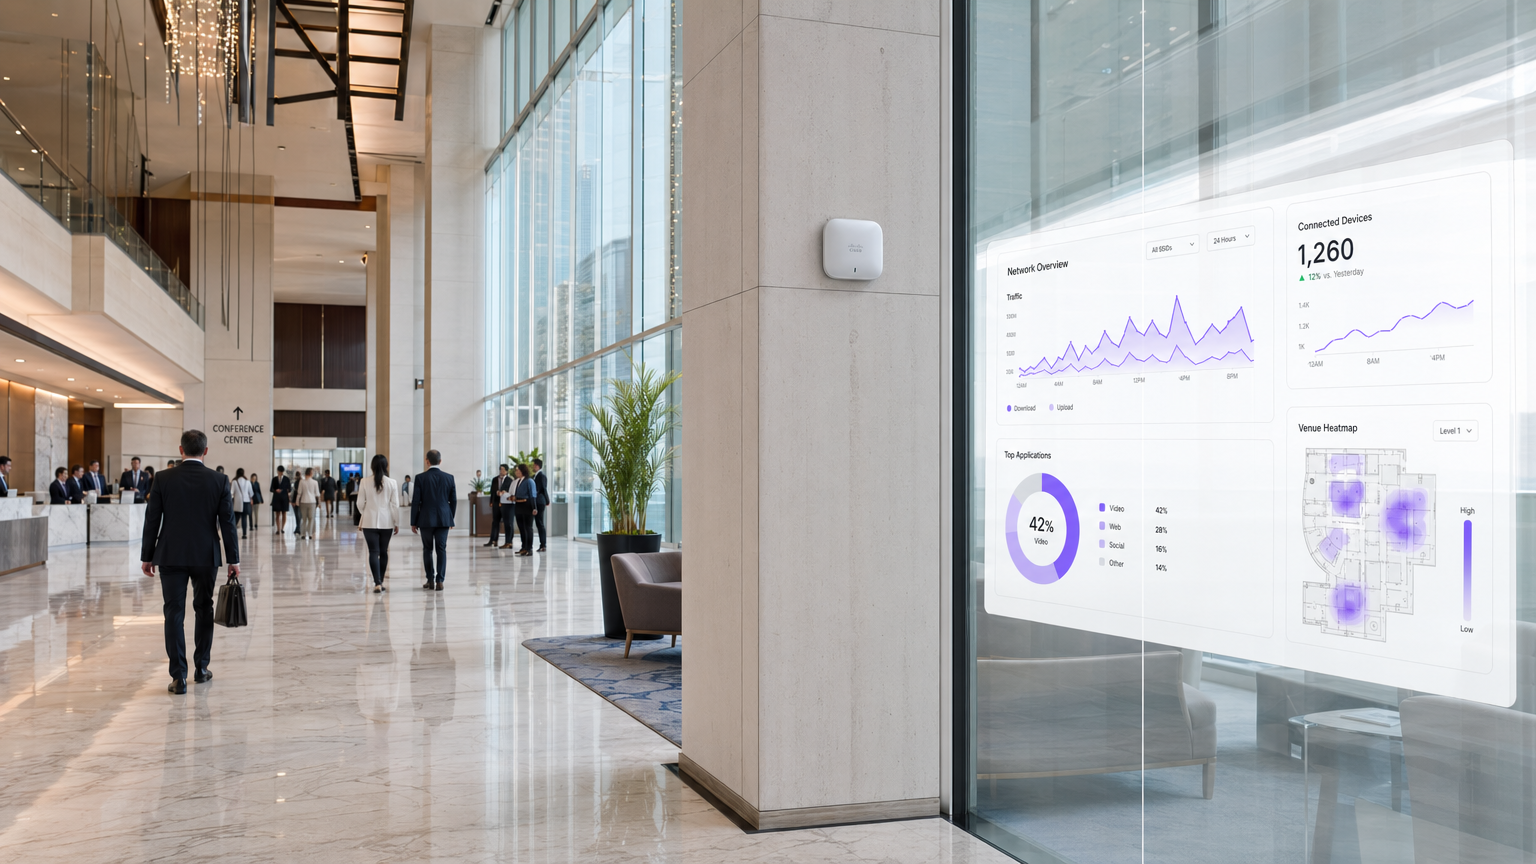
Per i responsabili IT aziendali che gestiscono reti in strutture Ospitalità , Retail e Trasporti , il WiFi non è più un servizio "best-effort"; è un'infrastruttura critica. Il monitoraggio di questo traffico va ben oltre i semplici controlli di uptime. Un'architettura di monitoraggio robusta richiede una visibilità approfondita sull'ambiente RF, sui flussi di autenticazione e sul traffico a livello di applicazione per garantire sia le prestazioni che la sicurezza. Questa guida illustra i requisiti tecnici e le considerazioni architetturali per l'implementazione di un monitoraggio WiFi di livello aziendale. Esploriamo i cinque livelli critici di visibilità della rete, l'integrazione di piattaforme di identità e analisi come la soluzione Guest WiFi di Purple e le strategie necessarie per mitigare i rischi fornendo al contempo un'esperienza utente senza interruzioni. Adottando questi framework, i CTO e gli architetti di rete possono passare dalla risoluzione reattiva dei problemi alla pianificazione proattiva della capacità e al rilevamento delle minacce.
Approfondimento Tecnico
Un monitoraggio efficace del traffico WiFi richiede un approccio multilivello, che acquisisca dati dallo spazio aereo fisico fino al livello applicativo. Affidarsi esclusivamente al polling SNMP per lo stato dei dispositivi lascia significativi punti ciechi nella comprensione del comportamento degli utenti e della salute della rete.
I Cinque Livelli di Visibilità
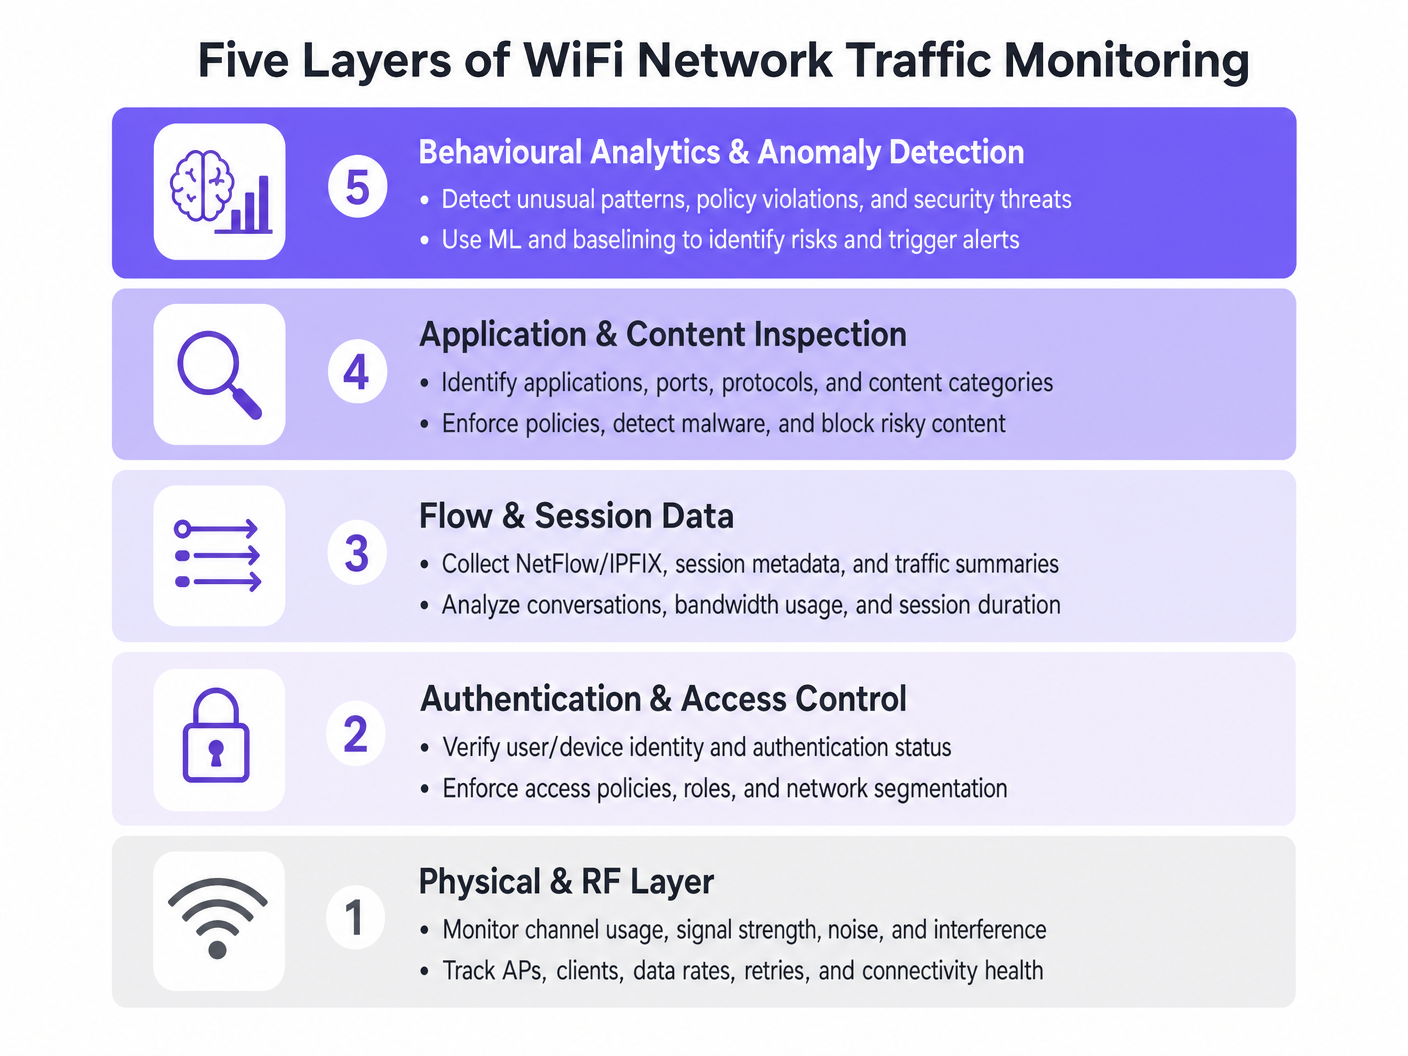
- Livello Fisico e RF: Questo livello fondamentale implica il monitoraggio dell'utilizzo del canale, dei rapporti segnale/rumore (SNR) e dell'interferenza co-canale. Gli strumenti devono tracciare i tassi di dati dei client e le percentuali di tentativi. Alti tassi di tentativi spesso indicano problemi RF molto prima che si verifichi la saturazione della larghezza di banda.
- Autenticazione e Controllo Accessi: Il monitoraggio dei log RADIUS e delle transazioni 802.1X è fondamentale. Analizzando la latenza di autenticazione e i tassi di fallimento, i team possono isolare i problemi al servizio di directory o all'infrastruttura wireless. Questo è particolarmente rilevante quando si implementa Sicurezza WiFi BYOD: Come Consentire in Sicurezza i Dispositivi Personali sulla Tua Rete .
- Dati di Flusso e Sessione: L'utilizzo di protocolli come NetFlow, IPFIX e sFlow fornisce metadati sulle conversazioni di rete senza il sovraccarico della cattura completa dei pacchetti. Questi dati rivelano i principali "talker", le tendenze di consumo della larghezza di banda e i modelli di traffico insoliti.
- Ispezione di Applicazioni e Contenuti: La Deep Packet Inspection (DPI) a livello di controller LAN wireless o firewall consente ai team IT di identificare applicazioni specifiche (ad esempio, distinguere tra VoIP aziendale e streaming video consumer). Questa visibilità è essenziale per l'applicazione delle politiche di Quality of Service (QoS).
- Analisi Comportamentale e Rilevamento Anomalie: Il livello più avanzato utilizza il machine learning per stabilire una baseline del comportamento normale della rete. Quando un dispositivo devia dalla sua baseline, come un dispositivo IoT che improvvisamente trasmette grandi volumi di dati, il sistema attiva un avviso, facilitando una rapida risposta agli incidenti.
Integrazione Architetturale
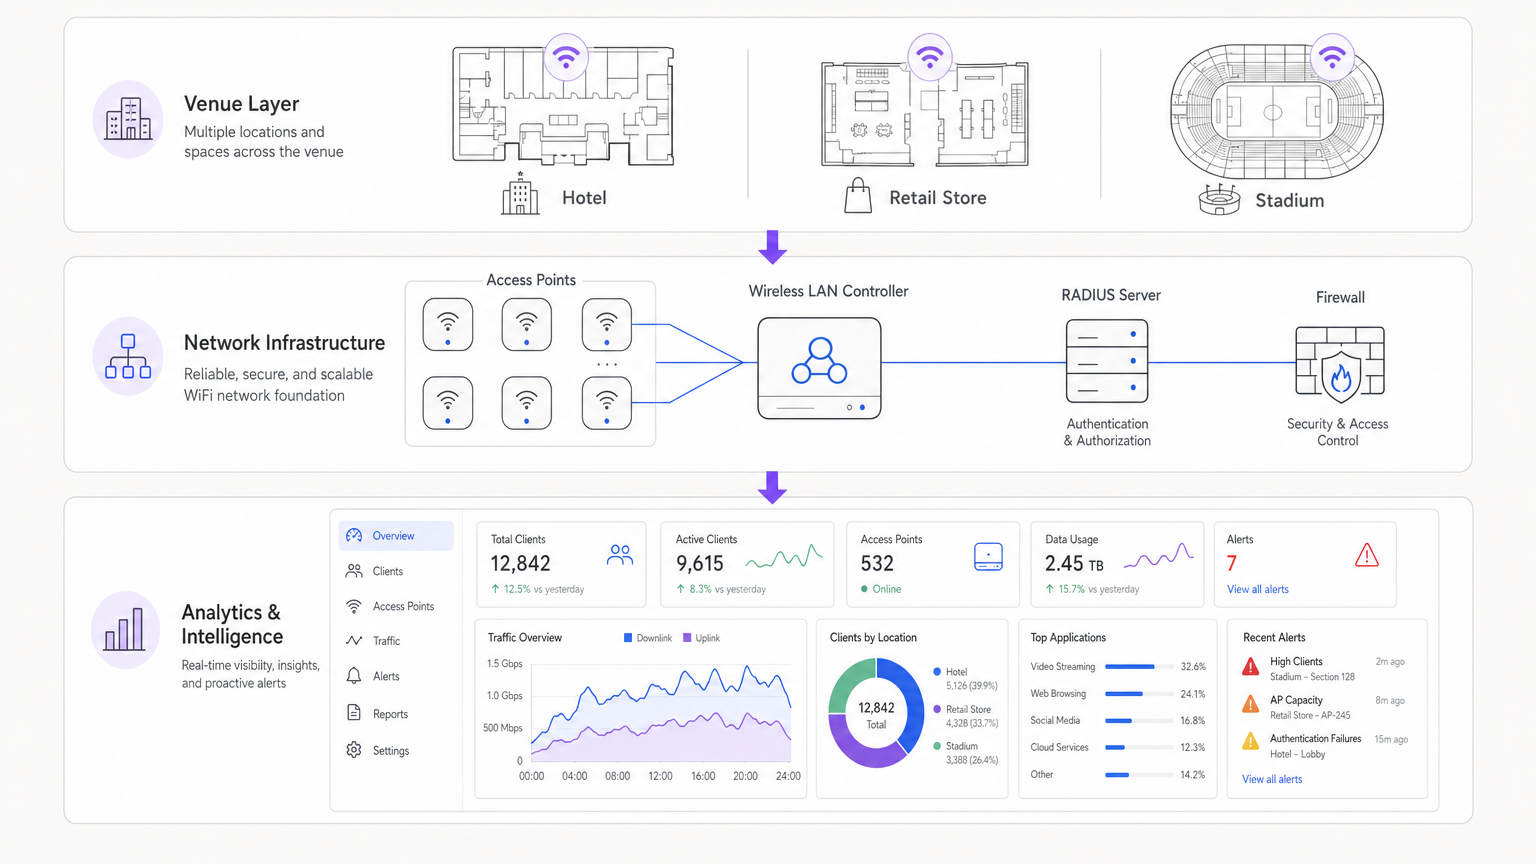
Le architetture moderne centralizzano i dati di telemetria provenienti da access point distribuiti. Sia che si utilizzi una soluzione gestita in cloud o un controller on-premise, l'aggregazione dei log in un SIEM (Security Information and Event Management) o in una piattaforma di analisi dedicata è cruciale. L'integrazione di provider di identità, come WiFi Analytics di Purple, arricchisce i dati di rete grezzi con il contesto utente, trasformando un indirizzo IP in un profilo utente utilizzabile.
Guida all'Implementazione
L'implementazione di una soluzione di monitoraggio completa richiede un'attenta pianificazione per evitare di sovraccaricare le risorse di rete o di generare affaticamento da allarmi.
Fase 1: Definire i Requisiti di Telemetria
Determinare quali protocolli supporta la propria infrastruttura. Abilitare NetFlow/IPFIX su switch core e firewall e configurare gli access point per inoltrare syslog e metriche RF a un collettore centrale.
Fase 2: Implementare la Segmentazione della Rete
Isolare il traffico in VLAN distinte: Aziendale, Ospiti e IoT. Applicare profili di monitoraggio diversi a ciascuna. Ad esempio, l'ispezione approfondita dei pacchetti potrebbe essere applicata intensamente alla rete Ospiti per far rispettare le politiche di utilizzo accettabile, mentre i dati di flusso sono sufficienti per il segmento IoT.
Fase 3: Configurare l'Integrazione dell'Identità
Collegare gli strumenti di monitoraggio della rete al proprio backend di autenticazione. Quando si gestiscono implementazioni complesse come WiFi negli Ospedali: Una Guida alle Reti Cliniche Sicure , correlare un indirizzo MAC con un ruolo utente specifico (ad esempio, clinico vs. paziente) è essenziale per una rapida risoluzione dei problemi.
Fase 4: Tarare le Soglie di Allerta
Evitare soglie statiche che attivano falsi positivi durante le ore di punta. Implementare il baselining dinamico ove possibile. Iniziare con avvisi critici (ad esempio, controller offline, fallimenti di autenticazione di massa) e introdurre gradualmente avvisi basati sulle prestazioni (ad esempio, alto utilizzo del canale) man mano che si comprende la baseline della propria rete.
Migliori Pratiche
- Dare Priorità ai Dati di Flusso Rispetto alla Cattura di Pacchetti: La cattura completa dei pacchetti è ad alta intensità di risorse e spesso non necessaria per il monitoraggio di routine. Affidarsi a NetFlow/IPFIX per il 90% delle proprie esigenze di visibilità.
- Applicare il Controllo degli Accessi Basato sui Ruoli (RBAC): Assicurarsi che solo il personale autorizzato abbia accesso a dashboard di monitoraggio sensibili, in particolare quelle che mostrano dati di identità utente.
- Rivedere Regolarmente le Firme DPI: Le firme delle applicazioni cambiano frequentemente. Assicurarsi che i motori DPI siano aggiornati automaticamente per mantenere un traffico accuratoclassificazione IC.
- Considera l'Hardware: Quando selezioni l'infrastruttura, come descritto in La Tua Guida a un Wireless Access Point Ruckus , assicurati che gli AP abbiano la potenza di elaborazione per gestire l'ispezione del traffico locale senza degradare le prestazioni del client.
Risoluzione dei Problemi e Mitigazione del Rischio
Modalità di Guasto Comuni
- Fatica da Avvisi: Quando i sistemi di monitoraggio generano troppo rumore, gli avvisi critici vengono persi. Mitigazione: Implementare motori di correlazione degli avvisi per raggruppare gli eventi correlati.
- Punti Ciechi nel Traffico Crittografato: Poiché più traffico si sposta su HTTPS e TLS 1.3, l'ispezione del payload diventa difficile. Mitigazione: Affidarsi al routing SNI (Server Name Indication), alle query DNS e ai metadati di flusso per inferire l'utilizzo dell'applicazione.
- Esaurimento delle Risorse: L'abilitazione del DPI su controller sottodimensionati può causare picchi di CPU e pacchetti persi. Mitigazione: Dimensionare l'hardware in modo appropriato o scaricare l'ispezione su appliance di sicurezza dedicate.
ROI e Impatto sul Business
Il ritorno sull'investimento per un robusto monitoraggio WiFi si misura nella riduzione del rischio e nell'efficienza operativa. Identificando e risolvendo i problemi RF prima che abbiano un impatto sugli utenti, le sedi riducono i ticket dell'helpdesk e proteggono i flussi di entrate. Inoltre, l'integrazione del monitoraggio della rete con piattaforme come Purple consente alle aziende di sfruttare la propria infrastruttura per il marketing e le intuizioni operative, trasformando l'IT da centro di costo a risorsa strategica. Sia che si tratti di implementare in un negozio al dettaglio o di esplorare La Tua Guida alle Soluzioni Wi-Fi In-Car per Aziende , la visibilità è la chiave delle prestazioni.
Ascolta il Briefing
Termini chiave e definizioni
NetFlow / IPFIX
Network protocols used to collect IP traffic information and monitor network flow. They provide metadata about conversations (source, destination, ports) without capturing the payload.
Essential for identifying top talkers and bandwidth consumption trends without the overhead of full packet capture.
Deep Packet Inspection (DPI)
A form of computer network packet filtering that examines the data part of a packet as it passes an inspection point, searching for protocol non-compliance, viruses, spam, intrusions, or predefined criteria.
Used to identify specific applications (e.g., Netflix vs. Zoom) to enforce granular QoS policies on guest networks.
RADIUS
Remote Authentication Dial-In User Service. A networking protocol that provides centralised Authentication, Authorization, and Accounting (AAA) management.
RADIUS logs are the first place IT teams look when troubleshooting 802.1X authentication failures or latency issues.
Co-Channel Interference (CCI)
Interference caused when two or more access points are operating on the same frequency channel within range of each other, forcing them to share the airtime.
A primary cause of poor WiFi performance in dense deployments like stadiums or conference centres.
Band Steering
A feature in wireless networks that encourages dual-band clients to connect to the less congested 5GHz or 6GHz bands rather than the crowded 2.4GHz band.
Crucial for optimising RF performance and ensuring a better user experience in high-density environments.
VLAN Segmentation
The practice of dividing a physical network into multiple logical networks to isolate traffic for security and performance reasons.
Fundamental for separating secure corporate or POS traffic from untrusted guest WiFi traffic.
Quality of Service (QoS)
Technologies that manage data traffic to reduce packet loss, latency and jitter on the network, prioritising specific types of data.
Used to ensure business-critical applications (like VoIP or POS transactions) perform reliably even when the network is congested.
Alert Fatigue
The phenomenon where IT staff become desensitised to safety alerts because they are exposed to a large number of frequent alarms.
A major risk in network monitoring; mitigated by tuning thresholds and correlating events.
Casi di studio
A 200-room hotel is experiencing intermittent connectivity issues during peak evening hours. The basic dashboard shows all APs are online, but guests report slow speeds.
- Check RF Layer: Analyse channel utilisation and co-channel interference on the 2.4GHz and 5GHz bands. High utilisation on 2.4GHz is common; ensure band steering is forcing capable clients to 5GHz.
- Review Flow Data: Identify top talkers. In this scenario, flow data reveals a small number of devices consuming 70% of the bandwidth via peer-to-peer file sharing.
- Apply Policy: Implement an application control policy via the WLAN controller to throttle P2P traffic, immediately freeing up bandwidth for other guests.
A large retail chain needs to ensure its point-of-sale (POS) terminals have priority over guest WiFi traffic during a major sales event.
- Network Segmentation: Ensure POS terminals and guest traffic are on separate VLANs and SSIDs.
- Quality of Service (QoS): Configure QoS policies on the wireless controller and upstream switches to prioritise traffic originating from the POS VLAN.
- Application Inspection: Implement DPI on the guest network to block bandwidth-heavy applications like 4K video streaming during the event.
- Monitoring: Set up specific dashboards to monitor the latency and packet loss specifically for the POS subnet.
Analisi degli scenari
Q1. Your network monitoring dashboard alerts you to a sudden, massive spike in bandwidth utilisation on the guest network at a retail location. The traffic is entirely encrypted (HTTPS). How do you determine the nature of the traffic?
💡 Suggerimento:Consider what metadata is available even when the payload is encrypted.
Mostra l'approccio consigliato
While the payload is encrypted, you can use flow data (NetFlow/IPFIX) to identify the destination IP addresses and ports. Correlating this with DNS query logs or using Server Name Indication (SNI) data from the firewall will reveal the domain names being accessed, allowing you to determine if the traffic is legitimate (e.g., a large OS update) or unauthorized.
Q2. A stadium deployment is experiencing poor performance during events. The dashboard shows high channel utilisation on the 2.4GHz band, but relatively low utilisation on the 5GHz band. What is the most appropriate configuration change?
💡 Suggerimento:Think about how to balance the load across available frequencies.
Mostra l'approccio consigliato
Implement and aggressively tune Band Steering on the wireless LAN controllers. This will force dual-band capable client devices to connect to the less congested 5GHz band, freeing up airtime on the 2.4GHz band for legacy devices that only support 2.4GHz.
Q3. You are deploying a new monitoring solution and want to avoid alert fatigue for the network operations centre (NOC). How should you approach configuring alerts for AP offline events?
💡 Suggerimento:Consider the impact of a single AP failing versus multiple APs.
Mostra l'approccio consigliato
Instead of alerting on every single AP that goes offline (which might happen briefly due to PoE resets or minor switch issues), configure the system to alert based on density or critical areas. For example, trigger an alert only if multiple APs in the same zone go offline simultaneously, or if a specifically tagged 'critical' AP (e.g., covering the main lobby) drops.
