Como Monitorizar o Tráfego da Rede WiFi: Um Guia para Equipas de TI
Este guia técnico fornece estratégias acionáveis para monitorizar o tráfego WiFi empresarial, focando na arquitetura, segurança e desempenho. Prepara as equipas de TI nos setores da hotelaria, retalho e público com as estruturas necessárias para implementar soluções de monitorização de rede escaláveis e seguras.
🎧 Ouça este Guia
Ver Transcrição
Resumo Executivo
Para líderes de TI empresariais que gerem redes em locais de Hotelaria , Retalho e Transportes , o WiFi deixou de ser uma conveniência de "melhor esforço"; é uma infraestrutura crítica. Monitorizar este tráfego vai muito além de simples verificações de tempo de atividade. Uma arquitetura de monitorização robusta exige visibilidade profunda do ambiente de RF, fluxos de autenticação e tráfego da camada de aplicação para garantir desempenho e segurança. Este guia descreve os requisitos técnicos e as considerações arquitetónicas para a implementação de monitorização WiFi de nível empresarial. Exploramos as cinco camadas críticas de visibilidade da rede, a integração de plataformas de identidade e análise como a solução Guest WiFi da Purple, e as estratégias necessárias para mitigar riscos enquanto se proporciona uma experiência de utilizador fluida. Ao adotar estas estruturas, CTOs e arquitetos de rede podem fazer a transição da resolução de problemas reativa para o planeamento proativo de capacidade e deteção de ameaças.
Análise Técnica Aprofundada
A monitorização eficaz do tráfego WiFi requer uma abordagem multi-camadas, capturando dados desde o espaço aéreo físico até à camada de aplicação. Confiar apenas na sondagem SNMP para o estado do dispositivo deixa pontos cegos significativos na compreensão do comportamento do utilizador e da saúde da rede.
As Cinco Camadas de Visibilidade
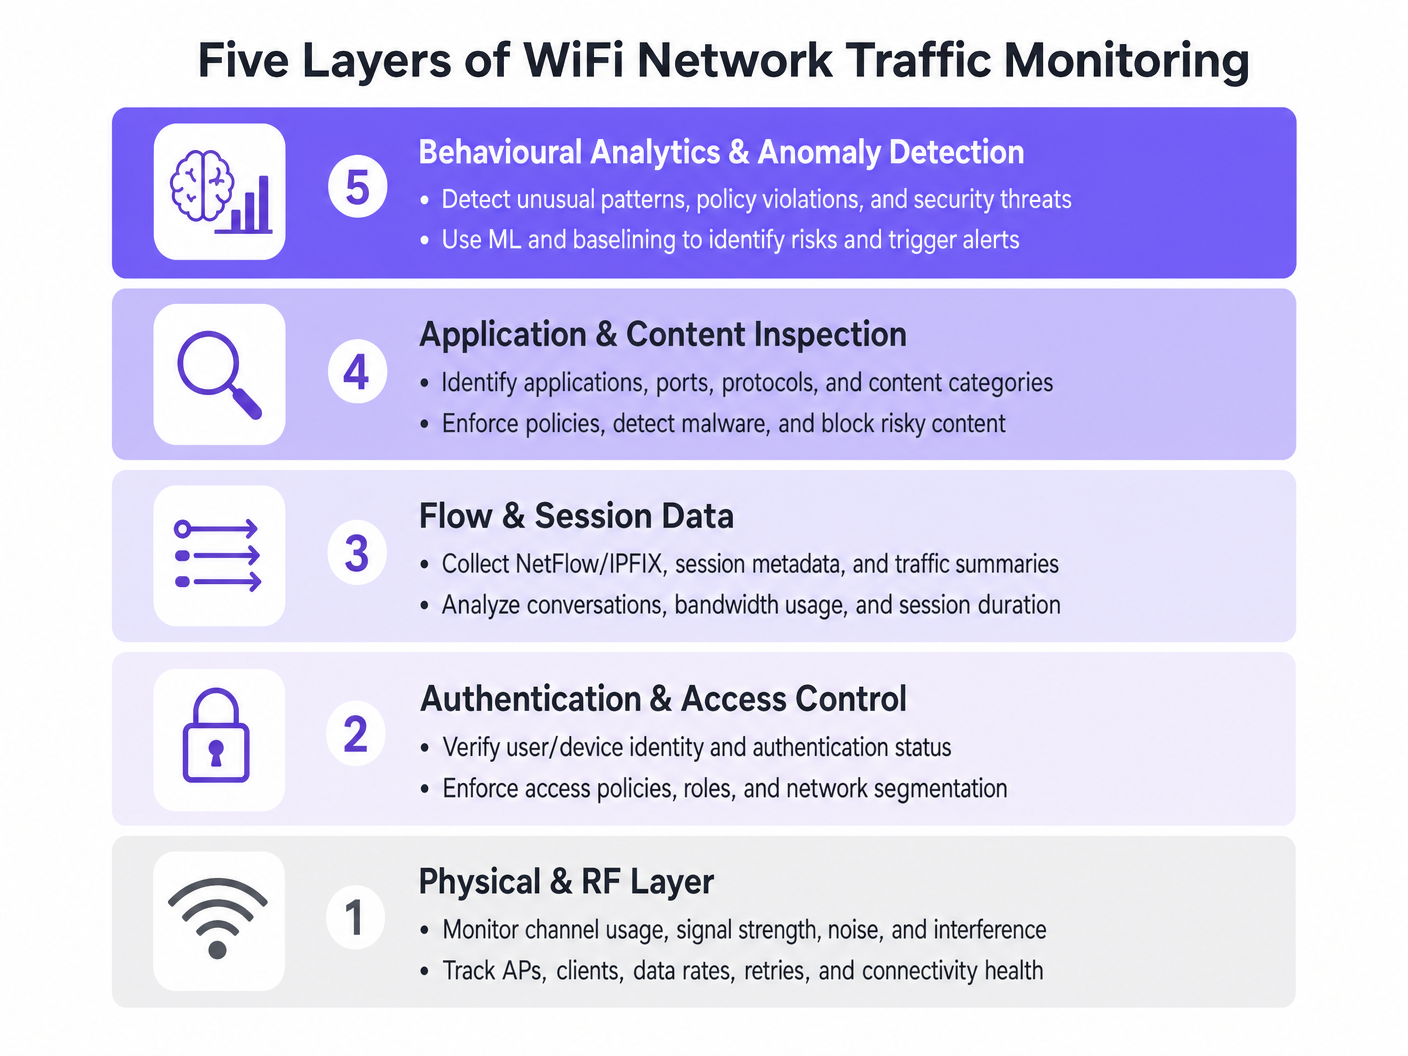
- Camada Física e de RF: Esta camada fundamental envolve a monitorização da utilização do canal, relações sinal/ruído (SNR) e interferência de co-canal. As ferramentas devem rastrear as taxas de dados do cliente e as percentagens de repetição. Altas taxas de repetição indicam frequentemente problemas de RF muito antes da saturação da largura de banda ocorrer.
- Autenticação e Controlo de Acesso: A monitorização de registos RADIUS e transações 802.1X é crítica. Ao analisar a latência de autenticação e as taxas de falha, as equipas podem isolar problemas no serviço de diretório ou na infraestrutura sem fios. Isto é particularmente relevante ao implementar Segurança WiFi BYOD: Como Permitir Dispositivos Pessoais na Sua Rede em Segurança .
- Dados de Fluxo e Sessão: A utilização de protocolos como NetFlow, IPFIX e sFlow fornece metadados sobre conversas de rede sem a sobrecarga da captura completa de pacotes. Estes dados revelam os principais emissores, tendências de consumo de largura de banda e padrões de tráfego incomuns.
- Inspeção de Aplicações e Conteúdo: A Inspeção Profunda de Pacotes (DPI) ao nível do controlador de LAN sem fios ou firewall permite que as equipas de TI identifiquem aplicações específicas (por exemplo, distinguir entre VoIP corporativo e streaming de vídeo de consumidor). Esta visibilidade é essencial para aplicar políticas de Qualidade de Serviço (QoS).
- Análise Comportamental e Deteção de Anomalias: A camada mais avançada utiliza aprendizagem automática para estabelecer uma linha de base do comportamento normal da rede. Quando um dispositivo se desvia da sua linha de base — como um dispositivo IoT que de repente transmite grandes volumes de dados — o sistema aciona um alerta, facilitando uma resposta rápida a incidentes.
Integração Arquitetónica
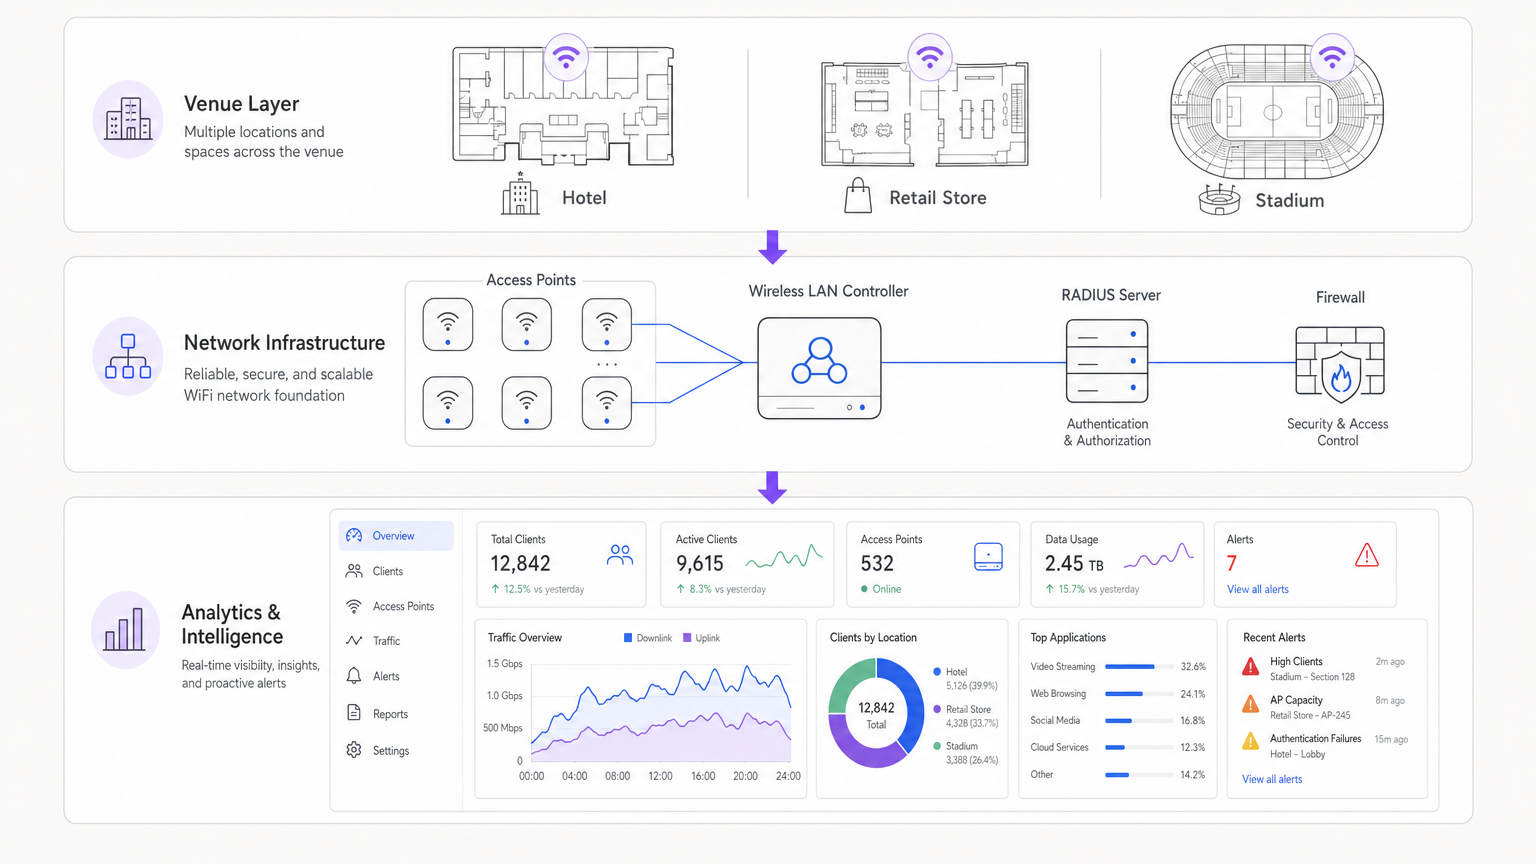
As arquiteturas modernas centralizam os dados de telemetria de pontos de acesso distribuídos. Quer se utilize uma solução gerida na nuvem ou um controlador local, a agregação de registos num SIEM (Security Information and Event Management) ou numa plataforma de análise dedicada é crucial. A integração de fornecedores de identidade, como o WiFi Analytics da Purple, enriquece os dados brutos da rede com contexto de utilizador, transformando um endereço IP num perfil de utilizador acionável.
Guia de Implementação
A implementação de uma solução de monitorização abrangente requer um planeamento cuidadoso para evitar sobrecarregar os recursos da rede ou gerar fadiga de alertas.
Passo 1: Definir Requisitos de Telemetria
Determine quais os protocolos que a sua infraestrutura suporta. Ative NetFlow/IPFIX em switches e firewalls centrais, e configure os pontos de acesso para encaminhar syslog e métricas de RF para um coletor central.
Passo 2: Implementar Segmentação de Rede
Isole o tráfego em VLANs distintas: Corporativa, Convidado e IoT. Aplique diferentes perfis de monitorização a cada uma. Por exemplo, a inspeção profunda de pacotes pode ser fortemente aplicada à rede de Convidado para impor políticas de uso aceitável, enquanto os dados de fluxo são suficientes para o segmento IoT.
Passo 3: Configurar a Integração de Identidade
Ligue as suas ferramentas de monitorização de rede ao seu backend de autenticação. Ao gerir implementações complexas como WiFi em Hospitais: Um Guia para Redes Clínicas Seguras , correlacionar um endereço MAC com uma função de utilizador específica (por exemplo, clínico vs. paciente) é essencial para uma resolução rápida de problemas.
Passo 4: Ajustar Limiares de Alerta
Evite limiares estáticos que acionam falsos positivos durante as horas de pico. Implemente a definição de linha de base dinâmica sempre que possível. Comece com alertas críticos (por exemplo, controlador offline, falhas de autenticação em massa) e introduza gradualmente alertas baseados no desempenho (por exemplo, alta utilização do canal) à medida que compreende a linha de base da sua rede.
Melhores Práticas
- Priorize Dados de Fluxo em Detrimento da Captura de Pacotes: A captura completa de pacotes consome muitos recursos e é frequentemente desnecessária para a monitorização de rotina. Confie em NetFlow/IPFIX para 90% das suas necessidades de visibilidade.
- Aplique Controlo de Acesso Baseado em Funções (RBAC): Garanta que apenas pessoal autorizado tem acesso a dashboards de monitorização sensíveis, particularmente aqueles que exibem dados de identidade do utilizador.
- Reveja Regularmente as Assinaturas DPI: As assinaturas de aplicações mudam frequentemente. Garanta que os seus motores DPI são atualizados automaticamente para manter o tráfego preciso.classificação IC.
- Considerar o Hardware: Ao selecionar a infraestrutura, conforme descrito em Your Guide to a Wireless Access Point Ruckus , garanta que os APs tenham a capacidade de processamento para lidar com a inspeção de tráfego local sem degradar o desempenho do cliente.
Resolução de Problemas e Mitigação de Riscos
Modos de Falha Comuns
- Fadiga de Alertas: Quando os sistemas de monitorização geram muito ruído, os alertas críticos são perdidos. Mitigação: Implementar motores de correlação de alertas para agrupar eventos relacionados.
- Pontos Cegos no Tráfego Encriptado: À medida que mais tráfego muda para HTTPS e TLS 1.3, a inspeção de payload torna-se difícil. Mitigação: Confiar no encaminhamento SNI (Server Name Indication), consultas DNS e metadados de fluxo para inferir o uso da aplicação.
- Esgotamento de Recursos: Ativar o DPI em controladores subdimensionados pode causar picos de CPU e perda de pacotes. Mitigação: Dimensionar o hardware adequadamente ou descarregar a inspeção para dispositivos de segurança dedicados.
ROI e Impacto no Negócio
O retorno do investimento para uma monitorização robusta de WiFi é medido na redução de riscos e na eficiência operacional. Ao identificar e resolver problemas de RF antes que afetem os utilizadores, os locais reduzem os tickets de suporte e protegem as fontes de receita. Além disso, a integração da monitorização de rede com plataformas como a Purple permite que as empresas aproveitem a sua infraestrutura para obter insights de marketing e operacionais, transformando a IT de um centro de custos num ativo estratégico. Seja a implementar numa loja de retalho ou a explorar Your Guide to Enterprise In Car Wi Fi Solutions , a visibilidade é a chave para o desempenho.
Ouvir o Briefing
Termos-Chave e Definições
NetFlow / IPFIX
Network protocols used to collect IP traffic information and monitor network flow. They provide metadata about conversations (source, destination, ports) without capturing the payload.
Essential for identifying top talkers and bandwidth consumption trends without the overhead of full packet capture.
Deep Packet Inspection (DPI)
A form of computer network packet filtering that examines the data part of a packet as it passes an inspection point, searching for protocol non-compliance, viruses, spam, intrusions, or predefined criteria.
Used to identify specific applications (e.g., Netflix vs. Zoom) to enforce granular QoS policies on guest networks.
RADIUS
Remote Authentication Dial-In User Service. A networking protocol that provides centralised Authentication, Authorization, and Accounting (AAA) management.
RADIUS logs are the first place IT teams look when troubleshooting 802.1X authentication failures or latency issues.
Co-Channel Interference (CCI)
Interference caused when two or more access points are operating on the same frequency channel within range of each other, forcing them to share the airtime.
A primary cause of poor WiFi performance in dense deployments like stadiums or conference centres.
Band Steering
A feature in wireless networks that encourages dual-band clients to connect to the less congested 5GHz or 6GHz bands rather than the crowded 2.4GHz band.
Crucial for optimising RF performance and ensuring a better user experience in high-density environments.
VLAN Segmentation
The practice of dividing a physical network into multiple logical networks to isolate traffic for security and performance reasons.
Fundamental for separating secure corporate or POS traffic from untrusted guest WiFi traffic.
Quality of Service (QoS)
Technologies that manage data traffic to reduce packet loss, latency and jitter on the network, prioritising specific types of data.
Used to ensure business-critical applications (like VoIP or POS transactions) perform reliably even when the network is congested.
Alert Fatigue
The phenomenon where IT staff become desensitised to safety alerts because they are exposed to a large number of frequent alarms.
A major risk in network monitoring; mitigated by tuning thresholds and correlating events.
Estudos de Caso
A 200-room hotel is experiencing intermittent connectivity issues during peak evening hours. The basic dashboard shows all APs are online, but guests report slow speeds.
- Check RF Layer: Analyse channel utilisation and co-channel interference on the 2.4GHz and 5GHz bands. High utilisation on 2.4GHz is common; ensure band steering is forcing capable clients to 5GHz.
- Review Flow Data: Identify top talkers. In this scenario, flow data reveals a small number of devices consuming 70% of the bandwidth via peer-to-peer file sharing.
- Apply Policy: Implement an application control policy via the WLAN controller to throttle P2P traffic, immediately freeing up bandwidth for other guests.
A large retail chain needs to ensure its point-of-sale (POS) terminals have priority over guest WiFi traffic during a major sales event.
- Network Segmentation: Ensure POS terminals and guest traffic are on separate VLANs and SSIDs.
- Quality of Service (QoS): Configure QoS policies on the wireless controller and upstream switches to prioritise traffic originating from the POS VLAN.
- Application Inspection: Implement DPI on the guest network to block bandwidth-heavy applications like 4K video streaming during the event.
- Monitoring: Set up specific dashboards to monitor the latency and packet loss specifically for the POS subnet.
Análise de Cenários
Q1. Your network monitoring dashboard alerts you to a sudden, massive spike in bandwidth utilisation on the guest network at a retail location. The traffic is entirely encrypted (HTTPS). How do you determine the nature of the traffic?
💡 Dica:Consider what metadata is available even when the payload is encrypted.
Mostrar Abordagem Recomendada
While the payload is encrypted, you can use flow data (NetFlow/IPFIX) to identify the destination IP addresses and ports. Correlating this with DNS query logs or using Server Name Indication (SNI) data from the firewall will reveal the domain names being accessed, allowing you to determine if the traffic is legitimate (e.g., a large OS update) or unauthorized.
Q2. A stadium deployment is experiencing poor performance during events. The dashboard shows high channel utilisation on the 2.4GHz band, but relatively low utilisation on the 5GHz band. What is the most appropriate configuration change?
💡 Dica:Think about how to balance the load across available frequencies.
Mostrar Abordagem Recomendada
Implement and aggressively tune Band Steering on the wireless LAN controllers. This will force dual-band capable client devices to connect to the less congested 5GHz band, freeing up airtime on the 2.4GHz band for legacy devices that only support 2.4GHz.
Q3. You are deploying a new monitoring solution and want to avoid alert fatigue for the network operations centre (NOC). How should you approach configuring alerts for AP offline events?
💡 Dica:Consider the impact of a single AP failing versus multiple APs.
Mostrar Abordagem Recomendada
Instead of alerting on every single AP that goes offline (which might happen briefly due to PoE resets or minor switch issues), configure the system to alert based on density or critical areas. For example, trigger an alert only if multiple APs in the same zone go offline simultaneously, or if a specifically tagged 'critical' AP (e.g., covering the main lobby) drops.
