Executive summary
For decades, commercial venue operators made major merchandising, staffing, and promotional decisions based on intuition. While retail eCommerce sites tracked every impression, bounce rate, and cart abandonment with surgical precision, physical venues operated in relative data blindness. Up to 90% of in-store footfall entered and exited without leaving a trace of customer identity.
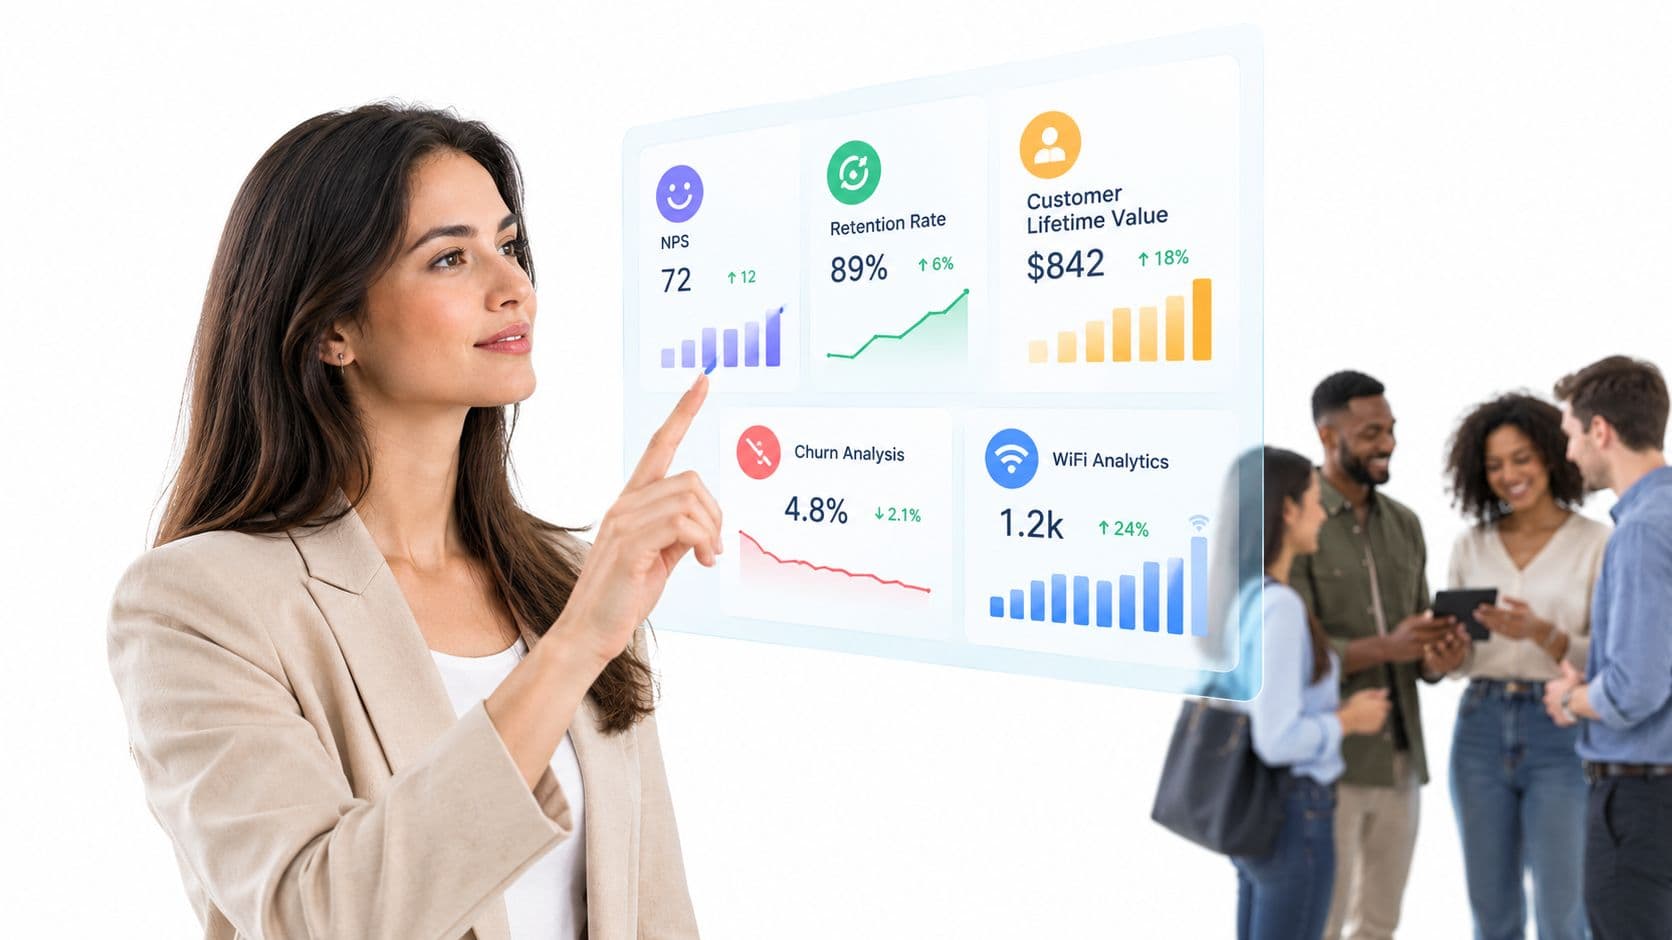
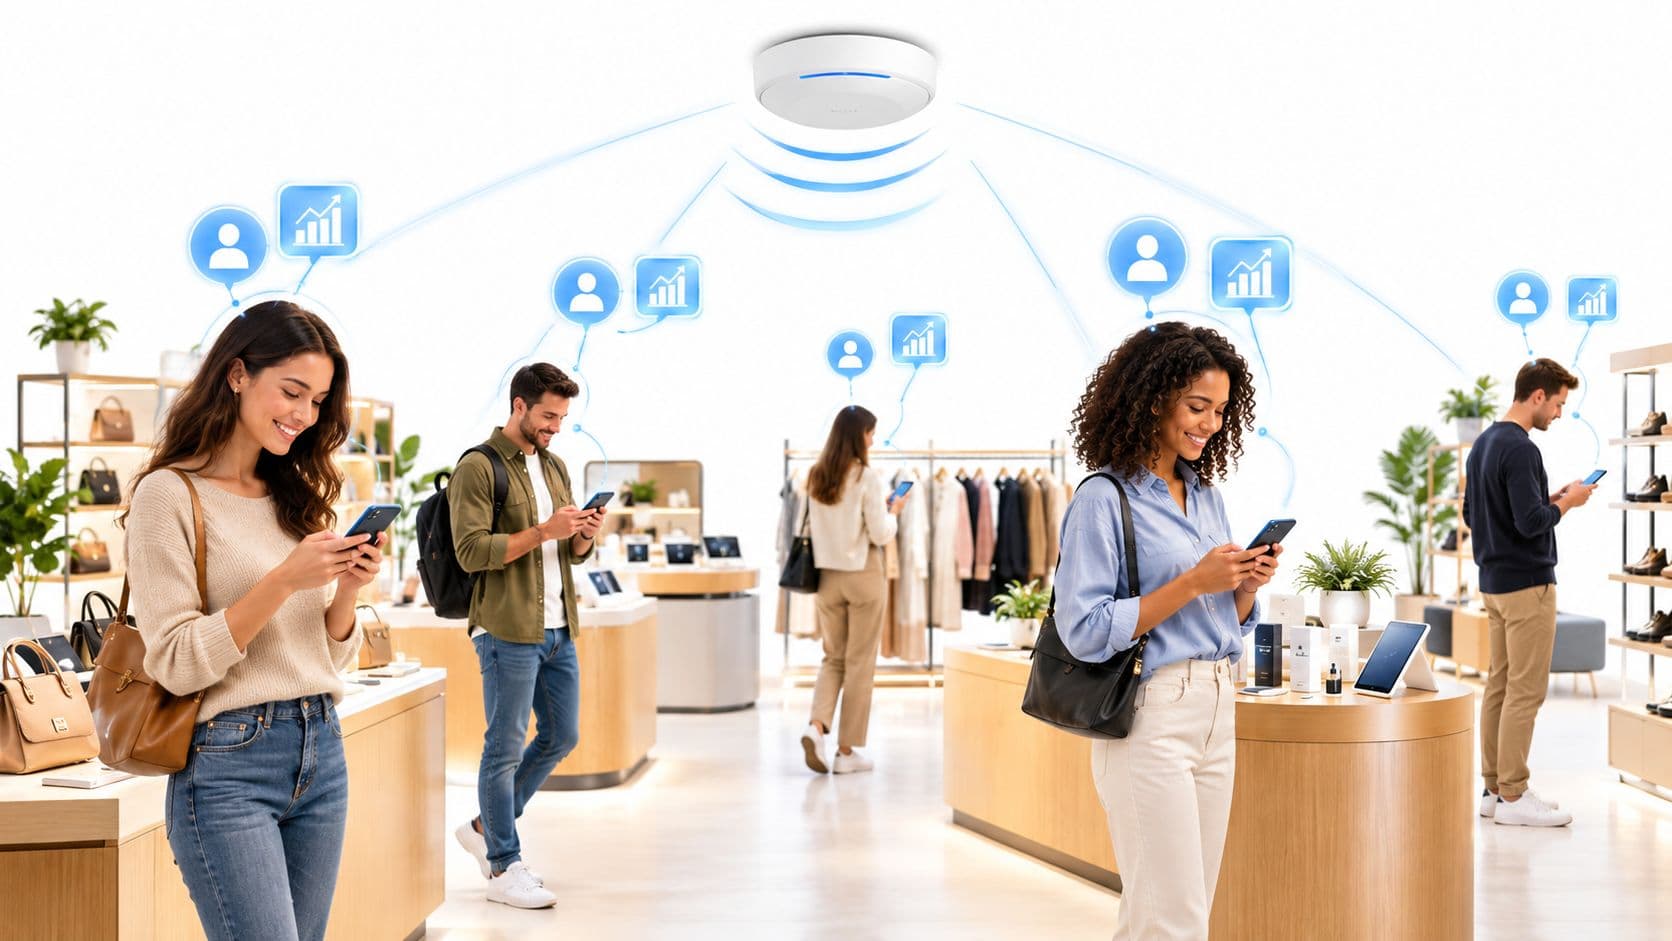
Today, physical venue big data transforms this dynamic. By analyzing real-time radio frequency telemetry from wireless access points and capturing verified customer profiles through guest WiFi captive portals, brick-and-mortar operators bridge the offline-to-online analytics gap. Venues that implement data-driven visitor marketing capture thousands of verified first-party CRM profiles monthly at an average acquisition cost of $0.35 per contact - compared to $4.20 or more on paid digital search and social channels.
This technical guide examines how commercial venue operators use big data analytics to model footfall, optimize dwell times, trigger automated marketing workflows, and achieve measurable revenue growth.
The 4 Vs of physical venue big data
Data science categorizes big data across four primary dimensions: Volume, Velocity, Variety, and Veracity. In physical environments, these dimensions manifest through spatial and temporal sensor streams:
| Dimension | Physical Venue Telemetry | Commercial Application |
|---|---|---|
| Volume | Millions of probe requests and association logs per hour across venue access points. | Aggregated footfall volume modeling, entrance conversion rates, and hourly venue occupancy. |
| Velocity | Real-time RSSI signal tracking and sub-second captive portal authentication events. | Triggering instant in-venue promotional vouchers and detecting high-dwell browsing hotspots. |
| Variety | Unstructured probe telemetry combined with structured CRM profiles (demographics, visit history, POS receipts). | Building 360-degree customer records that link physical presence with digital transactions. |
| Veracity | Verified email and cell phone numbers authenticated during network sign-in vs noisy randomized MAC addresses. | High-accuracy identity resolution, eliminating duplicate records and false marketing contacts. |
The first-party data imperative for physical venues
Two major structural shifts have made physical data capture essential for commercial brands:
- Third-party cookie depreciation and paid ad inflation: Rising customer acquisition costs (CAC) on digital channels make owned first-party data vital. Capturing verified visitor emails and cell phone numbers in-store provides an owned communication channel immune to ad platform price swings.
- Mobile operating system privacy controls: iOS and Android device MAC address randomization limits passive hardware-only tracking. Branded captive portal authentication solves this challenge by securing explicit, CCPA/CPRA-compliant customer opt-in consent during connection.
For detailed architectural best practices on deploying secure, high-conversion captive networks, consult our comprehensive Captive Portal Guide.
5 data-driven playbooks that boost venue sales
1. Automated post-visit re-engagement triggers
Physical venue operators can configure automated marketing workflows triggered by visit milestones. When a visitor authenticates via guest WiFi, their profile synchronizes instantly with enterprise CRMs such as HubSpot, Salesforce, or Klaviyo via webhooks:
- Day 3 follow-up: Deliver a personalized thank-you email with an incentive for their next visit.
- Day 14 win-back: If a previously frequent visitor has not returned within their typical cycle, trigger a targeted SMS promotion offering 15% off during off-peak hours.
- Outcome: Retail and hospitality venues deploying automated re-engagement workflows report a 22% increase in repeat visit frequency within 90 days.
2. Dwell-time monetization and basket size optimization
WiFi presence analytics measure how long visitors spend in specific commercial zones. Correlating dwell times with point-of-sale (POS) transaction records reveals high-conversion display layouts and underperforming areas. Venues can test promotional displays, measure resulting dwell-time increases, and verify sales uplift.
To evaluate your venue's spatial analytics and RF deployment requirements, explore our dedicated WiFi Analytics Guide.
3. Real-time presence offers during peak footfall
By defining virtual zones (geofencing) using wireless access points, venues detect when visitors enter high-value concourses or dining areas. The platform can trigger instant, time-limited coupon codes to connected cell phones, encouraging spontaneous purchases before visitors leave the venue.
4. Automated review generation and reputation boosting
Customer reviews directly influence foot traffic in hospitality, leisure, and retail venues. Setting up an automated workflow that sends a review request (Google Reviews, TripAdvisor, Trustpilot) two hours after a guest disconnects from WiFi captures feedback while the positive experience is fresh. Venues using this workflow average a 4x increase in verified five-star public reviews.
For strategic frameworks on loyalty schemes and campaign automation, read our WiFi Marketing Guide.
5. At-risk customer churn prevention
By establishing baseline visit frequencies for registered loyalty guests, predictive analytics flag customers whose visit intervals begin to lengthen. Identifying at-risk churn before a customer lapses completely allows marketing teams to deploy targeted retention offers automatically.
Commercial proof and ROI benchmarks
Data-driven venue intelligence delivers proven commercial returns across global enterprise brands:
- Harrods: Achieved a 57x return on investment (ROI) through targeted visitor segmentation and loyalty data capture.
- Global Venue Scale: Purple powers connectivity and analytics across 80,000+ live venues globally, processing over 440 million annual logins and managing 29 billion behavioral data points.
- Lead Cost Efficiency: Generating customer contacts via captive portal WiFi data costs $0.35 per record on average, compared to $4.20 to $7.50 per verified lead on paid social media advertising.
Hardware compatibility and network architecture
Purple is completely hardware-agnostic and overlays directly onto existing enterprise wireless infrastructure without requiring costly hardware replacements or network reconfiguration. Compatible access point manufacturers include:
- Cisco Meraki (MR series with Location Analytics API)
- HPE Aruba Networking (Central & AirWave)
- Ruckus Wireless (SmartZone & Cloud)
- Juniper Mist (AI-driven wireless & vBLE)
- Ubiquiti UniFi, Extreme Networks, Fortinet, and Cambium Networks
Network engineers and IT architects can test subnet sizing, RADIUS authentication, and IP allocation using our free WiFi tools suite.
Privacy compliance and enterprise security governance
Deploying big data analytics in physical spaces requires rigorous regulatory governance. Purple complies with international privacy frameworks:
- ISO 27001 Certified: Certified information security management systems governing all data storage and transit.
- GDPR & CCPA Compliant: Explicit opt-in consent capture with complete audit trails, granular marketing preference centers, and automated right-to-be-forgotten deletion workflows.
- Data Encryption: All visitor telemetry is encrypted in transit via TLS 1.3 and at rest using AES-256 standards.