WiFi presence analytics and footfall calculator
Model venue passerby capture rates, probe signal detection, dwell time brackets, and enterprise access point telemetry requirements across your physical estate.
50,400
14%
1,680 inside visitors / day1,512
Assumes 90% probe visibility; MAC randomisation inflates unique counts538
16,140 / month24 mins
Continuous RF trackingVisitor dwell time bracket distribution
Derived from continuous 802.11 probe duration and RSSI boundary thresholds.
Activate WiFi presence analytics on your network
Purple connects natively to Cisco Meraki and all major enterprise access points. Turn ambient wireless signals into actionable visitor journeys, dwell segmentation, and verified CRM profiles.
What authentication changes about presence data
The difference between the two measurements is not the hardware. It is whether the device joined the network.
A staff device joins. It presents a certificate, an 802.1X identity or an iPSK, and from that moment the network associates every session with a known person. Attendance by day, visit frequency and time on site are all attributable, and they stay attributable when the device rotates its MAC address, because the identity was never the MAC address in the first place.
A guest device usually does not join. Presence analytics reads the probe requests it broadcasts while looking for networks, and identifies it by the MAC address in those probes. Since iOS 14 and Android 10, that address rotates. One person walking past on five occasions can register as five first-time devices, so unique visitor counts drift upward and return-visit rates drift downward.
That has a practical consequence worth stating plainly. Guest presence is sound for direction of travel: whether footfall rose week on week, which zones fill first, how a campaign moved the shape of a day. It is not sound as a headcount, and it should not be used to claim how many individual people returned. When the question is who was in the building and for how long, the answer has to come from authenticated staff WiFi rather than from probe requests.
Physical venues - from retail chains and shopping malls to airports, stadiums, and hotel groups - operate in a physical environment where understanding visitor movement is vital. Online e-commerce stores track every click, bounce rate, and cart abandonment using web analytics. Physical venues rely on WiFi location analytics to gain identical visibility into offline footfall and visitor movement.
WiFi presence analytics bridges the gap between digital analytics and physical spaces. By measuring Received Signal Strength Indicator (RSSI) probe requests emitted by mobile devices, venue operators turn existing wireless hardware into a continuous location intelligence engine. This guide explains how presence analytics works, how it compares to active captive portal data capture, and how enterprise venues use location insights to increase venue revenue.
revenue.What is WiFi presence analytics?
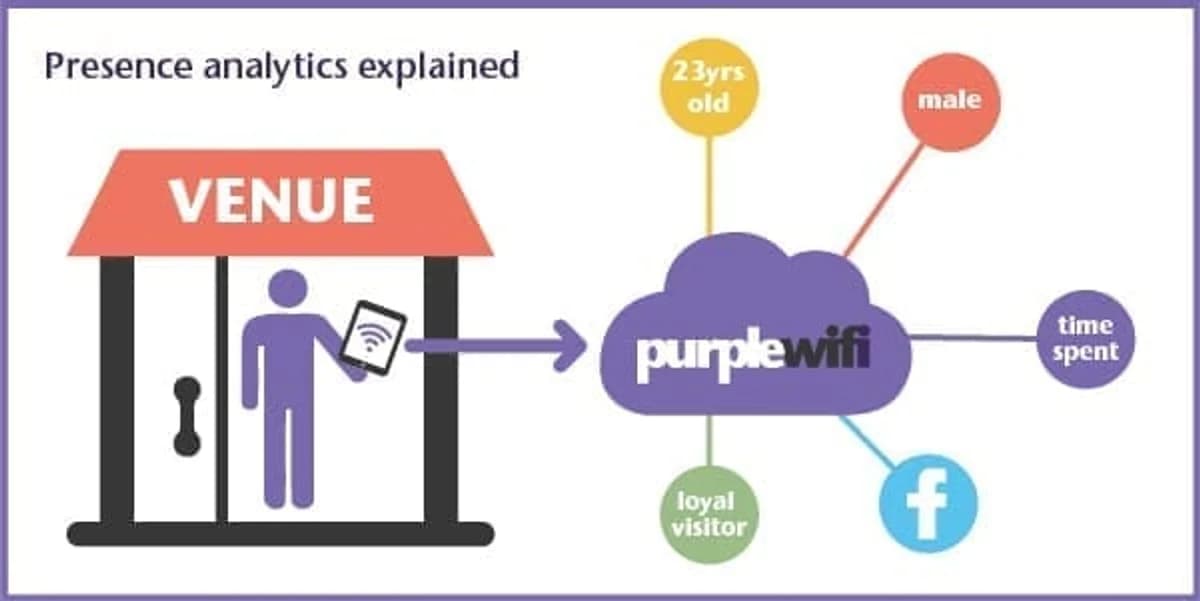
WiFi presence analytics is a passive measurement technology that detects and analyzes wireless signals emitted by cell phones, tablets, and wearables near an access point. When a mobile device has WiFi enabled, it periodically broadcasts probe request frames to discover nearby networks. Wireless access points record these signals, logging the device's unique MAC address, timestamp, and signal strength.
Unlike active guest WiFi captive portal login pages that require visitors to fill in a registration form, presence analytics operates entirely in the background. It measures total footfall, passerby traffic, venue dwell times, and return frequency across all WiFi-enabled devices - regardless of whether the user connects to the guest network.
How WiFi presence analytics works: RSSI and signal detection
The core mechanism powering presence analytics is the Received Signal Strength Indicator (RSSI), measured in decibels relative to a milliwatt (dBm). RSSI quantifies the relative power level of a received wireless signal:
- Strong signal (-30 dBm to -55 dBm): Indicates the device is inside the venue, close to an internal access point.
- Moderate signal (-56 dBm to -75 dBm): Indicates the device is inside the venue perimeter or in adjacent aisles.
- Weak signal (-76 dBm to -90 dBm): Indicates passerby traffic outside the venue storefront or building entrance.
By establishing RSSI signal thresholds across a venue's wireless network, Purple's analytics engine categorizes visitor movement into three distinct engagement zones:
- Passerby traffic: Devices detected outside the venue perimeter with signal strength below the store entry threshold.
- Visited traffic: Devices crossing the entry RSSI threshold and remaining inside the venue for a minimum duration (e.g., 3 minutes).
- Engaged traffic: Devices dwelling inside specific department zones or connecting directly to the guest WiFi network.
Presence analytics vs captive portal analytics vs Bluetooth beacons
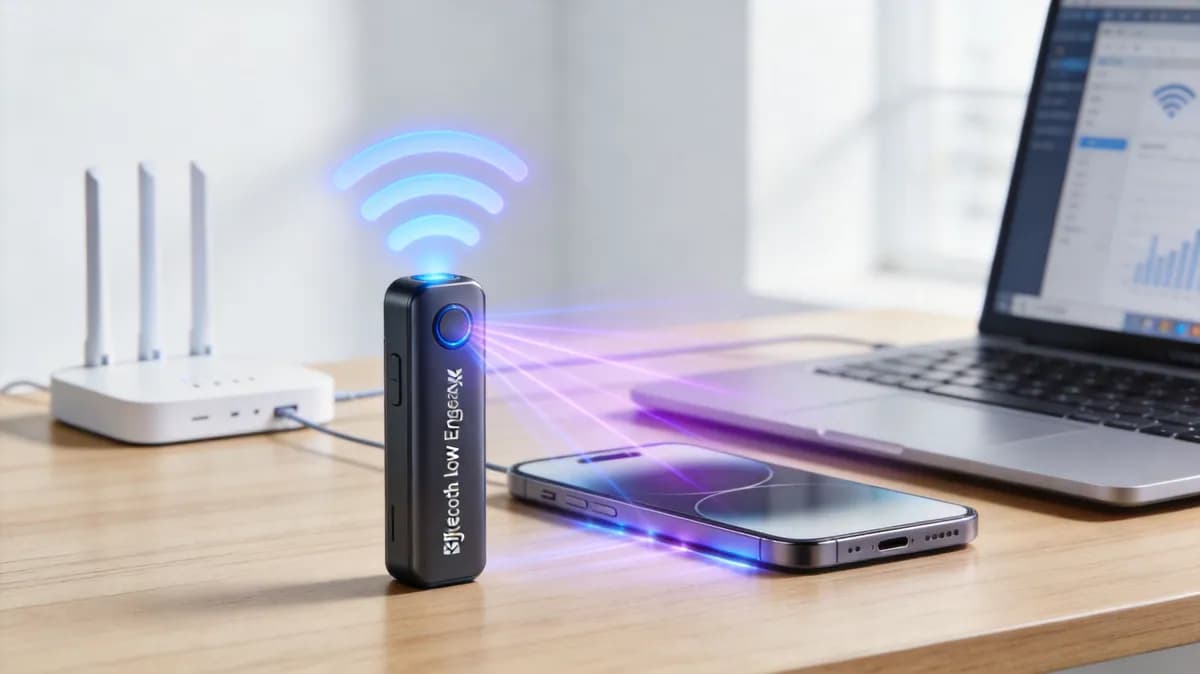
Venue operators often combine multiple location technologies to achieve comprehensive physical intelligence. The table below outlines key operational differences across passive WiFi presence analytics, active captive portal authentication, and Bluetooth Low Energy (BLE) beacons:
| Technology | Data collection method | Visitor interaction required | Key metrics delivered | Privacy & consent model |
|---|---|---|---|---|
| WiFi Presence Analytics | Passive RSSI probe request tracking via existing access points. | None (Zero friction, background measurement). | Total footfall, passerby conversion, dwell time, return rate. | Anonymous MAC hashing; fully compliant with CCPA/CPRA and GDPR. |
| Captive Portal Analytics | Active sign-up form submission during WiFi authentication. | Guest connects to network & submits email/form details. | First-party CRM profiles, verified emails, demographics, opt-ins. | Explicit double opt-in consent for marketing communications. |
| Bluetooth Beacons (BLE) | Short-range radio signal advertising to installed mobile apps. | User must download brand app & enable Bluetooth permissions. | Sub-meter indoor positioning, aisle-level push notifications. | Mobile app location permission & Bluetooth authorization. |
Key footfall and location metrics tracked
Purple aggregates raw RSSI probe data into structured reports accessible through the Purple Portal. Venue management teams track four primary performance indicators:
- Storefront capture rate: The percentage of total exterior passerby traffic that enters the physical venue. Comparing capture rates across store locations identifies high-performing display windows and marketing promotions.
- Average dwell time: The duration visitors spend inside the venue or within specific departments. Increasing dwell time directly correlates with higher average transaction values in retail and hospitality settings.
- New vs repeat visitor ratio: The breakdown between first-time visitors and returning guests over 7, 30, or 90-day windows. High repeat rates indicate strong customer loyalty and retention.
- Recency of visits: The average interval between customer visits. Tracking recency trends allows marketers to trigger targeted re-engagement campaigns when visit frequency declines.
Commercial applications across enterprise verticals
Leading global brands - including McDonald's, Under Armour, Sweetgreen, Chase, and Eastern Michigan University - deploy presence analytics across thousands of commercial venues to solve key operational challenges:
1. Retail and shopping malls
Retail operations managers use presence analytics to evaluate store layout efficiency, compare tenant footfall in shopping malls, and align staffing schedules with peak traffic hours. Marketing teams measure storefront conversion rates before and after launching window campaigns.
2. Hospitality and restaurants
Hospitality operators track guest turnover speed, peak dining hours, and bar area congestion. Combining presence analytics with WiFi marketing tools enables venues to trigger automated SMS or email review requests shortly after a guest leaves the premises.
3. Airports and travel hubs
Transit authorities and airport operators track passenger flow through security checkpoints, terminal concessions, and departure gates. Presence analytics identifies bottleneck zones, allowing staff to re-route passenger queues in real time.
Privacy, CCPA/CPRA, and MAC address anonymization
Privacy compliance is central to modern wireless analytics. Devices transmit MAC addresses during probe requests, which regulatory bodies (including the FTC and state attorneys general and EU privacy regulators) classify as pseudonymous data.
Purple ensures full CCPA/CPRA and ePrivacy Directive compliance through automated privacy protections:
- One-way cryptographic hashing: MAC addresses are immediately hashed using SHA-256 algorithms upon reception, preventing reverse-engineering of original hardware IDs.
- Randomized MAC handling: Modern operating systems (iOS and Android) utilize MAC randomization for unassociated probe requests. Purple's analytics engine processes randomized signals into aggregate trend metrics without attempting device re-identification.
- Explicit opt-out management: Visitors can opt out of location tracking entirely by disabling WiFi or submitting an opt-out request through Purple's central privacy portal.
Frequently asked questions about WiFi presence analytics
Does a visitor need to connect to the venue WiFi for presence analytics to work?
No. WiFi presence analytics measures passive RSSI probe requests broadcast by any mobile device with WiFi enabled. Visitors do not need to authenticate or log into the guest WiFi network to be counted in total footfall and dwell time metrics.
What is the difference between presence analytics and location tracking?
Presence analytics measures aggregate footfall, entry counts, and dwell duration within broad venue zones using RSSI signal levels. Location tracking (or indoor positioning) uses multi-access point triangulation or BLE beacons to determine a specific device's precise coordinates in real time.
Is WiFi presence analytics compliant with CCPA/CPRA regulations?
Yes. Purple's presence analytics engine immediately anonymizes incoming device MAC addresses via one-way SHA-256 hashing. Aggregate reports contain no personally identifiable information (PII) unless a visitor explicitly consents by logging into the guest WiFi captive portal.
Which hardware access points support Purple presence analytics?
Purple is hardware-agnostic and integrates natively with leading enterprise wireless vendors, including Cisco Meraki, HPE Aruba, Ruckus Wireless, Juniper Mist, Ubiquiti UniFi, Fortinet, and Extreme Networks.
Unlock location intelligence across your venue estate
Turn your existing access points into a real-time presence analytics engine. Purple connects seamlessly with Cisco Meraki, HPE Aruba, Ruckus, and UniFi hardware to deliver footfall insights, captive portal data capture, and CRM integration.