Temps moyen d'innocence : comment prouver que ce n'est pas le WiFi
Le temps moyen d'innocence (MTTI) est la métrique essentielle définissant le temps passé par les équipes informatiques à prouver qu'un problème réseau n'est pas de leur faute. Ce guide détaille une méthodologie d'observabilité en cinq étapes pour éliminer le jeu du blâme dans les environnements multi-locataires, remplaçant les accusations mutuelles par des preuves partagées afin de réduire le temps moyen de résolution (MTTR).
Écouter ce guide
Voir la transcription du podcast
📚 Part of our core series: WiFi multi-locataire : le guide complet →
Résumé analytique
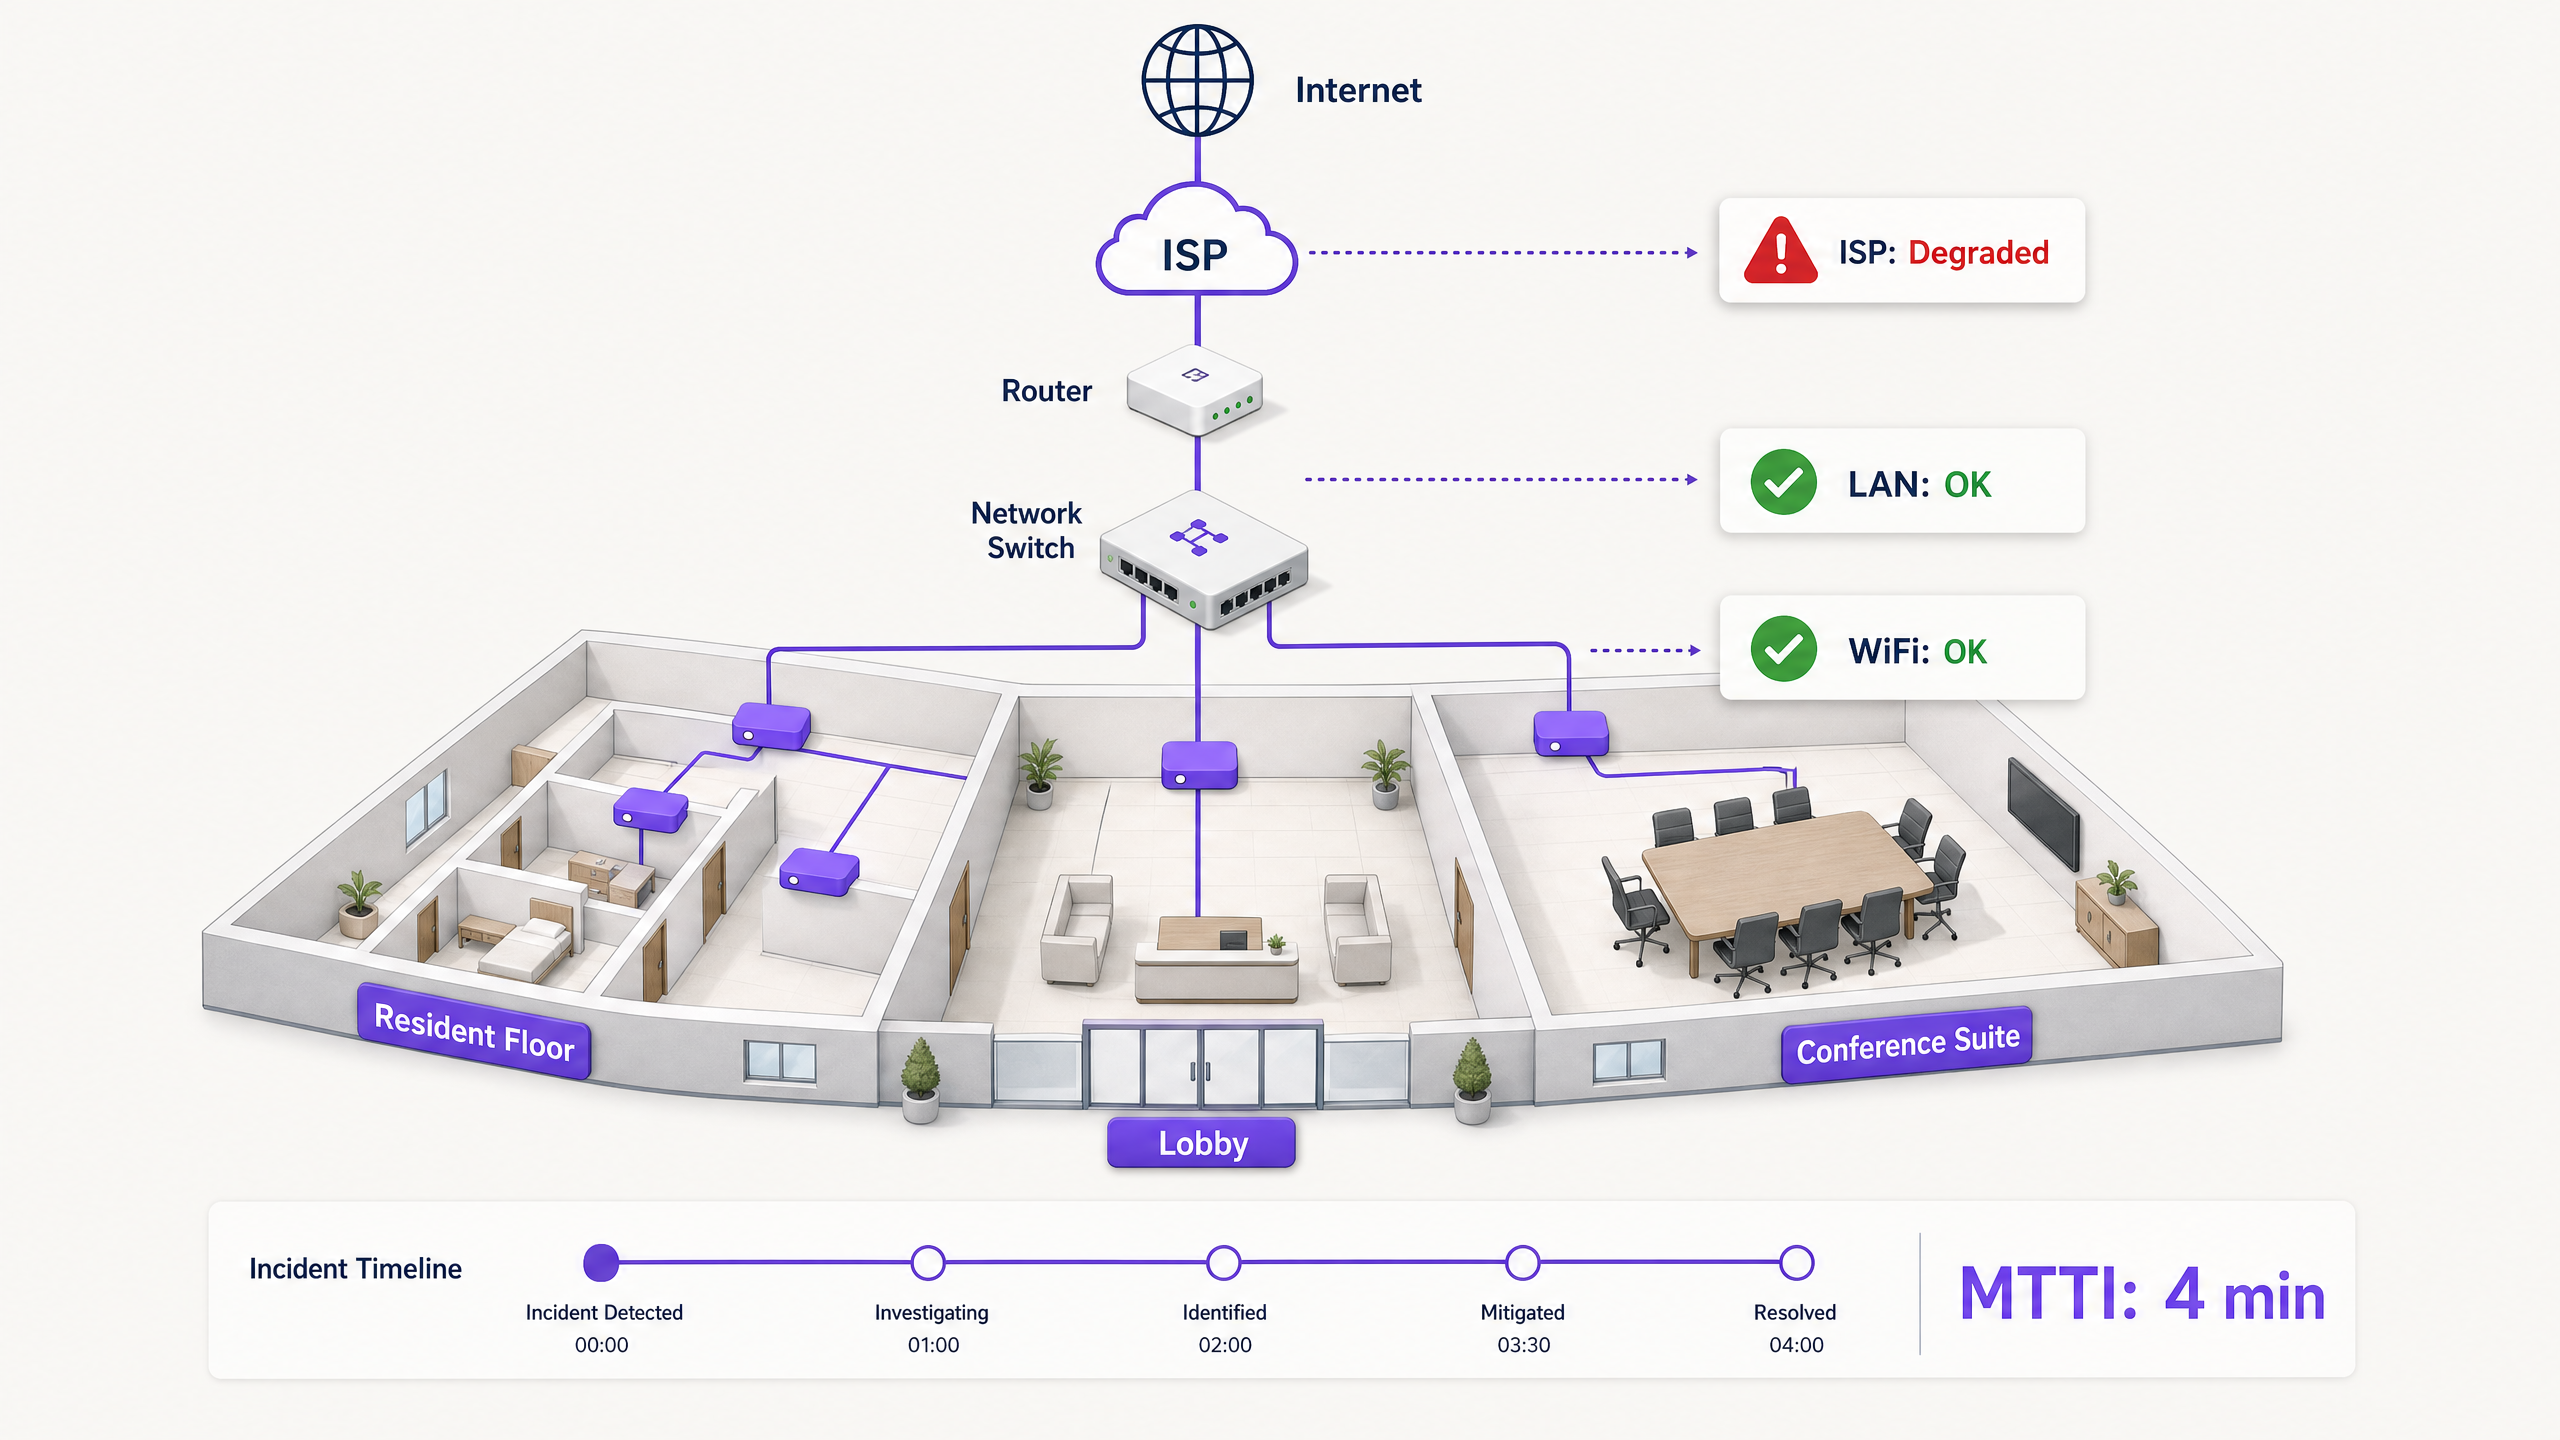
Lorsque la connectivité chute dans un environnement multi-locataire, le WiFi est le premier accusé. C'est la périphérie visible du réseau, le dernier saut avant l'appareil, et la cible la plus facile pour les utilisateurs frustrés. Pour les responsables informatiques, les architectes réseau et les directeurs de l'exploitation des sites, cela crée une taxe opérationnelle persistante : le temps passé à prouver son innocence.
Le temps moyen d'innocence (MTTI) mesure le temps moyen écoulé entre le signalement d'un incident et la capacité d'une équipe à démontrer que son domaine n'est pas la cause racine. Dans des environnements complexes tels que les immeubles résidentiels locatifs (BTR), les hôtels ou les centres de conférence, le réseau est fragmenté entre les gestionnaires immobiliers, les fournisseurs de WiFi géré et les fournisseurs d'accès Internet (FAI). Sans télémétrie définitive, le MTTI gonfle le temps moyen de résolution (MTTR) car les équipes se disputent la responsabilité au lieu de corriger la panne.
Ce guide détaille une méthodologie d'observabilité en cynq étapes pour réduire systématiquement le MTTI. En déployant des tests synthétiques continus, une visibilité du chemin saut par saut, une analyse des données de flux, une cartographie de la topologie et une corrélation d'événements, vous pouvez remplacer les accusations mutuelles par des preuves partagées. L'objectif n'est pas de gagner le jeu du blâme plus rapidement, mais d'y mettre fin définitivement.
Analyse technique approfondie : les mécanismes du MTTI
La distinction entre le MTTI et le temps moyen d'identification
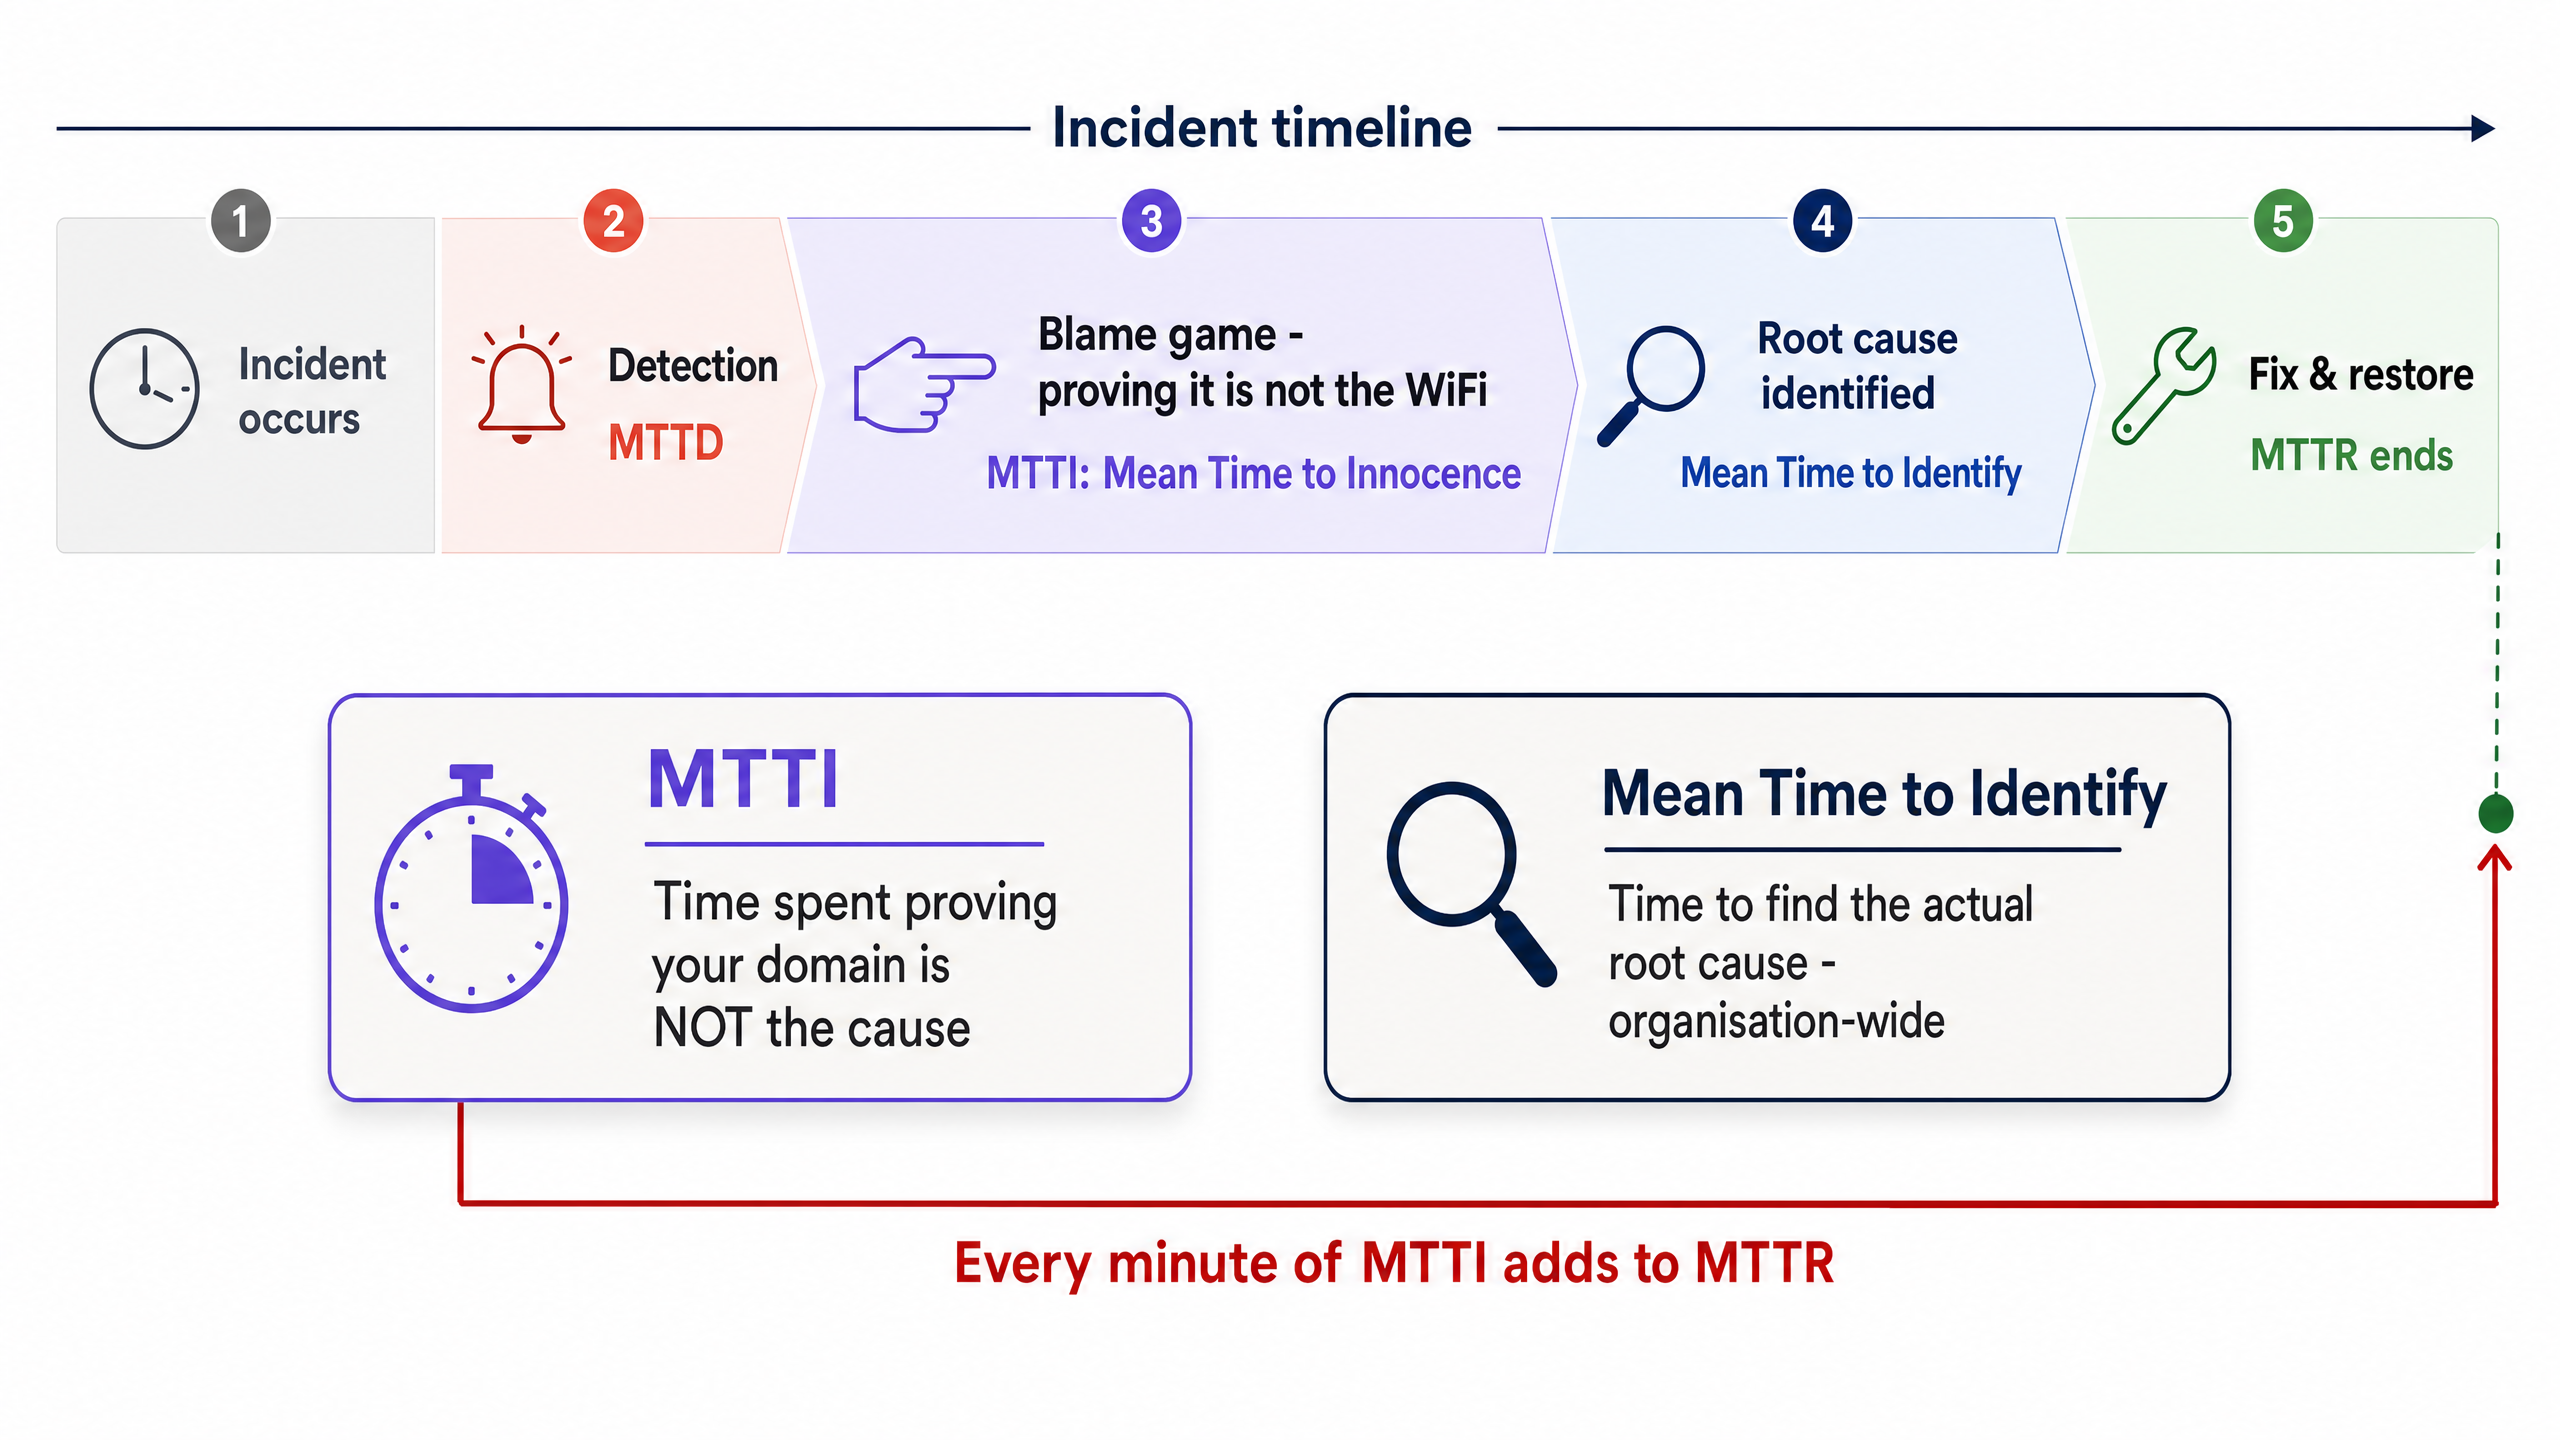
Il est essentiel de séparer le MTTI du temps moyen d'identification. Le temps moyen d'identification est une métrique globale à l'organisation qui suit le temps nécessaire pour trouver la cause racine réelle d'une panne. Le MTTI est une métrique cloisonnée, spécifique à un domaine, qui suit le temps nécessaire à une équipe pour prouver qu'elle n'est pas coupable.
Chaque minute de MTTI s'ajoute directement au MTTR. Si un fournisseur de WiFi géré passe 40 minutes à vérifier manuellement les points d'accès (AP) et les journaux des commutateurs avant de conclure que le problème provient du FAI, le MTTR subit une pénalité de 40 minutes intégrée avant même que la résolution réelle ne commence.
Pourquoi le WiFi est toujours accusé
Dans des environnements desservant 350 millions d'utilisateurs uniques à travers plus de 80 000 sites actifs, Purple constate le même schéma à plusieurs reprises. La couche WiFi est accusée par défaut en raison de trois réalités structurelles :
- Biais de visibilité : L'indicateur de signal WiFi est le seul outil de diagnostic réseau disponible pour l'utilisateur moyen du site.
- Proximité de la périphérie : En tant que dernier saut vers l'appareil client, le WiFi hérite des symptômes de chaque défaillance en amont. Un délai d'attente DNS dépassé chez le FAI semble identique à une panne d'AP du point de vue de l'utilisateur.
- Lacunes de télémétrie : Historiquement, prouver la bonne santé du réseau sans fil nécessitait une intervention manuelle. Si vous ne pouvez pas présenter un bilan de santé impeccable pour la couche sans fil en moins de deux minutes, vous perdez le contrôle de la situation.
La complication du multi-locataire
Dans une entreprise mono-locataire, les équipes réseau possèdent l'intégralité de la pile, de l'AP au pare-feu. Dans les environnements WiFi multi-locataires, la responsabilité est fragmentée.
Un résident en BTR paie le gestionnaire immobilier. Le gestionnaire immobilier contracte un fournisseur de WiFi géré. Le fournisseur de WiFi géré s'appuie sur un circuit FAI tiers et, souvent, sur le réseau de distribution interne du propriétaire. Lorsqu'un résident ne peut pas diffuser de vidéo, le fournisseur doit rapidement disculper le matériel WiFi (Cisco Meraki, HPE Aruba, Ruckus ou Juniper Mist) et isoler la panne au niveau de l'appareil client, du commutateur du bâtiment ou du FAI. Tout échec en la matière nuit à la relation commerciale entre le fournisseur et le gestionnaire immobilier.
Guide de mise en œuvre : la méthodologie en 5 étapes
Pour réduire systématiquement le MTTI, implémentez cette architecture d'observabilité à cinq couches.
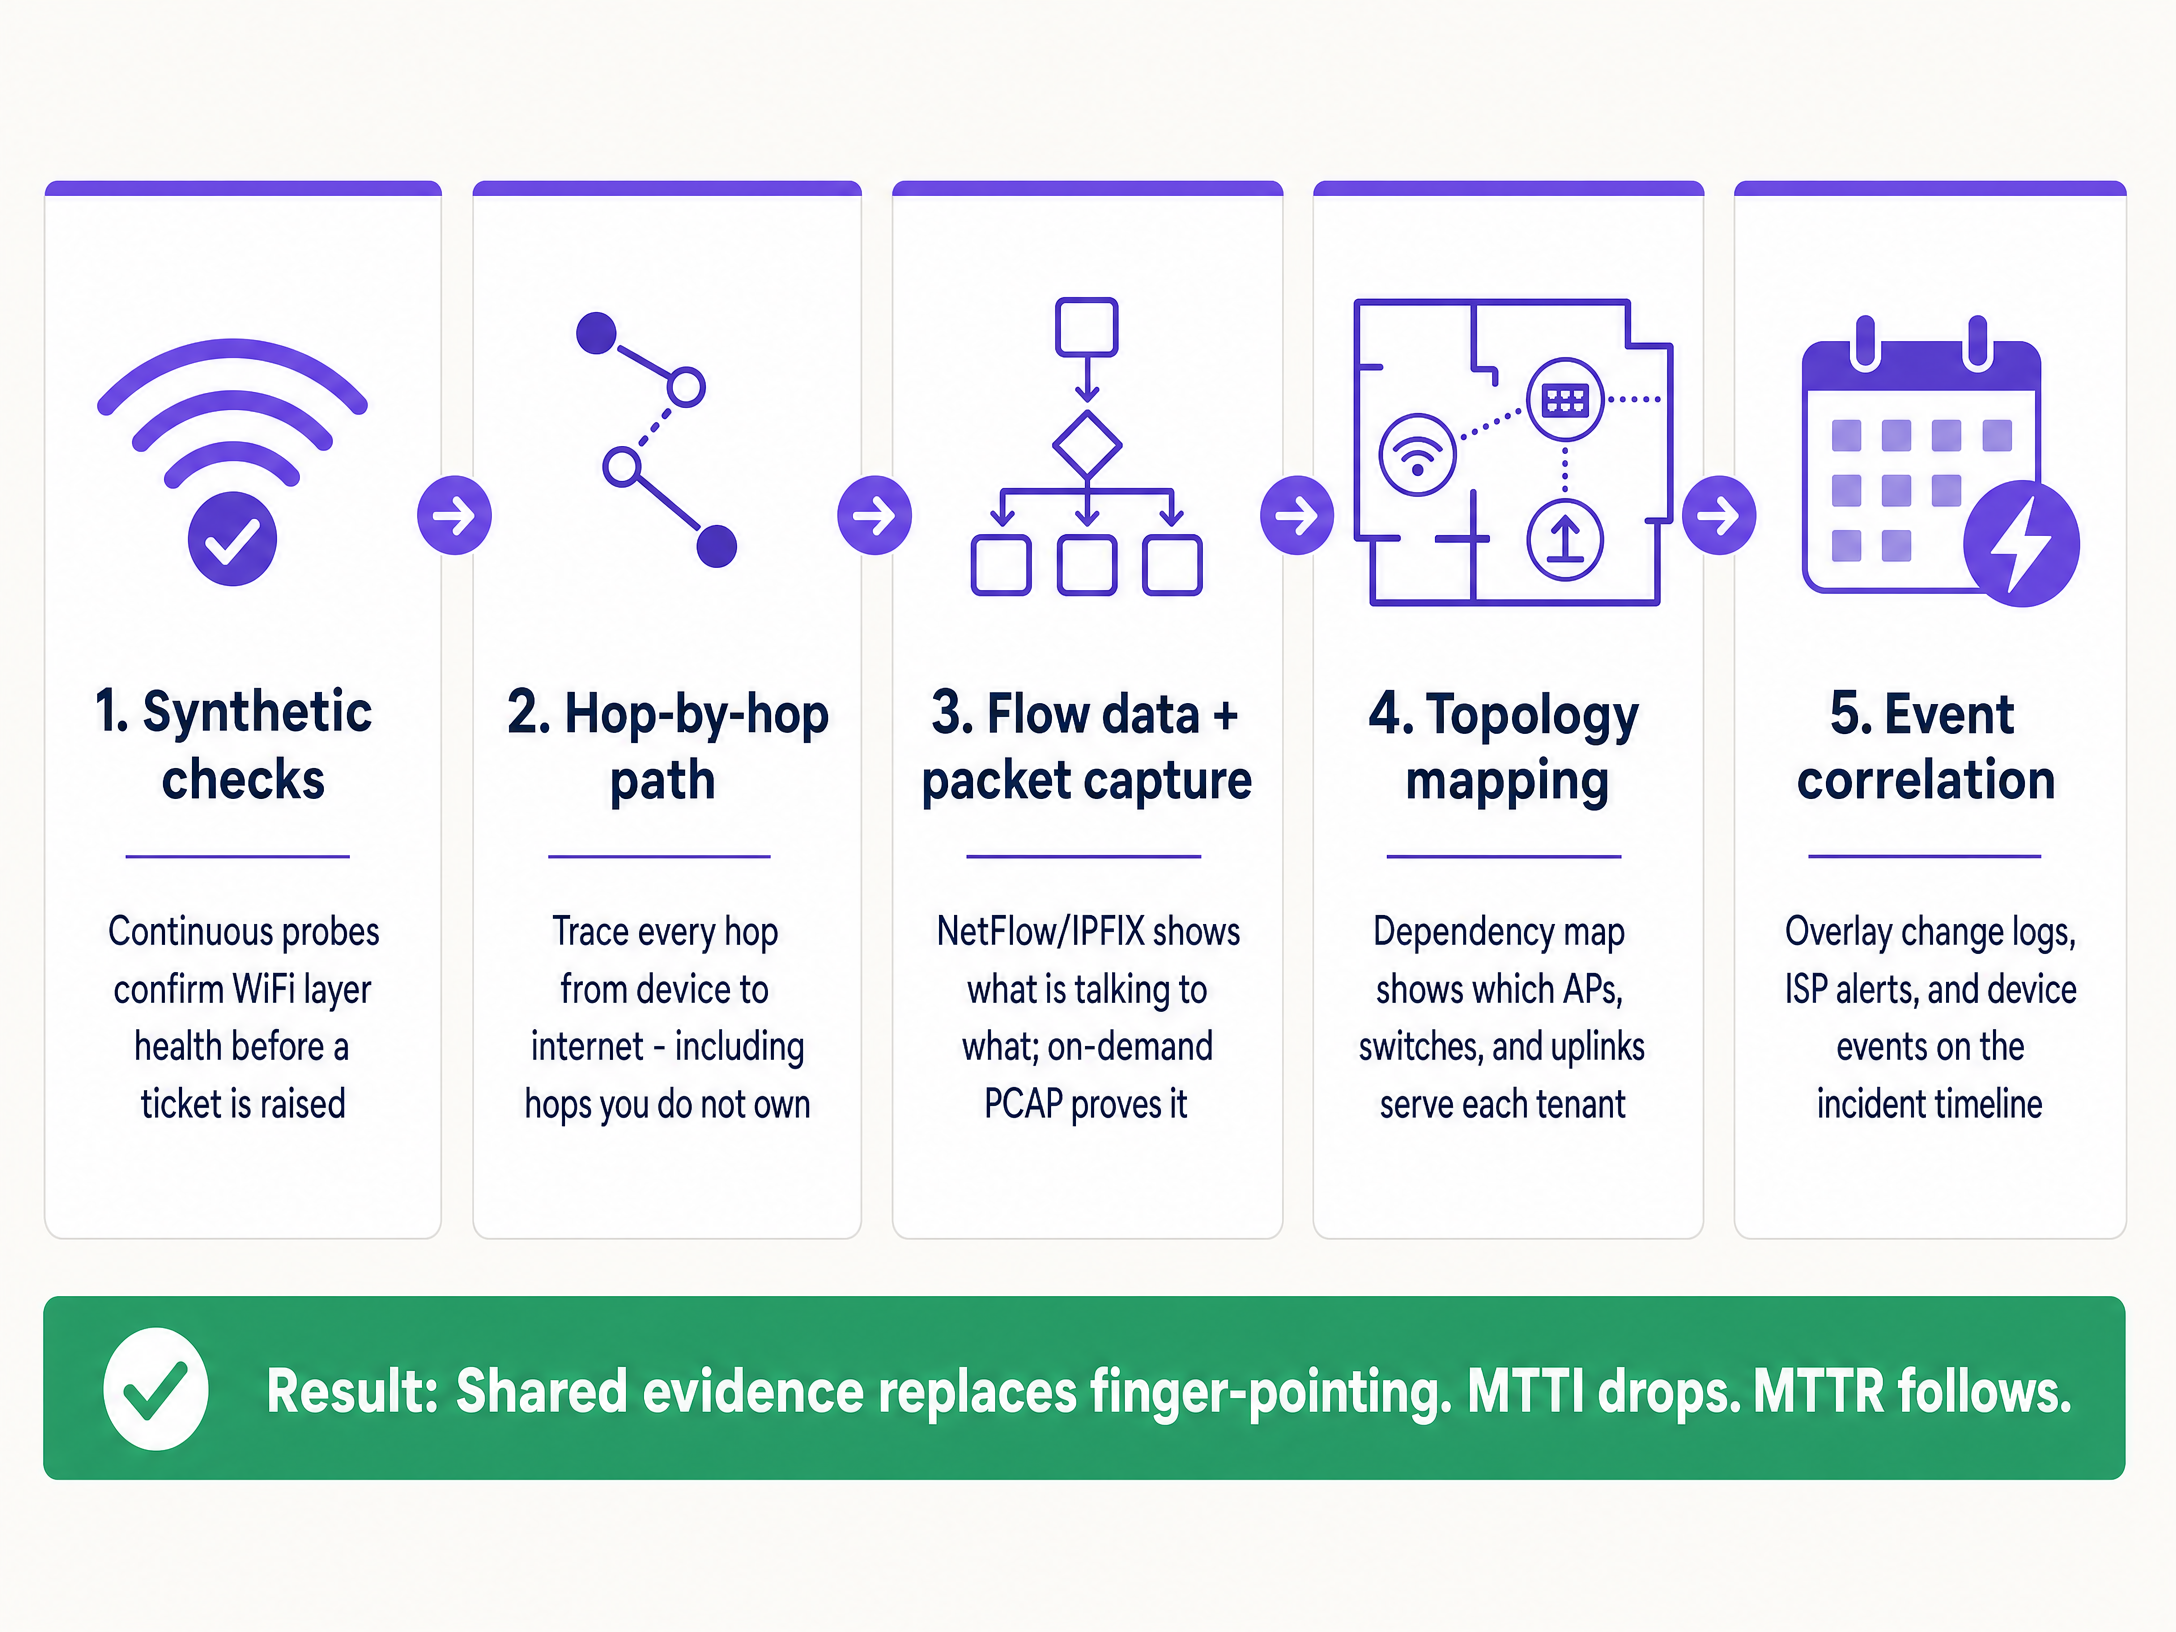
1. Tests synthétiques continus
N'attendez pas qu'un utilisateur se plaigne. Déployez des sondes synthétiques automatisées qui simulent en continu le comportement des utilisateurs depuis la périphérie du réseau.
- Mise en œuvre : Configurez les AP ou des capteurs dédiés pour exécuter des tests planifiés pour la réponse DHCP, la résolution DNS, l'accessibilité HTTP et les flux d'authentification (tels que 802.1X ou les connexions par Captive Portal).
- Résultat : Lorsqu'un ticket est ouvert, vous vérifiez d'abord le tableau de bord synthétique. Si les sondes affichent une accessibilité HTTP parfaite au moment exact de la plainte, vous disculpez immédiatement la couche WiFi et le circuit WAN, pour vous concentrer sur l'appareil client spécifique ou l'application cible.
2. Visibilité du chemin saut par saut
Prouver que votre matériel est en bonne santé ne suffit pas si vous ne pouvez pas prouver que le chemin vers Internet est libre.
- Mise en œuvre : Utilisez des outils de visualisation de chemin pour suivre le trafic depuis la couche d'accès à travers le LAN, via le point de démarcation, et jusque dans le réseau du FAI.
- Résultat : En cas de pic de latence, un tracé de chemin révèle exactement quel nœud a introduit le retard. Si les sauts un à quatre (votre domaine) affichent une latence de 2 ms, et que le saut cinq (le routeur de périphérie du FAI) affiche une latence de 150 ms et 12 % de perte de paquets, vous disposez d'une preuve définitive à présenter au FAI.
3. Données de flux et capture de paquets à la demande
Lorsque les utilisateurs signalent des défaillances spécifiques à une application, vous avez besoin d'une visibilité au niveau de la conversation.
- Mise en œuvre : Exportez les données NetFlow ou IPFIX de vos commutateurs centraux ou pare-feu. Assurez-vous que le matériel de votre couche d'accès prend en charge la capture de paquets (PCAP) à distance et à la demande, sans nécessiter la présence d'un ingénieur sur site.
- Résultat : Les données de flux prouvent si le trafic vers un service spécifique quitte correctement votre réseau. Si c'est le cas, le réseau est hors de cause. Si dSi une preuve d'analyse plus approfondie est requise, une capture PCAP ciblée sur le VLAN spécifique fournit une preuve indéniable de retransmissions TCP ou de réinitialisations côté serveur.
4. Cartographie de la topologie et des dépendances
Dans un environnement multi-tenant, isoler le rayon d'impact est le moyen le plus rapide de catégoriser une panne.
- Mise en œuvre : Maintenez une carte des dépendances en direct et mise à jour de manière dynamique, reliant chaque AP à son commutateur, sa liaison montante et son circuit WAN, mappée par rapport aux VLAN des tenants.
- Résultat : Si une panne affecte des AP sur plusieurs étages mais uniquement sur un seul commutateur, le problème vient du commutateur. Si elle affecte tous les AP mais uniquement le VLAN d'un seul tenant, il s'agit d'un problème de configuration logique. Une délimitation rapide évite de perdre du temps à inspecter une infrastructure saine.
5. Corrélation d'événements
Des données sans contexte prolongent les investigations.
- Mise en œuvre : Intégrez les journaux de modifications, les alertes de maintenance des FAI, les mises à jour de firmware du matériel et les tickets des utilisateurs dans une vue chronologique unique.
- Résultat : Superposer un pic d'échecs d'authentification avec un événement d'expiration de certificat Microsoft Entra ID survenu 10 minutes auparavant permet d'identifier immédiatement la cause racine, en contournant complètement le matériel réseau.
Bonnes pratiques
- Standardiser le parc matériel : Limitez les déploiements aux fournisseurs d'entreprise de référence (Cisco Meraki, HPE Aruba, Ruckus, Juniper Mist, Ubiquiti UniFi, Cambium, Extreme, Fortinet) qui exposent des API pour les tests synthétiques et le PCAP à distance.
- Automatiser les preuves : Configurez votre plateforme de surveillance pour joindre automatiquement les résultats des tests synthétiques et les tracés de chemin aux tickets ITSM dès leur création.
- Partager le tableau de bord : Offrez aux gestionnaires immobiliers un accès en lecture seule à un tableau de bord de santé de haut niveau. La transparence désamorce le jeu des reproches.
- Suivre formellement le MTTI : Mesurez le temps écoulé entre la création du ticket et le moment où votre équipe apporte la preuve de non-responsabilité. Traisez-le comme un KPI principal aux côtés du MTTR.
Dépannage et atténuation des risques
- Risque : La boucle 'Aucune anomalie détectée' : Les utilisateurs signalent des problèmes, mais les vérifications synthétiques sont au vert.
- Atténuation : Le problème est probablement spécifique à l'appareil ou lié à des interférences RF (interférence co-canal ou obstacle physique). Utilisez les analyses côté client pour vérifier le RSSI et l'historique d'itinérance de l'appareil spécifique.
- Risque : Le déni du FAI : Le FAI refuse de reconnaître la panne malgré vos preuves.
- Atténuation : Fournissez des tracés de chemin saut par saut indiquant l'adresse IP exacte où commence la perte de paquets. Partagez des captures PCAP démontrant une sortie propre depuis votre point de démarcation. Des données concrètes imposent une escalade au-delà du support de niveau 1.
- Risque : Échecs du Captive Portal : Les utilisateurs rejettent la faute sur le WiFi lorsque le portail ne se charge pas.
- Atténuation : Isolez le fournisseur d'identité. Vérifiez l'état de l'intégration (Microsoft Entra ID, Okta, Google Workspace). Si le réseau autorise le trafic de pré-authentification mais que l'IdP expire, le réseau est hors de cause.
ROI et impact commercial
La réduction du MTTI apporte une valeur commerciale mesurable bien au-delà du simple gain d'heures d'ingénierie.
- Réduction du MTTR : Éliminer 40 minutes de rejet de responsabilité lors d'un incident réduit directement les temps d'arrêt, protégeant ainsi le chiffre d'affaires dans les secteurs du commerce de détail et de l' hôtellerie .
- Respect des SLA : Une disculpation plus rapide évite que des pénalités injustes ne soient imposées au fournisseur de WiFi géré lorsque la panne incombe au FAI ou à l'infrastructure du bâtiment.
- Rétention des clients : Dans le secteur du WiFi multi-tenant, les gestionnaires immobiliers renouvellent leurs contrats avec les fournisseurs qui offrent de la transparence et des réponses rapides. Les preuves partagées renforcent la confiance ; les arguments défensifs la détruisent.
- Optimisation des ressources : Les ingénieurs réseau de niveau 3, hautement qualifiés, consacrent leur temps à concevoir des solutions plutôt qu'à prouver manuellement que le réseau fonctionne correctement.
Définitions clés
Mean Time to Innocence (MTTI)
The average time required for a specific IT team to prove, using objective data, that their domain or infrastructure is not the root cause of a reported incident.
Critical for managed WiFi providers who must defend their service against property managers and ISPs.
Mean Time to Identify
The organisation-wide metric tracking the total time elapsed from incident detection to the discovery of the actual root cause.
MTTI is a subset of this metric. Reducing MTTI directly reduces the overall time to identify.
Synthetic Checks
Automated, continuous tests that emulate user traffic (e.g., DNS lookups, HTTP requests) to proactively monitor network health.
Used to prove the WiFi layer was functioning correctly at the exact moment a user complained.
Hop-by-Hop Path Visibility
Telemetry that traces network traffic node-by-node from the client to the destination, measuring latency and loss at each specific router or switch.
Essential for proving a fault lies in an ISP network or a landlord's distribution switch, rather than the managed WiFi hardware.
Flow Data (NetFlow/IPFIX)
Network protocol data that provides a summary of traffic conversations, showing source, destination, protocol, and volume.
Used to prove that specific application traffic is successfully leaving the local network.
On-Demand Packet Capture (PCAP)
The ability to remotely record raw network traffic from an access point or switch for forensic analysis.
The ultimate proof used to demonstrate server-side errors or client device misbehaviour.
Blast Radius
The scope of impact of a specific incident (e.g., one user, one AP, one switch, one tenant, or the entire building).
Determining the blast radius via topology mapping is the fastest way to exclude healthy infrastructure from an investigation.
Event Correlation
The practice of overlaying different data streams (logs, alerts, updates) on a single timeline to identify cause and effect.
Used to prove that a network outage was caused by a third-party change, such as an unannounced ISP maintenance window.
Exemples concrets
A 350-room hotel reports that in-room WiFi is slow across the entire property. The front desk blames the managed WiFi provider. How do you exonerate the network and find the root cause?
- Check the synthetic probes: DNS and HTTP reachability tests show the APs have a clean connection to the internet. 2. Review the topology map: The issue affects all APs across all switches, ruling out edge hardware. 3. Execute a path trace: The trace shows 2ms latency within the hotel LAN, but 180ms latency at the third hop (the ISP's aggregation router). 4. Export the evidence: Send the path trace screenshot to the hotel manager and the ISP.
A national retailer reports point-of-sale (POS) terminals in one region are dropping connections to the payment processor. The network team is blamed for a firewall or routing misconfiguration.
- Isolate the blast radius: Confirm only POS terminals (specific VLAN) are affected; guest WiFi and back-office systems are healthy. 2. Analyse flow data: NetFlow confirms traffic destined for the payment processor's IP range is successfully leaving the store routers. 3. Capture packets: An on-demand PCAP on the POS VLAN reveals the payment processor's server is sending TCP resets (RST). 4. Share the PCAP with the payment processor's support team.
Questions d'entraînement
Q1. A tenant in a coworking space complains they cannot access their corporate VPN. Other tenants are browsing the internet without issue. What is the most efficient way to prove the WiFi network is not at fault?
Conseil : Consider the blast radius and the specific type of traffic failing.
Voir la réponse type
First, use the topology map to confirm the blast radius is limited to one user or one specific service, ruling out a general AP or switch failure. Second, analyse flow data (NetFlow/IPFIX) for that client's IP address. If the flow data shows the VPN traffic (e.g., UDP 500 or TCP 443) is leaving the network cleanly, the WiFi and LAN are innocent. The issue is either the client's VPN configuration or the corporate firewall blocking the connection.
Q2. Your monitoring dashboard shows an AP has gone offline, but the property manager insists the WiFi is broken because the ISP is down. How do you prove the issue is internal power, not the ISP?
Conseil : Look for correlation between infrastructure state and external events.
Voir la réponse type
Use event correlation and topology mapping. If the topology map shows only one AP is offline while others on the same switch are functioning, the ISP circuit is clearly active. Event correlation might show a PoE (Power over Ethernet) failure log from the switch port connected to that specific AP. This proves the issue is local hardware or cabling, not the WAN circuit.
Q3. A stadium operations director claims the WiFi failed during halftime because ticket scanners stopped working. You need to exonerate the network in under two minutes. What telemetry do you use?
Conseil : You need historical proof of health at the exact moment of the reported failure.
Voir la réponse type
Pull the historical data from the continuous synthetic checks. Show the operations director the dashboard confirming that during the exact 15-minute halftime window, the APs were successfully resolving DNS and reaching the ticketing server's IP address with low latency. This immediately proves the wireless network was healthy and shifts the investigation to the ticketing application servers, which likely buckled under the sudden load.
Continuer la lecture de cette série
Clés pré-partagées dynamiques (DPSK) pour la sécurité multi-tenant
Ce guide de référence technique explore les clés pré-partagées dynamiques (DPSK) comme une alternative hautement sécurisée et fluide à la norme 802.1X pour les environnements WiFi multi-tenants. Il détaille l'architecture sous-jacente, les implémentations des fournisseurs, le routage VLAN dynamique et l'automatisation du cycle de vie pilotée par API. Les responsables informatiques et les architectes réseau y trouveront des conseils pratiques pour déployer DPSK afin d'obtenir une isolation robuste des locataires, une conformité réglementaire et une intégration fluide des appareils.
Gestion de l'épuisement des adresses IP publiques dans les résidences étudiantes
This guide provides a definitive technical reference for network architects deploying Carrier-Grade NAT (CGNAT) and Port Address Translation (PAT) to manage IPv4 exhaustion in dense student housing and multi-tenant WiFi environments. It covers NAT444 architecture, RFC 6598 shared address space, Port Block Allocation sizing, GDPR-compliant logging strategies, and a dual-stack IPv6 migration path. The guide is essential for any operator managing hundreds or thousands of concurrent devices on a constrained public IP pool, providing actionable configuration guidance, real-world case studies, and ROI analysis.
Résoudre les interférences WiFi dans les bâtiments MDU à haute densité
Ce guide de référence technique fournit aux responsables informatiques et aux exploitants immobiliers des stratégies concrètes pour éliminer les interférences WiFi dans les bâtiments multi-logements (MDU) à haute densité. Il couvre les causes profondes des interférences co-canal et canal adjacent, le passage architectural à une infrastructure WLAN gérée de manière centralisée, et les techniques sécurisées d'isolation des locataires. La mise en œuvre de ces stratégies réduit les frais de support, améliore la satisfaction des locataires et transforme la connectivité en un service générateur de revenus.