Physical venue analytics benchmark calculator
Compare your footfall, return rate and revisit timing with benchmarks from 10 billion venue visits.
75% of shoppers are first-time visitors; 54% of those who return do so within 10 days.
Used to value recovered visits.
Baseline non-return rate
75%
~75,000 visitors a month do not come back on their ownNew vs repeat visitors
75% / 25%
First-time vs returning footfallReturn within 10 days
54%
Of visitors who come back at allAverage dwell
48 min
From connected WiFi sessionsWhen returning visitors come back
Time between visits, retail and shopping centres
Most engaged audience
From consented splash-page logins
Women aged 18-34 (38% of engaged visitors)
Where guests share age range and contact details at login, you can segment and send relevant offers during or straight after a visit.
Do you know how many people visit your venue on a daily, weekly or monthly basis? Do you know how many of those people are new or repeat visitors? Do you know how frequently your repeat visitors return? Do you know your customer demographics?
If we were talking about your website, chances are you'd be able to answer these questions quite quickly. You'd then use the information to improve the on-site user experience with the aim of reducing bounce, increasing time on page and ultimately driving more conversions.
We track everything online because it's easy - and with free tools like Google Analytics, there's no excuse.
However, when it comes to understanding your physical spaces, things can get a little more complicated.
Point of sale systems are great for understanding transactions in-store but they can't give you a holistic overview of your customers and how they behave.
So, to help businesses answer these questions, we've analysed 110 million unique individuals, across 10 billion visits to 45,000 Purple WiFi enabled venues around the world. We then broke this data down by industry.
I think it is important to mention here that even if you do know the answers to these questions - do you know how your performance compares to that of your peers or the industry average? It's one thing to have a metric that you can measure, what is more difficult to understand is whether that performance is any good, or how well you are serving your audience.
Anyway, here's what we found.
For the purpose of this example, I'm going to focus on retail. If retail isn't relevant for you, you can download a free copy of your industry specific report here.
Return rates
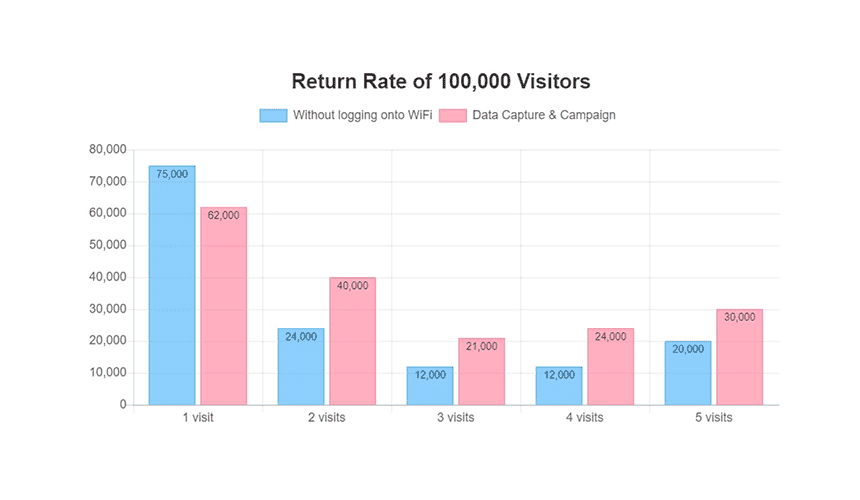
Based on an estimated footfall of 100,000 visitors per month, on average, we found that 75% of your visitors will not return to your venue.
However, when you capture customer data via WiFi analytics, and follow up with tailored marketing campaigns, you can increase your customer return rates quite considerably.
Frequency of visits
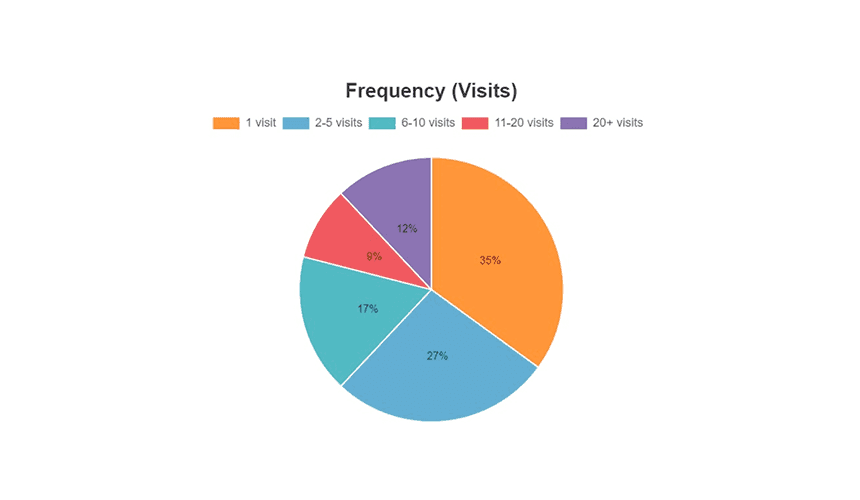
As with many brands, customer retention and loyalty is very important. The chart below shows how many customers visit your venue once, twice, right through to 20+ visits.
We have identified that across the retail industry, 27% of people will visit your venue 2-5 times. Being able to identify trends and patterns in this data across your different stores can help you develop strategies to achieve increased retention rates.
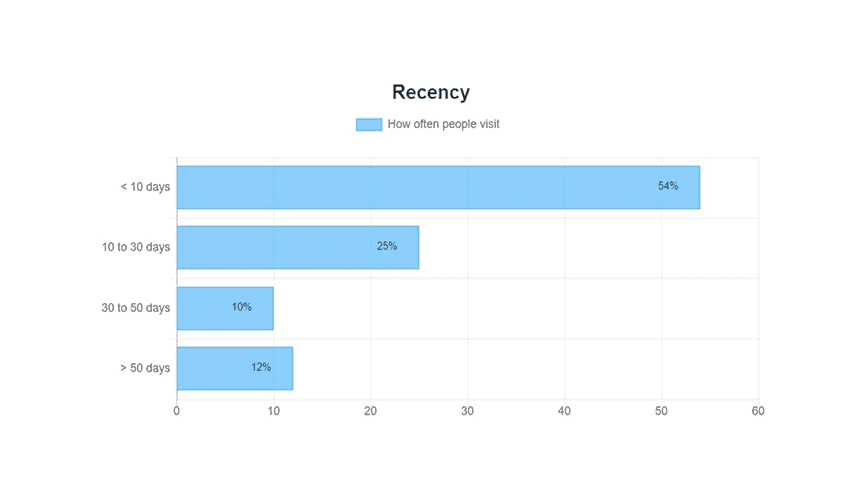
Recency
The graph below shows the average length of time between customer visits. We found that across the retail industry, 54% of consumers visit your venue again in less than 10 days. This suggests that loyalty is high amongst the % of customers that do return to your venue.
This data can be used to create a sense of urgency - increasing recency.
We see it all the time, emails that encourage us to make a purchase quickly before a sale ends. More often than not, it's effective.
Being able to capture customer data through WiFi analytics and then market offers or discounts to consumers is an effective strategy that positively impacts recency.
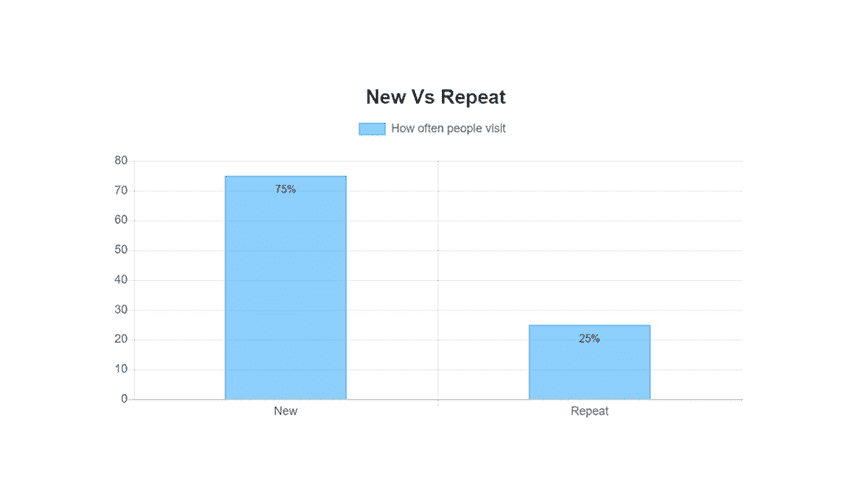
New vs. repeat
On average, in retail, 75% of your customers are new vs. 25% which are repeat. Being able to identify your new vs. repeat visits helps you focus efforts on either driving new business or improving your customer retention depending on your commercial goals.
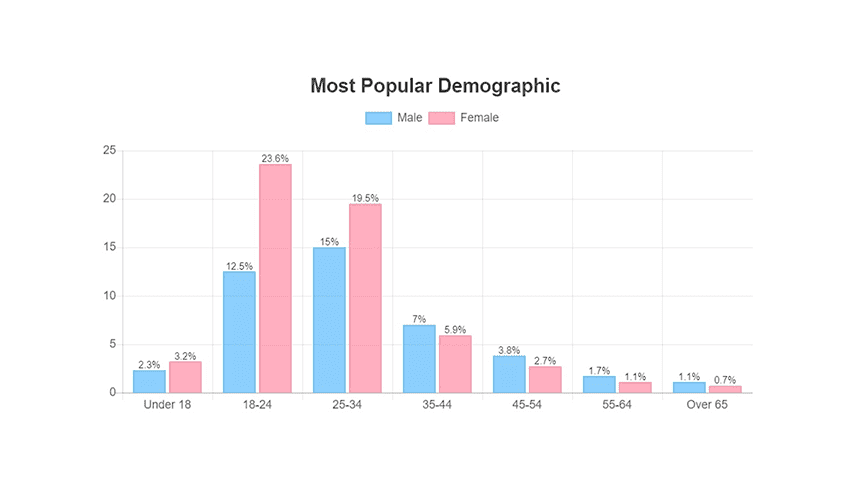
Most popular demographic
Across the retail industry, we found that the most popular demographic is females aged 18-34.
We appreciate that based on the type of store, demographics are likely to be different across retail, however, the principle remains the same.
Understanding who your most popular demographic is allows you to personalise customer communications which will increase conversion rates and drive spend. You can also use this data to identify less popular demographics you wish to target and tailor marketing efforts to impact this.
To download a copy of our retail report, click here.
Our performance reports provide just a snapshot of the data you can capture and analyse with WiFi analytics.
With a full enterprise licence, you can run up to 6,000 different reports, giving you real, in-depth insights into your physical spaces that can be used to impact business decisions.
Interested? Click here to try Purple for free, or get a demo.