跳至主要内容

1.1亿独立用户和100亿次访问向我们揭示了关于您场所的哪些信息

作者:Richard Ellor
29 January 2019
1 分钟阅读
1.1亿独立用户和100亿次访问向我们揭示了关于您场所的哪些信息
Global Dataset-110M Unique Users | 10B Visits | 45k Venues

Physical venue analytics benchmark calculator

Compare your venue footfall, return rates, and recency curves against verified industry benchmarks.

Request benchmark audit

Based on 45,000 global venues. 75% of shoppers are first-time visitors; 54% of returning shoppers come back within 10 days.

100,000 visitors
5k100k250k500k+
£

Used to model revenue gain from recovered footfall.

Baseline non-return rate
75%

~75,000 visitors never return without automated remarketing.

New vs repeat footfall
75% / 25%

75% first-time vs 25% loyal repeat visitors.

Recency window (<10 days)
54%

54% of repeat visitors return within 10 days of their initial visit.

Average dwell time
48 mins

Average on-site presence tracked via WiFi probe request duration.

Customer visit recency distribution

Time elapsed between repeat visits across Retail & Shopping Centres

Less than 10 days (urgent window)54%
11 to 30 days (warm window)28%
Over 30 days (cold / at-risk)18%

Primary engaged demographic

Identified via verified captive portal login telemetry

Females aged 18-34 (38% of engaged visitors)

Captive portal authentication captures exact age bracket, verified email, and social profile data. This enables automated segmentation to deliver targeted promotional messaging during or immediately after on-site visits.

Data collection confidence:High (10B visits sampled)

您知道每天、每周或每月有多少人访问您的场所吗?您知道这些人中有多少是新访客或常客吗?您知道您的常客多久返回一次吗?您了解您的客户群人口统计数据吗?

如果我们在讨论您的网站,您很可能能够快速回答这些问题。然后,您会利用这些信息来改善网站上的用户体验,目的是减少跳出率、增加页面停留时间并最终推动更多转化。

我们在网上跟踪一切,因为这很容易 - 并且有像 Google Analytics 这样的免费工具,没有任何借口不这样做。

然而,当涉及到了解您的物理空间时,事情可能会变得稍微复杂一些。

POS 系统非常适合了解店内交易,但它们无法为您提供关于客户及其行为方式的整体概览。

因此,为了帮助企业回答这些问题,我们分析了全球 45,000 个启用了 Purple WiFi 的场所中 100 亿次访问的 1.1 亿个独特个体。然后,我们按行业对这些数据进行了细分。

我认为这里有必要提及的是,即使您确实知道这些问题的答案 - 您是否知道您的表现与同行或行业平均水平相比如何?拥有一项可以衡量的指标是一回事,而更难理解的是该表现是否足够优秀,或者您对受众的服务效果如何。

无论如何,以下是我们的发现。

在本例中,我将重点关注零售业。如果零售业与您无关,您可以在 此处 下载特定行业报告的免费副本。

回头率

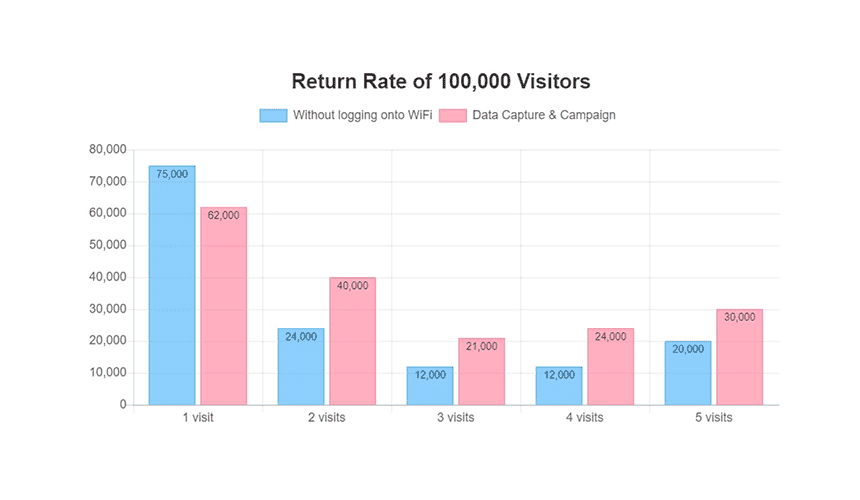
根据每月 100,000 名估算访客客流量,我们发现,平均有 75% 的访客不会返回您的场所。

然而,当您通过 WiFi 分析捕获客户数据,并跟进个性化的营销活动时,您可以相当大程度地提高客户的回头率。
到访频率

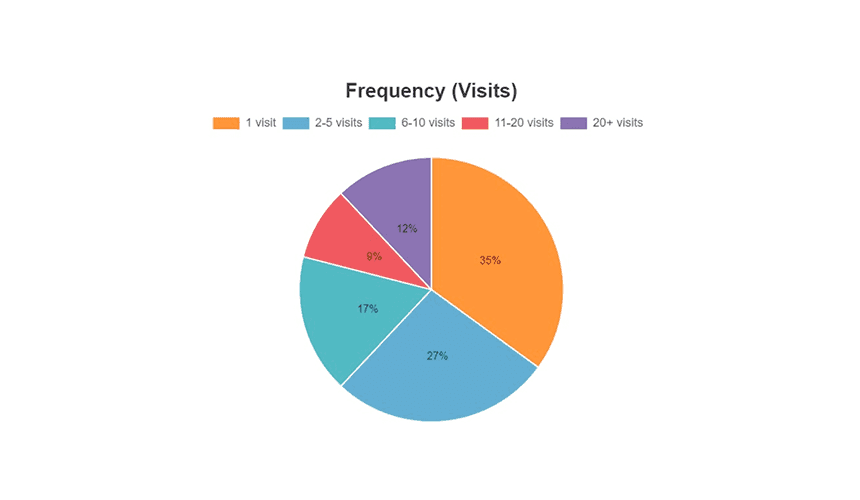
与许多品牌一样,客户留存和忠诚度非常重要。下面的图表显示了有多少客户访问了您的场所一次、两次,一直到 20 次以上。

我们发现,在整个零售行业中,27% 的人会访问您的场所 2 - 5 次。能够识别不同门店中这一数据的趋势和模式,可以帮助您制定策略,以实现更高的留存率。
近期活跃度

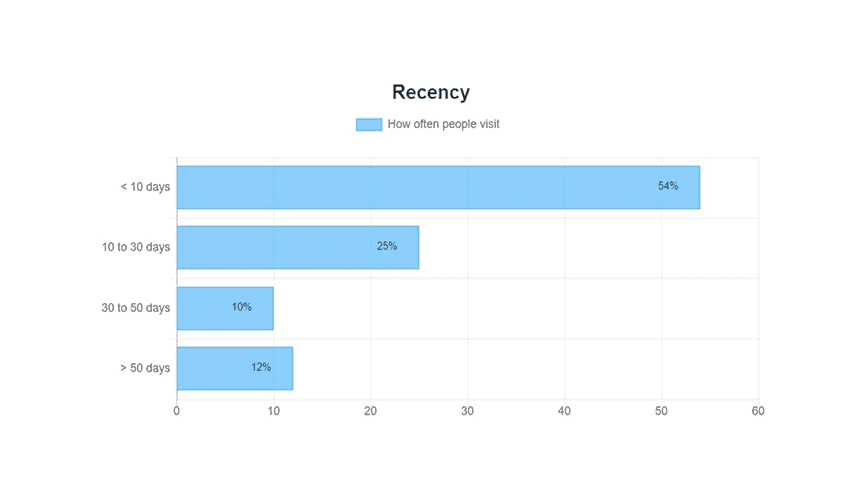
下图显示了客户两次到访之间的平均时间间隔。我们发现,在整个零售行业中,54% 的消费者会在不到 10 天的时间内再次光顾您的场所。这表明,在重返您场所的客户群体中,忠诚度是非常高的。

这些数据可用于营造紧迫感 - 从而提高近期活跃度。

我们经常看到鼓励我们在促销结束前尽快购买的电子邮件。通常情况下,这很有效。

能够通过 WiFi 分析捕获客户数据,然后向消费者推销优惠或折扣,是一种行之有效的策略,可以对重返频次产生积极影响。
新客户与回头客流重访客

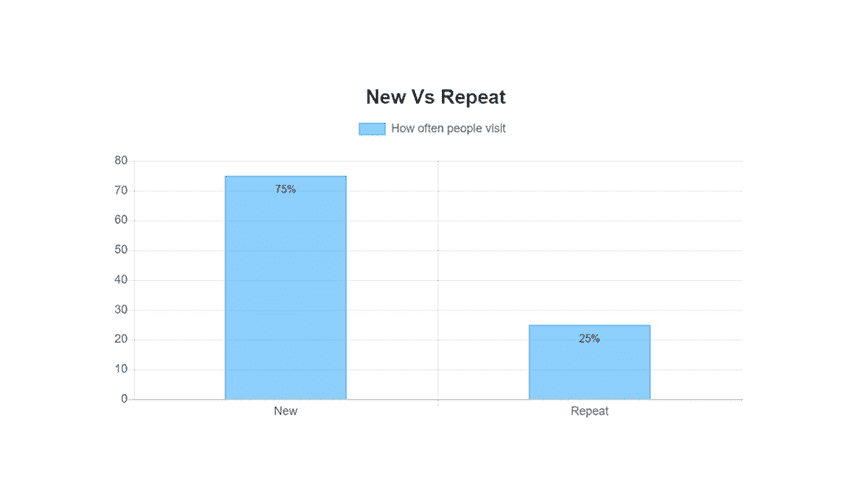
在零售业中,平均有 75% 的客户是新客户,25% 是常客。能够区分新老访客有助于您根据商业目标,将精力集中在吸引新业务或提高客户留存率上。
最受欢迎的人群

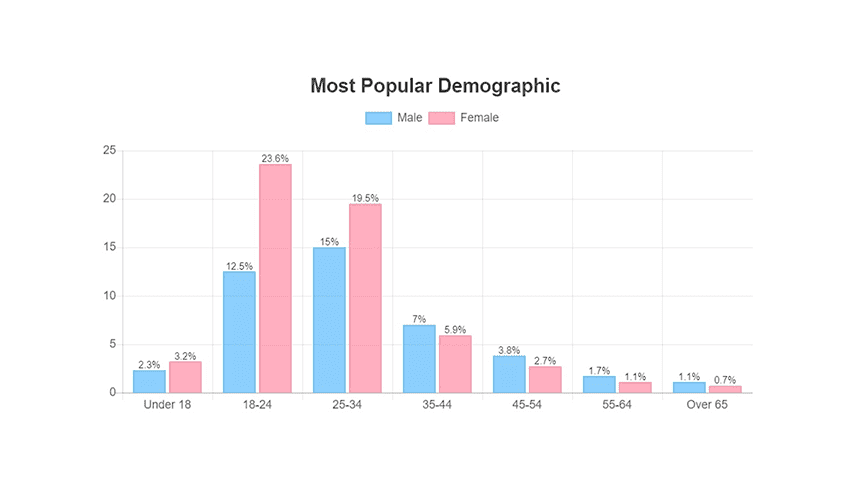
在整个零售行业中,我们发现最受欢迎的人群是18 - 34岁的女性。

我们理解,根据商店类型的不同,整个零售业的人口统计数据可能会有所不同,但原理是一样的。

了解谁是您最受欢迎的人口统计群体,让您能够进行个性化的客户沟通,从而提高转化率并推动消费。您还可以利用这些数据来识别您希望针对的较不受欢迎的人口统计群体,并调整营销策略以产生影响。
要下载我们的零售报告副本,请 点击此处

我们的绩效报告仅展示了您通过 WiFi 运营分析 可以捕获和分析的数据缩影。

凭借完整的企业许可证,您可以运行多达 6,000 种不同的报告,从而为您提供对物理空间的真实、深入的洞察,这些洞察可用于影响业务决策。

感兴趣吗?点击此处 免费试用 Purple,或获取演示。
常见问题

What is the average visitor return rate for physical retail venues?

According to Purple's global study of 110 million unique individuals across 45,000 venues, approximately 75% of first-time visitors do not return to a venue within a month without automated remarketing. Capturing verified customer contacts through WiFi analytics allows venues to run targeted retention campaigns that significantly lift return rates.

What is the 10-day recency window in venue footfall analytics?

Purple's benchmark research shows that 54% of returning retail shoppers revisit a venue within 10 days of their initial visit. This 10-day period represents the most urgent, high-conversion window for sending automated follow-up incentives and promotional reminders via SMS or email.

How do physical venue analytics compare to Google Analytics for websites?

While Google Analytics tracks online pageviews, bounce rates, and session durations, physical venue analytics use WiFi presence probe requests and captive portal logins to measure passerby footfall, bounce dwell (visits under 3 minutes), zone dwell times, new versus repeat visit ratios, and in-store purchase conversion funnels.

What percentage of venue footfall consists of new vs repeat visitors?

Across physical retail environments, an average of 75% of footfall consists of first-time visitors and 25% represents repeat visitors. Understanding this ratio helps venue operators determine whether to allocate budget toward customer acquisition or loyalty retention.

How does captive portal WiFi turn anonymous footfall into first-party CRM data?

When visitors connect to guest WiFi through a branded captive portal, they provide verified contact details (such as email, age bracket, and social profile) under GDPR and CCPA compliant consent. This enriches CRM systems with physical visit frequency, dwell duration, and location history.

准备好开始了吗?

预约专家演示,了解 Purple 如何助力您实现业务目标。

联系专家